Abstract
The goal of this study was to investigate the lipid accumulation and lipotoxicity of free fatty acids (FFAs) induced in HepG2 cells. HepG2 cells were co-incubated with various concentrations of FFAs for 24h and the intracellular lipid contents were observed by Oil Red O and Nile Red staining methods. The lipotoxicity of HepG2 cells were then detected by Hoechest 33342/PI, Annexin V-FITC/PI double-staining and 3-(4,5-dimethylthiazol-2-yl)-2,5-di phenyltetrazolium bromide (MTT) experiment tests. The experiments showed a lipid accumulation and lipotoxicity by increasing FFA concentration gradients. Through cell morphological observation and quantitative analysis, FFAs have shown to increase in a dose-dependent manner compared with the control group. The data collected from hoechst 33342/PI, annexin V-FITC/PI double staining and also MTT experiments showed that cell apoptosis and necrosis significantly increased with increasing FFA concentrations. Apoptosis was not obvious in the 1 mM FFAs-treated group compared to the other two groups. In a certain concentration range, FFAs induced intracellular lipid accumulation and lipotoxicity of HepG2 cells in a dose-dependent manner.
Keywords: Free fatty acids, lipid accumulation, lipotoxicity, HepG2 cells, nonalcoholic fatty liver disease
Introduction
Nonalcoholic fatty liver disease (NAFLD) is the most common liver disease that affects millions of people worldwide characterized by a clinical and pathological syndrome due to liver cell steatosis and lipidosis [1]. NAFLD encompasses a spectrum of liver diseases ranging from a benign fatty liver disorder to the more severe nonalcoholic steatohepatitis (NASH) that may progress to cirrhosis in up to 25% of patients [2]. Despite the increasing prevalence of NAFLD, the exact molecular and cellular mechanisms remain obscure and the effective therapeutic strategies are still limited. It is widely accepted that lipid accumulation is the main cause of NAFLD causing fatty tissue degeneration [3]. This is mainly due to a lipid metabolism disorder caused by fat deposition in the liver. Moreover, cell viability decreases due to the imbalance between the anti-oxidation/oxidation systems resulting in lipid peroxidation. Oxidative stress in hepatocyte is due to a buildup of a large number of free radicals and inflammatory factors. Moreover, the infiltration of inflammatory cells may gradually cause fatty hepatitis, liver necrosis, and fibrosis. Therefore, ideal NAFLD therapy must target the disease by reducing lipid accumulation. In other words, accumulation of neutral lipids in the liver particularly triglycerides (TG) is the main indicator of NAFLD. This lipid accumulation in hepatocytes results from an imbalance between lipid availability (circulating lipids uptake or de novo lipogenesis) and lipid metabolism (via fatty acid oxidation) causing eventual lipoperoxidative stress and hepatic injury [4].
The main fatty acids in the human body consist of palmitic acid (PA) and oleic acid (OA) [5]. They are widely used in vitro to induce steatosis in cultured human liver cell lines or primary cells in addition to simulating steatosis in vivo [6]. Therefore, the intracellular absorption of FFAs is of utmost importance in understanding accumulation of fatty acids in liver cells and how it relates to NAFLD. In this present study, we will examine the FFA induced lipid accumulation in HepG2 cells and show the characteristics of the cytotoxicity caused by such lipid accumulation.
Materials and methods
Cell culture treatment
HepG2 cells, a human hepatoblastoma cell line, were culture in high glucose Dulbecco's modified Eagle's medium supplemented with 100 U/ml penicillin, 100 U/ml streptomycin and 10% fetal bovine serum (FBS), and kept at 37 °C in a humidified atmosphere of 5% CO2. All cells were plated in cell culture flasks at least 24 h before treatment. To induce FFA overloading, HepG2 cells at 70% confluence were exposed to a mixture of long-chain FFAs (oleic acid/palmitic acid, 2:1) with different concentrations in media containing 1% FFAs-free BSA as previously described [7]. Stock solutions of 30 mM FFAs were conveniently diluted in culture medium containing 1% BSA to obtain the desired final concentrations.
Intracellular lipid content assessment
HepG2 cells were plated in 25cm2 flask at 70% confluence and co-incubated with various concentrations of FFAs in serum-free medium containing 1% FFAs-free BSA for 24 h. Cells were observed under phase contrast microscope (Olympus 1X71S8F-2, Japan). The number of lipid droplets was counted in 5 microfields and represented the average of triplicate assays.
Oil Red O staining
HepG2 cells were grown at an initial density of 105 cells/well in a 24-well plate and treated with different concentrations of FFAs for 24 h. Cells were then washed three times with iced PBS and fixed with 4% paraform for 30 minutes. After fixation, cells were washed three times and stained with Oil Red O solution (working solution, 0.5g Oil Red O powder dissolved in 60% ethanol) for 15 min at room temperature. Cells were washed again with phosphate-buffered saline (PBS) to remove unbound staining. To quantify Oil Red O content levels, dimethyl sulfoxide was added to each sample; after shaking at room temperature for 5 min, the density of samples were read at 510 nm on a spectrophotometer[8].
Nile Red staining
After treatment, the cells were washed in PBS. Cells were then fixed with 4% paraformaldehyde for 15 min and stained with Nile Red (1μg/ml) in the dark for 5 min at room temperature. Images were acquired by digitized fluorescence microscopy. For quantitative analysis, HepG2 cells were treated with different concentrations of FFAs for 24 h. Cells were harvested, washed in PBS and incubated with Nile Red (1μg/ml) in the dark for 5 min at room temperature. The fluorescence intensity of each sample was measured immediately by flow cytometry at an excitation wavelength of 488 nm and emission wavelength of 550 nm [9].
Hoechst 33342/propidium iodide (PI) staining
HepG2 cells were plated at an initial density of 105 cells/well in a 24-well plate and co-incubated with FFAs for 24 h. Cells were washed twice with PBS. After adding 5μl Hoechst 33342 staining solution, cells were stained with PI in the dark for 20-30 minutes at 4 °C and washed twice with PBS. Cells of blue and red fluorescence were examined under a fluorescence microscopy (Olympus).
Annexin V-FITC/PI staining
FFA-induced lipotoxicity in HepG2 cells was studied with Annexin V-FITC/PI staining. Cells were cultured for 24 h. Apoptotic and necrotic cells were counted by flow cytometry. Briefly, the culture medium was collected and the treated cells were digested with 0.25% pancreatic enzyme for 3 to 5 min. The digested cells were washed with the collected culture medium, and then suspended in PBS. Approximately 5-10×104 cells were incubated with the apoptosis detection kit according to the manufacturer's instructions before analysis by flow cytometry. The same steps were followed for the control cells. Cells underwent early stages apoptosis were stained only with annexin V-FITC. Other cells at late stage of apoptosis and necrotic cells were stained with both annexin V-FITC/PI [10].
Cell viability assay
HepG2 cells were plated at an initial density of 8×10³cells/well in a 96-well plate and treated with various concentrations of FFAs for 12h, 24h or 36 h . MTT solution was added to each well to a final concentration of 0.5 mg/ml. After 4 h of exposure at 37 °C, the formazan crystals were dissolved in dimethylsulfoxide (DMSO). Using an ELISA reader (TECAN Safire II, Sweden) the absorbance was measured at 570 nm.
Statistical analysis
Each experiment was repeated for at least three times and all data are expressed as the mean±SD unless otherwise indicated. One-way ANOVA was performed to compare the means between different treatments. Statistically significant differences were accepted at p < 0.05.
Results
Analysis of lipid accumulation in FFA-overloaded cells
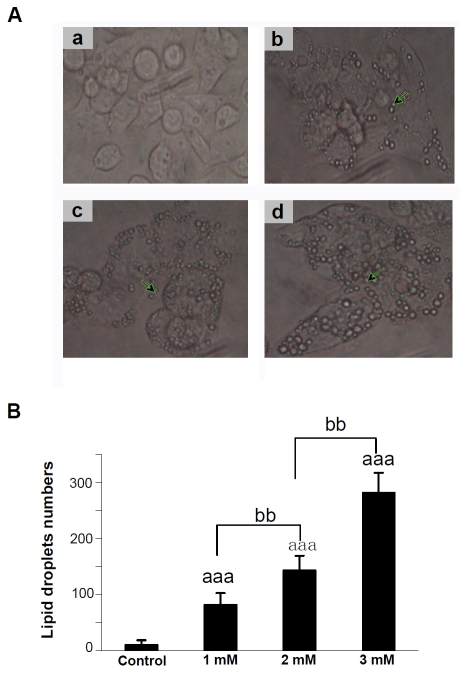
After treating cells with different concentrations of FFAs for 24h, lipid accumulation in the HepG2 cells were observed (Figure 1). The data indicated that the FFAs induced cellular lipid accumulation in a dose-dependent manner. The lipid droplets were quantified in different fields and quantitative analysis confirmed the data to be statistically significant (P<0.001) (Figure 1B). The comparison between the control group and treated groups demonstrated a significant difference (P<0.001) as well as the difference among the treated groups significant (P<0.01).
Figure 1.
Observation of lipid accumulation in HepG2 cells induced by FFAs. Representative photomicrographs (×400) of HepG2 cells, normal or treated with various concentrations of FFAs for 24 h (A). (a) Control cells; (b)Cells treated with 1mM FFAs; (c) Cells treated with 2mM FFAs; (d) Cells treated with 3mM FFAs; (B) The number of lipid droplets in cells induced by FFAs were counted at 5 microfields of 3 independent experiments. aaap < 0.001 vs control; bbp <0.01 vs. FFA-treated cells.
FFAs induced lipid accumulation in HepG2 cells
In order to observe the lipid content, cultured HepG2 cells were exposed to FFAs and the lipid accumulation levels were detected by Oil Red O staining after 24 h. As shown in Figure 2, photomicrographs indicate that the intracellular lipid content increased significantly. The total intracellular area stained with Oil Red O in the treated cultures was quantitated using a spectrophotometer at 500nm. The results have shown significant elevations of lipid content in a dose-dependent manner (Figure 2C).
Figure 2.
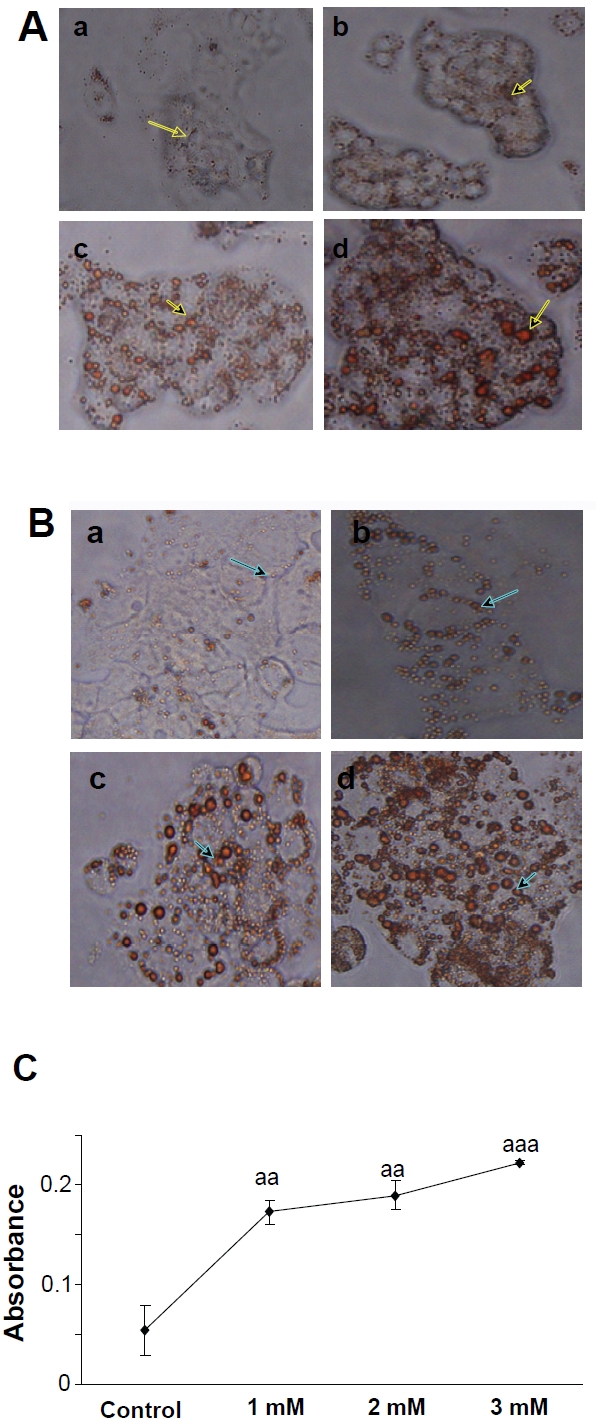
Observation of lipid accumulation in HepG2 cells by Oil-Red O staining after treating cells with various concentrations of FFAs for 24h. (A) Representative photomicrographs of HepG2 cells (×200). (a)Control cells; (b) Cells treated with 1mM FFAs; (c) Cells treated with 2mM FFAs; (d) Cells treated with 3mM FFAs; (B) Representative photomicrographs of HepG2 cells (×400). (a) Control cells; (b) Cells treated with 1mM FFAs; (c) Cells treated with 2mM FFAs; (d) Cells treated with 3mM FFAs; (C) After cells were treated for 24h,intracellular fat drops were read with spectrophotometer at 500 nm with Oil Red O staining, representing the mean ± SD of 3 independent experiments. aap < 0.01, aaap < 0.001vs control.
Fluorimetric determination of fat content in HepG2 cells
Nile Red, a stain vital for the detection of intracellular lipid droplets by fluorescence intensity was used to further confirm that FFAs could induce the formation of intracellular lipid vacuoles by fluorescence microscopy (Figure 3). Compared to control cells, the fluorescence intensity of lipid in the experimental cells was evidently higher. To quantify the cellular FFA uptake, flow cytometric assays were conducted. As indicated in Figure 3B and 3C, the difference of fluorescence intensity in FFA-treated groups compared to control was significant (p<0.01, p<0.001); among the treated groups, the difference was also significant (p<0.05), suggesting a dose-dependent increase of intracellular lipid accumulation in cells treated with FFA mixture.
Figure 3.
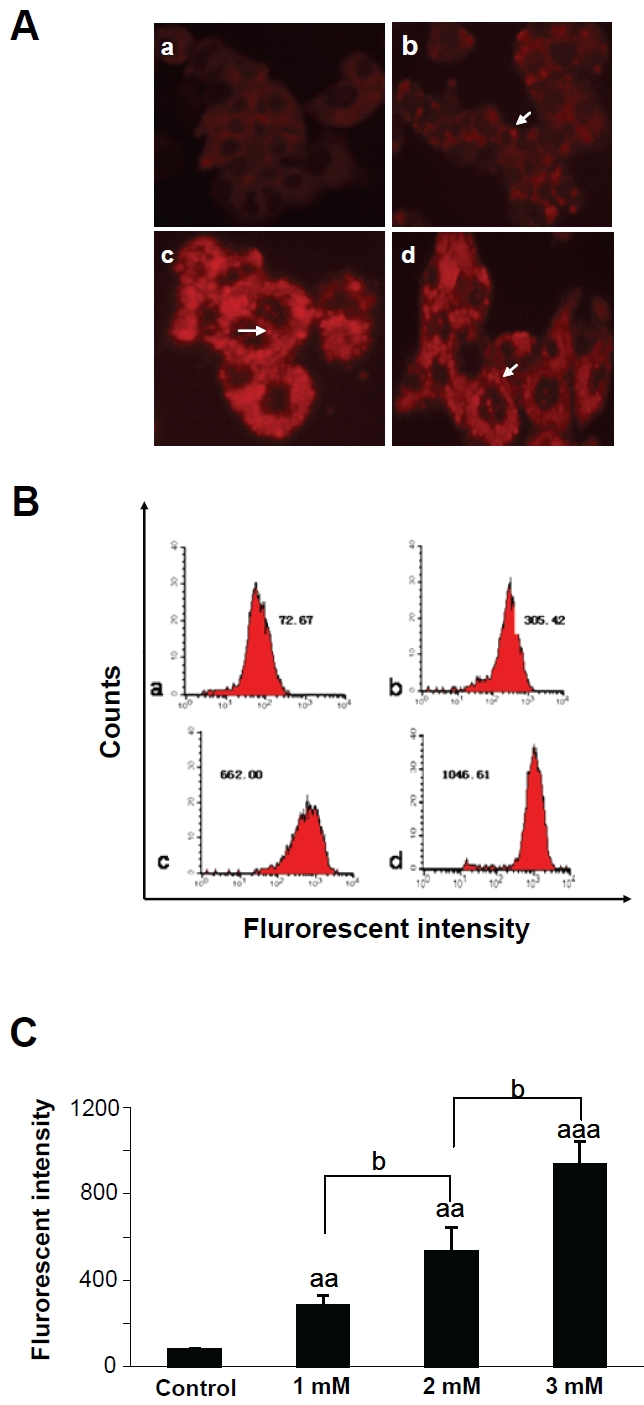
Observation of lipid accumulation in HepG2 cells by Nile Red staining after treating cells with various concentrations of FFAs for 24 h. (A) Representative photomicrographs of HepG2 cells(×400). (a) Control cells; (b) Cells treated with 1mM FFAs; (c) Cells treated with 2mM FFAs; (d) Cells treated with 3mM FFAs; (B) The flow cytometry diagram of Nile Red staining. (a)Control cells; (b) 1mM FFAs; (c) 2mM FFAs; (d) 3mM FFAs. The median geometric fluorescent intensity in each sample is indicated. (C) The column statistics graph represents the mean ± SD of 3 independent experiments. aap<0.01, aaap<0.001 vs control; bp<0.05 vs FFAs-treated cells.
Apoptotic and necrotic cell morphology observation
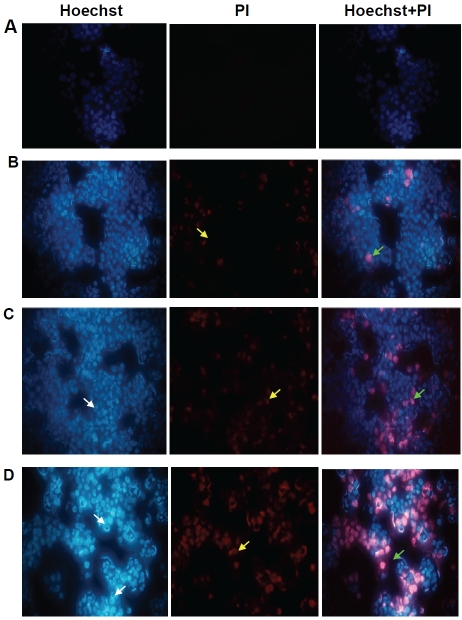
In order to investigate whether FFAs have an apoptosis inducing effect on cytotrophoblasts, Hoechest 33342 and PI double-staining tests were used to investigate the changes in cells’ nuclei. As shown in Figure 4, the fluorescence in FFA-treated cells was higher compared to control. Morphological analysis of cytotrophoblasts with fluorescence microscopy revealed a stronger blue fluorescence and a significant increase in the number of cells with nuclear condensation and fragmentation after incubation with FFAs for 24 hours. Furthermore, PI staining was higher with increasing FFA concentrations as well as an observed significant increase in the number of necrotic cells. Based on the above morphological changes, FFAs were able to cause apoptosis and necrosis in HepG2 cells in a concentration-dependent manner.
Figure 4.
Micrographs showing fluorescence of apopototic and dead cells among FFA-induced HepG2 cells by double-staining with Hoechst 33342/ Propidium (×400). Observation in the same visual field with Hoechst 33342, PI and Hoechst 33342+ PI respectively. (A) Control cells; (B) Cells treated with 1mM FFAs; (C) Cells treated with 2mM FFAs; (D) Cells treated with 3mM FFAs. White, yellow, and pink arrows indicate apoptotic cells, necrotic cells, and cells in advanced stages of apoptosis and necrosis respectively.
Apoptosis detection using annexin V-FITC/PI staining
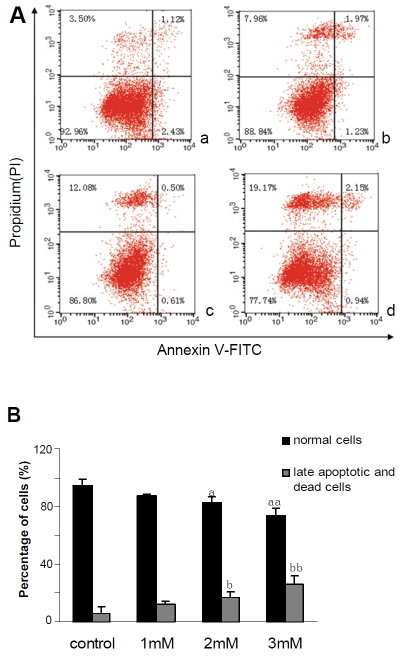
Cells undergo early apoptosis is usually characterized with phos-phatidylserine exposure at the outer leaflet of the plasma membrane. Based on their annexin V-affinity, apoptotic cells can be distinguished from annexin V-negative living cells by using cytometric procedures. Furthermore, the double labeling assay, annexin V combined with PI allows a further distinction of necrotic or late apoptotic (annexin V+/PI+) cells versus early apoptotic cells (annexin V+/PI-). When cells were treated with different concentrations, 1, 2 and 3mM of FFAs, the percentages of normal cells were reduced to (88.84±1.33)%, (86.80±3.70)% and (77.74±5.30)%, respectively. In contrast, late apoptotic and necrotic cells were increased to (12.7±1.23)%, (16.96±3.52)% and (26.34±5.31)% , respectively (Figure 5), indicating that FFA can induce apoptosis and necrosis in HepG2 cells in a dose-dependent manner causing no obvious early apoptosis.
Figure 5.
Observation of FFAs-induced apoptosis by Annexin V-FITC/PI in HepG2 cells treated with different concentrations of FFAs. (A) The flow cytometry diagram of double-staining with Annexin V-FITC/PI staining, (a) Control cells; (b) 1mM FFAs; (c) 2mM FFAs; (d) 3mM FFAs. The normal control, early apoptotic, late apoptotic, and necrotic cells were present in the lower left, lower right, upper right, and upper left quadrant, respectively. The percentage of cells in each quadrant is indicated. (B) Quantitive detection of FFAs-induced apoptosis by Annexin V-FITC/PI staining. Each value represents the mean±SD of 3 independent experiments. Comparison of the percentages of normal cells. ap < 0.05, aap < 0.01 vs. control; Comparison of the percentages of late apoptotic and necrotic cells. bp < 0.05, bbp < 0.01 vs. control.
Effect of FFAs on HepG2 cell viability
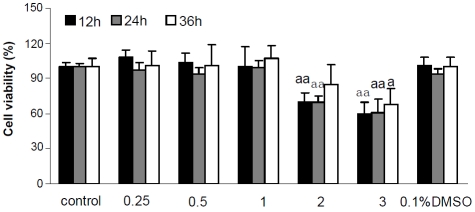
To determine whether FFAs have growth-inhibitory effects in HepG2 cells, the cells were exposed to different concentrations of FFAs (0.25,0.5,1,2 and 3mM) for different time intervals (12, 24 and 36h). Cell growth was evaluated by MTT assays. As shown in Figure 6, concentrations from 0.25 to 1mM of FFAs were not toxic to HepG2 cells after different times of exposure. The 2 mM and 3 mM FFA showed a cytotoxicity in different time intervals (Figure 6); the percentages of viable cells were 70-80%, and 60-70%, respectively. These two groups showed a significant difference compared to control group. Furthermore, HepG2 cells were more sensitive to 2mM and 3mM of FFAs after treatment for 12 and 24 h.
Figure 6.
Cytotoxicity of FFAs in HepG2 cells at a wide range of concentrations and time exposure were assessed by MTT test. aap < 0.01, aaap < 0.001 vs. control. Each value represents the mean ± SD of 3 independent experiments.
Discussion
FFAs, when added to cells may lead to a significant increase of lipid droplet accumulation in the cytoplasm. Accumulation of a high concentration of lipid droplets in cells can be toxic manifesting in apoptosis and necrosis if high enough levels are reached [11, 12]. To date, few investigations have been conducted in order to address FFA-induced lipotoxicity in HepG2 cells. Moreover, little interest has been developed showing any insight toward lipid accumulation-induced lipotoxicity in cells [13].
Morphological observation and quantitative analysis have demonstrated that intracellular lipid content increased in a dose-dependent manner after treatment of cells with different concentrations of FFAs (Figure 1). Furthermore, changes of lipid content in cells were evaluated qualitatively and quantitatively using Oil Red O staining to confirm the previous data. Compared to normal group, the contents and size of red lipid droplets inside cells of FFA-treated groups was significantly increased in a concentration-dependent manner. By Nile Red fluorescence staining, it was obvious under the microscope that higher FFAs concentrations caused an increase in red fluorescence intensity in the cytoplasm. Flow cytometry results have confirmed the previous observation; as the concentration of FFAs increased, the peak continuously shifts to the right, corresponding to the significant increase in the geometric median and fluorescence intensity (Figure 3).
Previous studies [14, 15] have shown that a concentration of 1mM FFAs causes lipotoxicity in cells but this toxicity becomes not so apparent making it more evident to observe the lipotoxicity in these cells by increasing the concentrations of FFAs [16]. Therefore, we have followed the same methodology described in previous studies to investigate the lipotoxicity caused by FFAs in HepG2 cells [17, 18]. The Hoechst 33342 and PI double staining demonstrated that apoptosis and necrosis in cells were significantly increased with the increasing FFA concentrations. Furthermore, apoptosis was not obvious in the 1mM FFA-treated groups, which is consistent with previous studies indicating that 1mM of FFAs caused lipid accumulation but not cytotoxicity. Nuclei showed some dense staining and localization in the group treated with 2 mM FFAs, indicating the appearance of apoptosis in cells. Apoptosis was more apparent in the 3mM FFA-treated groups indicating a large number of cells close to late apoptosis and necrosis (Figure 4).
MTT assays performed with different concentrations of FFAs at different time exposure intervals indicated that 1mM of FFAs had no effect on the amount of viable cells. Furthermore, Annexin V-FITC experiments demonstrated that cell viability was decreased with the increase in FFA concentration, while late apoptosis and necrosis rates were increased, early apoptosis was not apparent. Moreover, compared with the normal cell group, the treated groups of 2mM and 3mM FFAs showed significantly more apoptosis and cell death; 86-80% and 77-74%, respectively, confirming the MTT test results (Figure 5). Therefore, FFAs induced late apoptosis in HepG2 cells in a concentration-dependent manner, while early apoptosis was not obvious. Meanwhile, 1mM FFAs mainly caused lipid accumulation in HepG2 cells without apparent lipotoxicity. However, the groups treated with 2 and 3 mM FFAs significantly increased the lipotoxicity in HepG2 cells.
The above results suggest that within a certain range of concentrations, FFAs can induce the accumulation of lipids in HepG2 cells in a concentration-dependent manner. This gradual increase in FFA concentration can cause an accumulation of lipid droplets in the cytoplasm, and thus induces late apoptosis and necrosis in HepG2 cells but not necessarily early apoptosis.
Acknowledgments
This work was supported by the National Science and Technology Infrastructure Program of China (2007BAI30B00) and Mega-projects of Science Research for the 11th Five-Year Plan of China (2009ZX09302-002).
References
- 1.Mehta K, Van Thiel DH, Shah N, Mobarhan S. Nonalcoholic fatty liver disease: pathogenesis and the role of antioxidants. Nutr Rev. 2002;60:289–293. doi: 10.1301/002966402320387224. [DOI] [PubMed] [Google Scholar]
- 2.Farrell GC, Larter CZ. Nonalcoholic fatty liver disease: from steatosis to cirrhosis. Hepatology. 2006;43:S99–S112. doi: 10.1002/hep.20973. [DOI] [PubMed] [Google Scholar]
- 3.Day CP, James OF. Steatohepatitis: a tale of two “hits"? Gastroenterology. 1998;114:842–845. doi: 10.1016/s0016-5085(98)70599-2. [DOI] [PubMed] [Google Scholar]
- 4.Musso G, Gambino R, Cassader M. Recent insights into hepatic lipid metabolism in nonalcoholic fatty liver disease (NAFLD) Prog Lipid Res. 2009;48:1–26. doi: 10.1016/j.plipres.2008.08.001. [DOI] [PubMed] [Google Scholar]
- 5.Grishko V, Rachek L, Musiyenko S, Ledoux SP, Wilson GL. Involvement of mtDNA damage in free fatty acid-induced apoptosis. Free Radic Biol Med. 2005;38:755–762. doi: 10.1016/j.freeradbiomed.2004.11.023. [DOI] [PubMed] [Google Scholar]
- 6.Chiu HC, Kovacs A, Ford DA, Hsu FF, Garcia R, Herrero P, Saffitz JE, Schaffer JE. A novel mouse model of lipotoxic cardiomyopathy. J Clin Invest. 2001;107:813–822. doi: 10.1172/JCI10947. [DOI] [PMC free article] [PubMed] [Google Scholar]
- 7.Wu X, Zhang L, Gurley E, Studer E, Shang J, Wang T, Wang C, Yan M, Jiang Z, Hylemon PB, Sanyal AJ, Pandak WM, Jr, Zhou H. Prevention of free fatty acid-induced hepatic lipotoxicity by 18beta-glycyrrhetinic acid through lysosomal and mitochondrial pathways. Hepatology. 2008;47:1905–1915. doi: 10.1002/hep.22239. [DOI] [PubMed] [Google Scholar]
- 8.Lin CL, Huang HC, Lin JK. Theaflavins attenuate hepatic lipid accumulation through activating AMPK in human HepG2 cells. J Lipid Res. 2007;48:2334–2343. doi: 10.1194/jlr.M700128-JLR200. [DOI] [PubMed] [Google Scholar]
- 9.Cheng Y, Zhang J, Shang J, Zhang L. Prevention of free fatty acid-induced hepatic lipotoxicity in HepG2 cells by magnesium isoglycyrrhizinate in vitro. Pharmacology. 2009;84:183–190. doi: 10.1159/000235873. [DOI] [PubMed] [Google Scholar]
- 10.Yang L, Zhou X, Yang J, Yin X, Han L, Zhao D. Aspirin inhibits cytotoxicity of prion peptide PrP106-126 to neuronal cells associated with microglia activation in vitro. J Neuroimmunol. 2008;199:10–17. doi: 10.1016/j.jneuroim.2008.04.028. [DOI] [PubMed] [Google Scholar]
- 11.Malhi H, Bronk SF, Werneburg NW, Gores GJ. Free fatty acids induce JNK-dependent hepatocyte lipoapoptosis. J Biol Chem. 2006;281:12093–12101. doi: 10.1074/jbc.M510660200. [DOI] [PubMed] [Google Scholar]
- 12.Malhi H, Gores GJ, Lemasters JJ. Apoptosis and necrosis in the liver: a tale of two deaths? Hepatology. 2006;43:S31–44. doi: 10.1002/hep.21062. [DOI] [PubMed] [Google Scholar]
- 13.Pusl T, Wild N, Vennegeerts T, Wimmer R, Goke B, Brand S, Rust C. Free fatty acids sensitize hepatocytes to bile acid-induced apoptosis. Biochem Biophys Res Commun. 2008;371:441–445. doi: 10.1016/j.bbrc.2008.04.113. [DOI] [PubMed] [Google Scholar]
- 14.Listenberger LL, Han X, Lewis SE, Cases S, Farese RV, Jr, Ory DS, Schaffer JE. Triglyceride accumulation protects against fatty acid-induced lipotoxicity. Proc Natl Acad Sci U S A. 2003;100:3077–3082. doi: 10.1073/pnas.0630588100. [DOI] [PMC free article] [PubMed] [Google Scholar]
- 15.Eitel K, Staiger H, Brendel MD, Brandhorst D, Bretzel RG, Haring HU, Kellerer M. Different role of saturated and unsaturated fatty acids in beta-cell apoptosis. Biochem Biophys Res Commun. 2002;299:853–856. doi: 10.1016/s0006-291x(02)02752-3. [DOI] [PubMed] [Google Scholar]
- 16.Schaffer JE. Lipotoxicity: when tissues overeat. Curr Opin Lipidol. 2003;14:281–287. doi: 10.1097/00041433-200306000-00008. [DOI] [PubMed] [Google Scholar]
- 17.Wang C, Jiang Z, Yao J, Wu X, Sun L, Liu C, Duan W, Yan M, Liu J, Zhang L. Participation of cathepsin B in emodin-induced apoptosis in HK-2 Cells. Toxicol Lett. 2008;181:196–204. doi: 10.1016/j.toxlet.2008.05.013. [DOI] [PubMed] [Google Scholar]
- 18.Hwang JT, Park IJ, Shin JI, Lee YK, Lee SK, Baik HW, Ha J, Park OJ. Genistein, EGCG, and capsaicin inhibit adipocyte differentiation process via activating AMP-activated protein kinase. Biochem Biophys Res Commun. 2005;338:694–699. doi: 10.1016/j.bbrc.2005.09.195. [DOI] [PubMed] [Google Scholar]


