Abstract
Background
Genetic determinants of BP response to potassium, or potassium sensitivity, are largely unknown. We conducted a genome-wide linkage scan and positional candidate gene analysis to identify genetic determinants of potassium sensitivity.
Methods and Results
1,906 Han Chinese participants took part in a 7-day high-sodium followed by a 7-day high-sodium plus potassium dietary intervention. BP measurements were obtained at baseline and following each intervention using a random-zero sphygmomanometer. Significant linkage signals (LOD>3) for BP responses to potassium were detected at chromosomal regions 3q24-q26.1, 3q28, and 11q22.3-q24.3. Maximum multipoint LOD scores of 3.09 at 3q25.2 and 3.41 at 11q23.3 were observed for absolute DBP and MAP responses, respectively. Linkage peaks of 3.56 at 3q25.1 and 3.01 at 11q23.3 for percent DBP response and 3.22 at 3q25.2, 3.01 at 3q28, and 4.48 at 11q23.3 for percent MAP response were also identified. AGTR1 SNP rs16860760 in the 3q24-q26.1 region was significantly associated with absolute and percent systolic (SBP) responses to potassium (p-values=0.0008 and 0.0006, respectively). Absolute SBP responses (95% CI) for genotypes C/C, C/T, and T/T were: −3.71 (−4.02, −3.40), −2.62 (−3.38, −1.85), and 1.03 (−3.73, 5.79) mmHg, respectively; and percent responses (95% CI) were: −3.07 (−3.33, −2.80), −2.07 (−2.74, −1.41), and 0.90 (−3.20, 4.99), respectively. Similar trends were observed for DBP and MAP responses.
Conclusions
Genetic regions on chromosomes 3 and 11 may harbor important susceptibility loci for potassium sensitivity. Furthermore, the AGTR1 gene was a significant predictor of BP responses to potassium intake.
Clinical Trial Registration Information
http://clinicaltrials.gov; Identifier: NCT00721721
Keywords: blood pressure, potassium, genetics
Randomized clinical trials have documented that potassium supplementation reduces blood pressure (BP) among hypertensive and normotensive participants1–3. These clinical trials have also shown that BP response to potassium intake varies substantially among individuals1, 4. Furthermore, previous data from the Genetic Epidemiology Network of Sensitivity (GenSalt) Study indicated that BP response to potassium intake, known as ‘potassium sensitivity’, has a genetic component, with moderate heritability estimates for this phenotype5. Still, few studies have been conducted to examine the genetic etiology of potassium sensitivity5–7. Knowledge of the genetic mechanisms underlying BP response to potassium will not only provide a novel strategy for the primary and secondary prevention of hypertension, but may also provide further insights into the complex and multifaceted biological mechanisms underlying hypertension susceptibility.
The objective of the current study was to identify chromosomal regions harboring quantitative trait loci (QTLs) for systolic blood pressure (SBP), diastolic blood pressure (DBP), and mean arterial pressure (MAP) responses to potassium intake by conducting a genome-wide linkage scan. In addition, linkage results were followed-up by genotyping single nucleotide polymorphisms (SNPs) located in positional candidate genes and conducting association analyses to examine their relationship with BP responses to potassium intake.
METHODS
Study Population
The GenSalt study was conducted in a Han Chinese population with habitually high-sodium intake in rural areas of northern China. A community-based BP screening was conducted among persons aged 18–60 years in the study villages to identify potential probands and their families. Those with a mean SBP between 130–160 mmHg and/or a DBP between 85–100 mmHg and no use of antihypertensive medications and their parents, spouses, siblings and offspring were recruited as volunteers for the study. Detailed eligibility criteria for the probands and parents/siblings/spouses/offspring have been presented elsewhere8. Individuals who had stage-2 hypertension, secondary hypertension, clinical cardiovascular disease (CVD), chronic kidney disease, diabetes, used antihypertensive medications, or were pregnant, heavy alcohol drinkers or currently on a low-sodium diet were excluded from the study. Only probands, siblings, spouses and offspring were eligible for the dietary intervention. Of the 1,906 eligible participants, 1843 (96.7%) completed the potassium intervention.
Institutional Review Boards at all of the participating institutions approved the GenSalt study. Written informed consents for the baseline observation and for the intervention program were obtained from each participant.
Potassium Supplementation Intervention
The study participants were given a high-sodium diet (307.8 mmol of sodium per day) for 7 days. After that, they received a 60 mmol potassium-supplementation while continuing on the high-sodium diet for another 7 days. One 20 mmol potassium pill (Klor-Con M20 potassium tablets, Upsher-Smith Laboratories, Maple Grove, MN) was given during breakfast, lunch, and dinner. Total energy intake was varied according to each participant’s baseline energy intake. All study foods were cooked without salt, and pre-packaged salt was added to the individual study participant’s meal when it was served by the study staff. To ensure study participants’ compliance to the intervention program, they were required to have their breakfast, lunch and dinner at the study kitchen under supervision of the study staff during the entire study period. The study participants were instructed to avoid consuming any foods that were not provided by study personnel. Three timed urinary specimens (one 24–hour and two overnight) were collected at baseline and at the end of each phase of intervention (days 5, 6, and 7) to monitor compliance to the dietary sodium and potassium interventions among all participants. In addition, a random subsample of 238 participants collected the 24-hour specimens at baseline and each intervention phase using two separate containers, one for the overnight and one for the daytime. Regression equations of 8-hour overnight excretions on 24-hour excretions of sodium and potassium were calculated using data from the subsample for each intervention phase separately. These formulas were used to calculate the 24-hour urinary excretions of sodium and potassium based on 8-hour overnight values in all study participants. The mean of three 24-hour measures (one collected 24-hour measure and two estimated 24-hour measures) were used to estimate each participant’s average 24-hour urinary excretion for each intervention phase. The results from the 24-hour urinary excretions of sodium and potassium showed excellent compliance with the study diet: the mean (standard deviation) 24-hour urinary excretions of sodium and potassium were 242.4 (66.7) mmol and 36.9 (9.6) mmol at baseline, 244.3 (37.7) and 35.7 (7.5) during the high-sodium intervention, and 251.9 (36.9) and 77.3 (12.6) during the potassium intervention, respectively.
Phenotype Measurement
A standard questionnaire was administered by trained staff at the baseline examination to collect information on family structure, demographic characteristics, personal and family medical history, and lifestyle risk factors. Three morning BP measurements were obtained according to a standard protocol during each of the 3-days of baseline observation and on days 5, 6 and 7 of each intervention period. All BP readings were measured by trained and certified observers using a random–zero sphygmomanometer9. BP was measured with the participant in the sitting position after 5 minutes of rest. In addition, participants were advised to avoid alcohol, cigarette smoking, coffee/tea, and exercise for at least 30 minutes prior to their BP measurements. All BP observers were blinded to the participant’s dietary intervention. Body weight and height were measured twice in light indoor clothing without shoes during the baseline examination. Body mass index (BMI) was calculated as kilograms per meters squared (kg/m2).
Absolute BP response to potassium was calculated as the mean of 9 measurements on days 5, 6 and 7 during the potassium intervention minus the mean of 9 measurements during the high-sodium intervention; and percent response to potassium as the absolute response divided by the mean of 9 measurements on days 5, 6 and 7 during the high-sodium intervention multiplied by 100. The pairwise correlations of all phenotypes are displayed in Supplemental Table 1.
Microsatellite Marker Genotyping
Lymphocytic DNA samples were obtained from GenSalt family members (probands, parents, spouses, siblings, and offspring) and used for genotyping microsatellite markers spaced at approximately 9 cM intervals (359 markers, Marshfield Screening Set 12). Microsatellite genotyping used fluorescently labeled PCR primers for marker amplification followed by capillary electrophoresis on automated DNA sequencers (ABI 3730 DNA Analyzer). Quality control samples included blind duplicates, no DNA controls, and CEPH DNA standards. Genotypes were assigned using GeneMapper software (ABI). ASPEX and GRR were used to check for potential misreported relationships in the GenSalt family pedigrees10, 11. MapMaker/Sibs and PedCheck were used to check for Mendelian inconsistencies within families for each marker12, 13.
Candidate Gene and SNP Selection and Genotyping
A positional candidate gene approach was used to select genes and single nucleotide polymorphisms (SNPs) for the association analysis. A total of 912 candidate genes previously reported to be associated with BP related disorders were identified using the Human Genome Epidemiology (HuGE) Navigator and the following search terms: ‘Hypertension’, ‘Hypertension, Malignant’, ‘Hypertension, Portal’, ‘Hypertension, Pregnancy-Induced’, ‘Hypertension, Pulmonary’, ‘Hypertension, Renal’, ‘Hypertension, Renovascular’, and ‘Hypotension’14. Of these 912 genes, 11 positional candidate genes were selected for examination because they were located in chromosomal regions exhibiting LOD scores of 3 or higher in our linkage analysis. One-hundred thirty-three functional and tag SNPs providing greater than 75% coverage of common polymorphisms in positional candidate genes and their flanking regions (5,000 bp) were genotyped using oligonucleotide ligation-based SNPlex assays (Chinese National Human Genome Center, Beijing, China) and chip based hybridization assays (Affymetrix, Inc., Santa Clara, CA)15.
Data quality control revealed 20 SNPs with a minor allele frequency <0.01, 1 SNP with a low genotyping call rate (<85%), and 1 SNP that significantly deviated from Hardy-Weinberg Equilibrium [P value adjusted for correlated tests (PACT) < 0.05]. After exclusion of these 22 SNPs, a total of 111 SNPs remained (please see Supplemental Table 2).
Statistical Analysis
The mean or percent of each baseline characteristic and BP response variable was calculated for each study participant. Allele frequencies from the entire GenSalt sample were used to calculate the multipoint identity by descent estimates with Merlin software16. Multipoint quantitative trait linkage-analysis was conducted using SOLAR software17 and adjusted absolute and percent BP response phenotypes. Phenotypes were adjusted for age and room temperature during BP measurement separately within sex and field center groups. Bivariate linkage analyses were also conducted to determine whether similarly adjusted baseline BP phenotypes and the BP response phenotypes had shared genetic factors.
Additive associations between single SNPs and absolute and percent BP responses to potassium intervention were assessed using a mixed linear regression model. A sandwich estimator was used to account for the non-independence of family members. This method assumes the same degree of dependency among family members. Age, gender, BP measurement room temperature, and study site were adjusted in multivariable analyses. To adjust for multiple comparisons, an adjusted p-value using the PACT method was calculated for each SNP18. For SNPs with an adjusted p-value<0.05, we estimated the mean effect size and 95% confidence interval (CI) for each genotype using a mixed linear regression model. To assess whether significant BP response findings were independent of baseline BP levels, we added the appropriate baseline BP measure as a covariate in sensitivity analyses. These analyses were conducted using SAS (version 9.1; SAS Institute Inc) and R (version 2.8.1; http://www.r-project.org) statistical software. Finally, to determine whether significant SNPs explained some of the observed linkage in its corresponding chromosomal region, linkage analyses with phenotype adjustment for the original covariates plus any significant SNP findings were conducted.
RESULTS
The baseline characteristics of 3,142 participants, including 676 probands, 69 spouses, 1,236 parents, 956 siblings, and 205 offspring from 633 families are presented in Table 1. Average baseline SBP ranged from 107 mmHg among offspring to 137 mmHg among parents; DBP from 65 mmHg among offspring to 80 mmHg among probands; and MAP from 79 mmHg among offspring to 96 mmHg among probands. Among the 1843 participating probands, spouses, siblings and offspring, average SBP, DBP, and MAP decreased during the potassium intervention. For example, absolute SBP, DBP and MAP responses were −4.4, −1.6, and −2.5 mmHg, respectively, among study probands. All BP response phenotypes were normally distributed.
Table 1.
Characteristics and BP responses to potassium intervention among 3,142 participants from 633 families.
| Probands (n=676) |
Spouses (n=69) |
Parents (n=1,236) |
Siblings (n=956) |
Offspring (n=205) |
|
|---|---|---|---|---|---|
| Men, % | 60.4 | 33.3 | 48.6 | 51.1 | 44.4 |
| Age, years, mean (SD) | 41.0 (8.3) | 49.1 (6.7) | 67.6 (8.4) | 39.6 (7.7) | 23.5 (6.5) |
| BMI, kg/m2, mean (SD) | 24.2 (3.3) | 23.4 (3.7) | 22.8 (3.4) | 23.1 (2.8) | 21.5 (3.3) |
| Baseline BP, mm Hg, mean (SD) | |||||
| Systolic | 128.0 (11.4) | 112.6 (14.9) | 136.6 (23.9) | 111.6 (11.5) | 106.6 (10.3) |
| Diastolic | 80.3 (9.0) | 72.6 (10.0) | 75.0 (11.7) | 71.0 (8.9) | 65.3 (9.0) |
| Mean arterial pressure | 96.2 (8.5) | 85.9 (11.2) | 95.6 (14.3) | 84.5 (9.2) | 79.1 (8.7) |
| BP During high-sodium intervention, mm Hg, mean (SD) | |||||
| Systolic | 125.6 (12.4) | 111.9 (13.4) | NA | 111.8 (11.1) | 106.9 (10.1) |
| Diastolic | 78.5 (9.4) | 71.3 (9.5) | NA | 70.8 (9.1) | 64.5 (8.7) |
| Mean arterial pressure | 94.2 (9.3) | 84.9 (10.4) | NA | 84.5 (9.2) | 78.7 (8.3) |
| BP During potassium intervention, mm Hg, mean (SD) | |||||
| Systolic | 121.2 (12.5) | 107.8 (12.9) | NA | 108.7 (10.6) | 104.9 (10.3) |
| Diastolic | 77.0 (9.1) | 69.4 (9.6) | NA | 69.5 (8.5) | 63.4 (8.9) |
| Mean arterial pressure | 91.7 (9.0) | 82.2 (10.3) | NA | 82.6 (8.6) | 77.2 (8.5) |
| BP response to potassium, mm Hg, mean (SD) | |||||
| Systolic | −4.4 (5.6) | −4.0 (5.6) | NA | −3.2 (5.5) | −2.0 (4.9) |
| Diastolic | −1.6 (4.6) | −1.8 (4.0) | NA | −1.3 (4.6) | −1.2 (4.6) |
| Mean arterial pressure | −2.5 (4.4) | −2.5 (4.1) | NA | −1.9 (4.3) | −1.5 (4.0) |
| BP response to potassium, %, mean (SD) | |||||
| Systolic | −3.4 (4.3) | −3.4 (4.8) | NA | −2.7 (4.8) | −1.8 (4.5) |
| Diastolic | −1.8 (6.1) | −2.4 (5.6) | NA | −1.6 (6.5) | −1.6 (7.3) |
| Mean arterial pressure | −2.6 (4.6) | −2.9 (4.7) | NA | 2.1 (5.0) | −1.8 (5.1) |
BP=Blood pressure
BMI=Body mass index
SD=Standard deviation
NA=Not applicable; 1,236 parents did not take part in the dietary intervention and only have baseline data available.
Of the 1,906 probands, spouses, siblings, and offspring with baseline data, 1843 (96.7%) completed the dietary intervention.
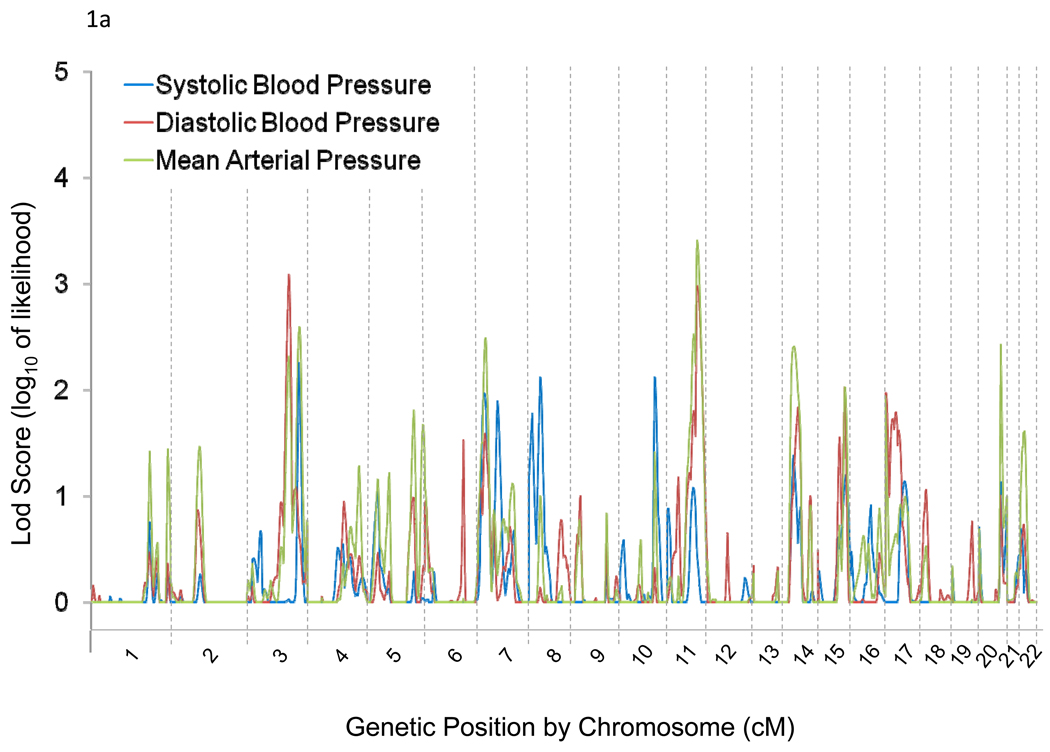
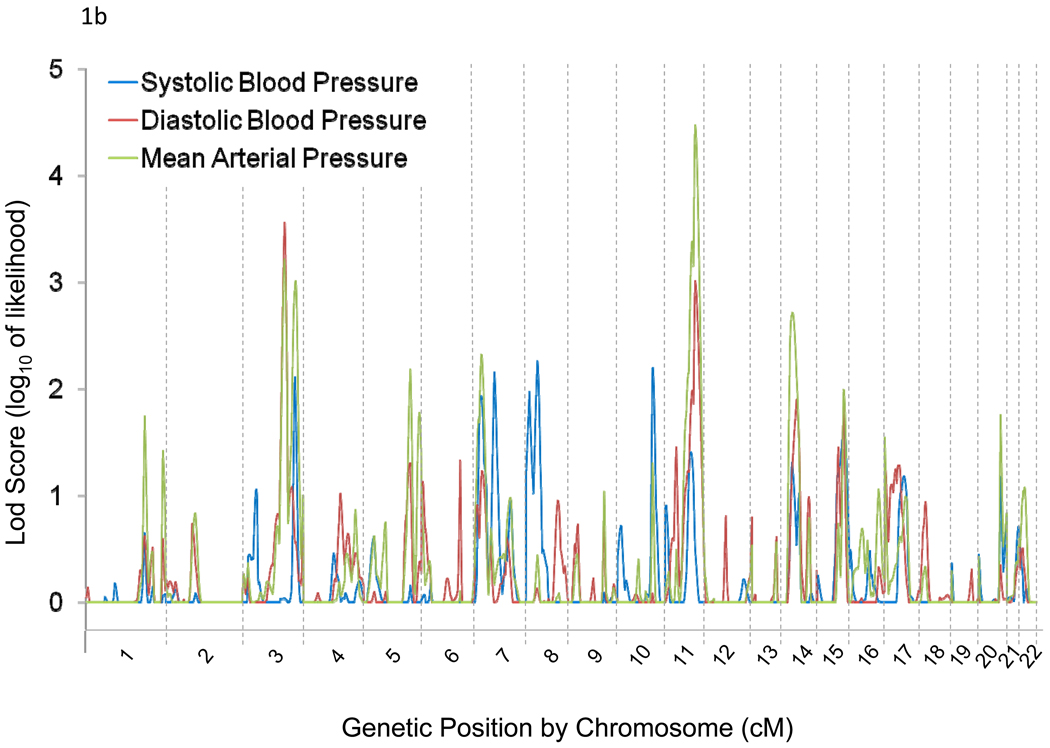
Genome-wide linkage results for absolute and percent BP responses to potassium are illustrated in Figures 1a and 1b, respectively. We observed linkage (LOD>3) of BP responses to chromosomal regions 3q24-q26.1, 3q28, and 11q22.3-q24.3. Maximum multipoint LOD scores of 3.09 at 3q25.2 and 3.41 at 11q23.3 were observed for absolute DBP and MAP responses to potassium, respectively (Table 2). Linkage peaks of 3.56 at 3q25.1 and 3.01 at 11q23.3 for percent DBP response and 3.22 at 3q25.2, 3.01 at 3q28, and 4.48 at 11q23.3 for MAP response were also identified (Table 2). Bivariate linkage analyses yielded one significant finding in the 11q22.4-q24.3 region for baseline MAP and percent MAP responses to potassium, with a maximum multipoint LOD score of 3.88.
Figure 1.
Genome-wide linkage scan results for absolute (a) and percent (b) systolic, diastolic, and mean arterial pressure responses to potassium intervention.
Table 2.
Regions harboring multipoint LOD Scores greater than 3 for any BP response to potassium supplementation.
| Chromosomal Location |
Physical Distance (Kb) |
Map Distance (cM) |
Maximum Multipoint LOD Score |
|||||
|---|---|---|---|---|---|---|---|---|
| Absolute Response |
Percent Response |
|||||||
| SBP | DBP | MAP | SBP | DBP | MAP | |||
| 3q24-q26.1 | 149,300–164,000 | 164–174 | 0.03 | 3.09 | 2.31 | 0.04 | 3.56 | 3.22 |
| 3q28 | 191,300–191,471 | 211–212 | 2.08 | 0.59 | 2.59 | 1.93 | 0.57 | 3.01 |
| 11q22.3-q24.3 | 108,000–129,300 | 102–135 | 1.08 | 2.98 | 3.41 | 1.41 | 3.01 | 4.48 |
Phenotypes are adjusted for the fixed effects of age, gender, field center, and room temperature
SBP=Systolic blood pressure
DBP=Diastolic blood pressure
MAP=Mean arterial pressure
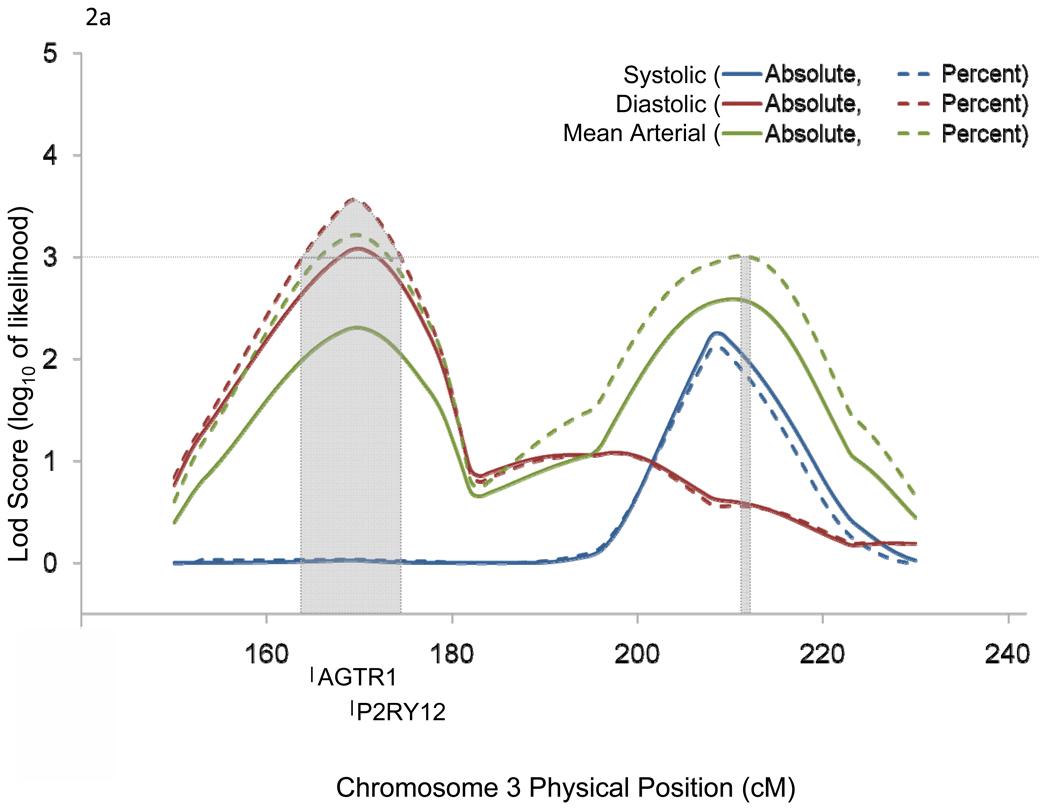
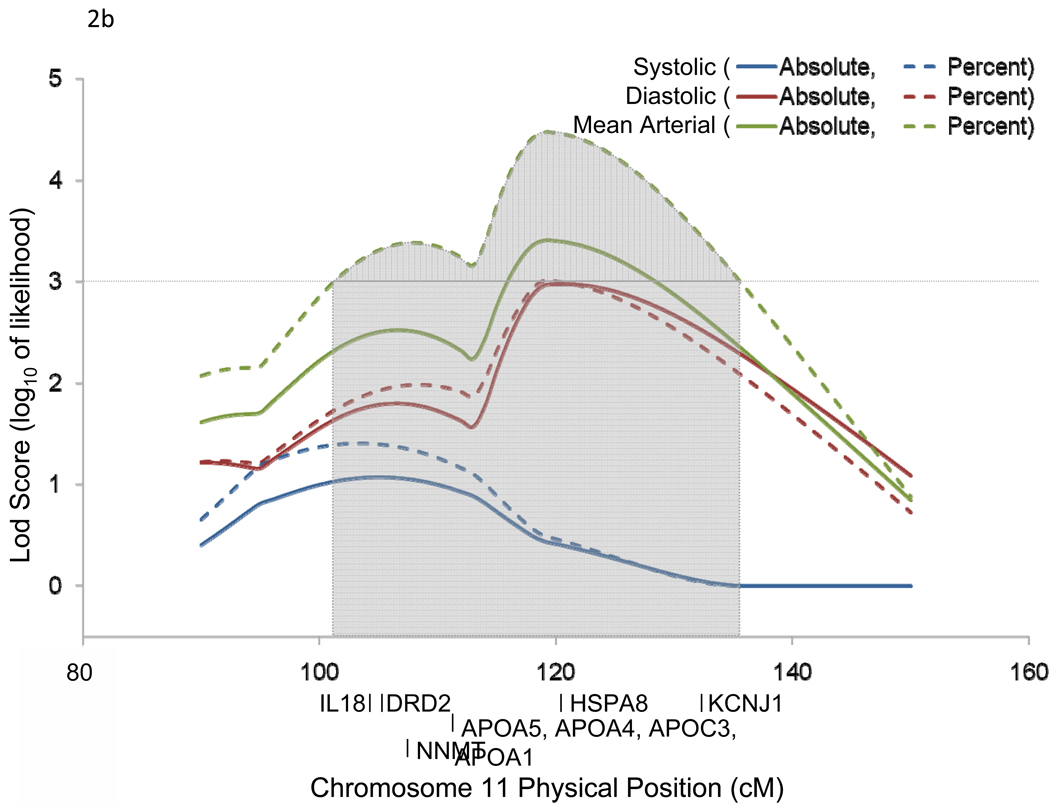
Chromosomal region 3q24-q26.1 harbored 2 candidate genes [angiotensin II receptor, type 1 (AGTR1) and purinergic receptor P2Y, G-protein coupled, 12 (P2RY12)] which have been previously implicated in BP-related disorders (Figure 2a). Similarly, 11q22.3-q24.3 harbored 9 candidate genes [interleukin 18 (IL18), dopamine receptor D2 (DRD2), nicotinamide N-methyltransferase (NNMT), apolipoprotein A-V (APOA5), apolipoprotein A-IV (APOA4), apolipoprotein C-III (APOC3), apolipoprotein A-I (APOA1), heat shock 70kDa protein 8 (HSPA8), and potassium inwardly-rectifying channel, subfamily J, member 1 (KCNJ1)] which have also been associated with BP related phenotypes in past studies (Figure 2b).
Figure 2.
Linkage regions and positional candidate genes for chromosomes 3 (a) and 11 (b).
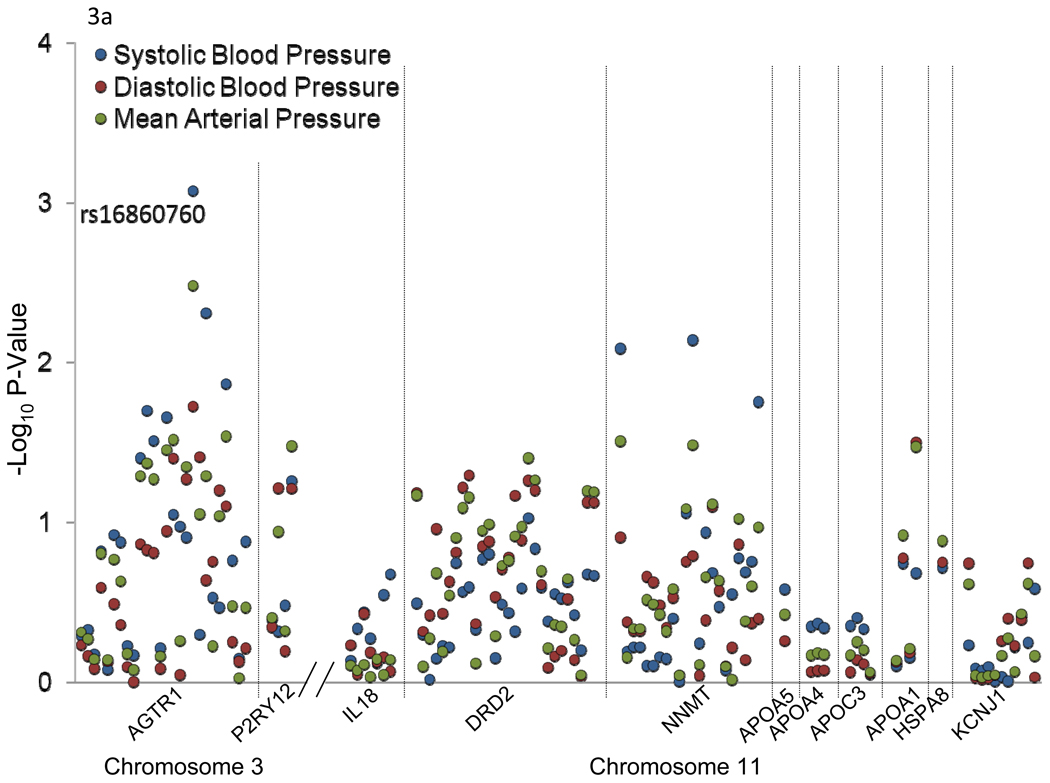
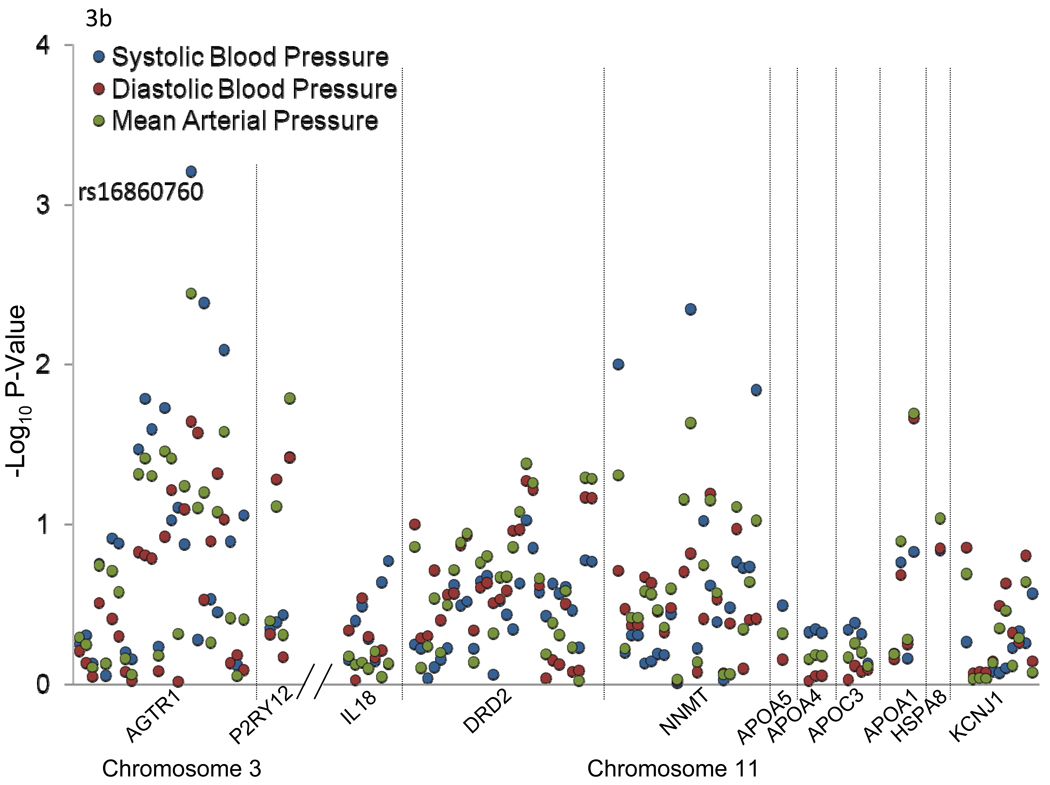
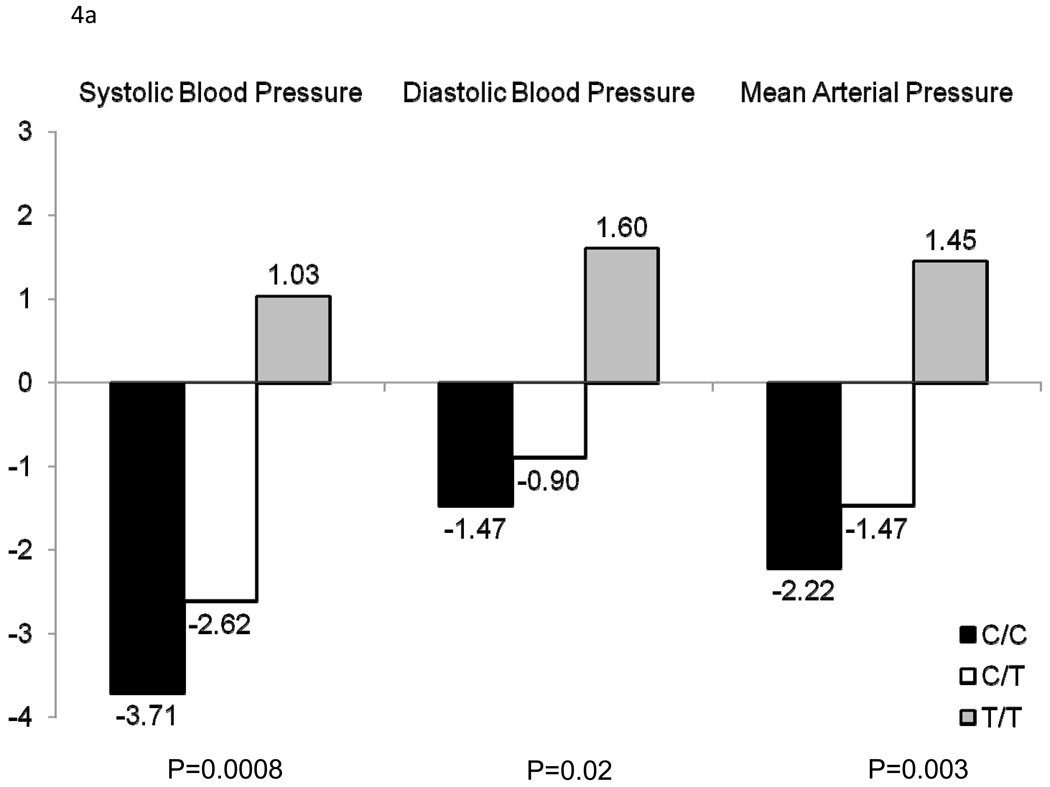
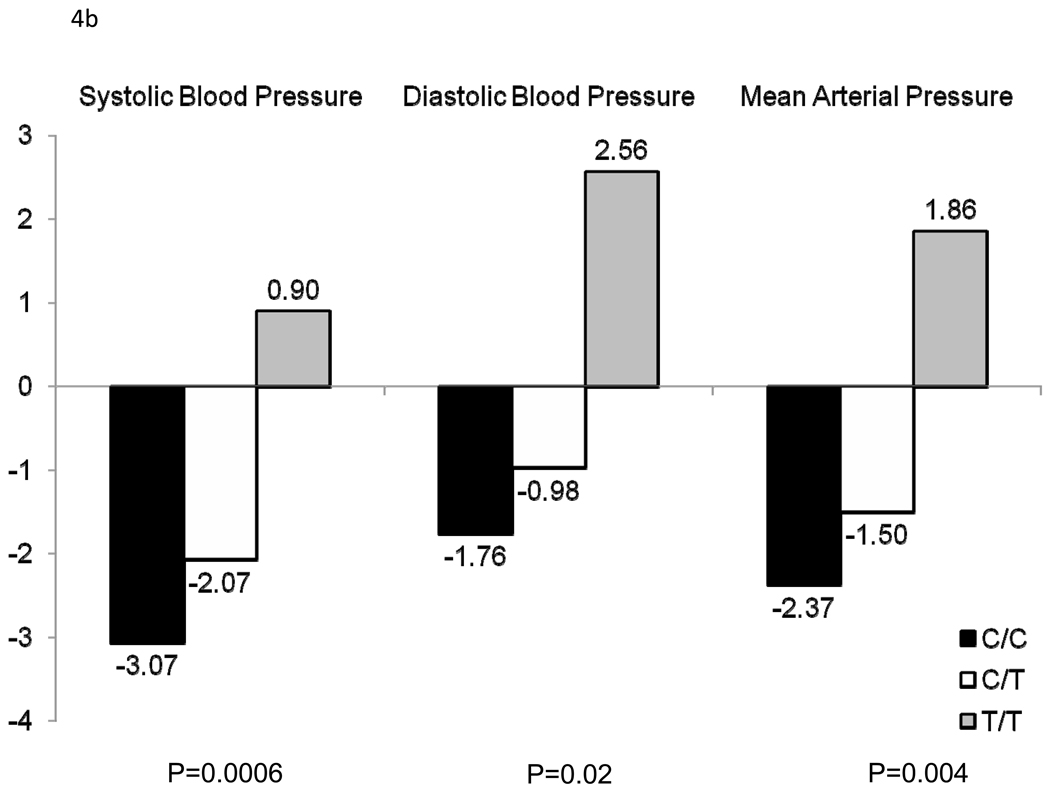
Figure 3 shows the association between 111 SNPs in the 11 positional candidate genes and absolute (a) and percent (b) SBP, DBP, and MAP responses to the potassium intervention. Only AGTR1 SNP rs16860760 (MAF=7%) was significantly associated with any of the BP responses. Absolute and percent BP responses to the potassium intervention, by rs16860760 genotypes, are shown in Figures 4a and 4b, respectively. SBP responses to potassium intervention decreased with the number of T alleles, with absolute responses (95% CI) for genotypes C/C (n=1,626), C/T (n=235), and T/T (n=13) of −3.71 (−4.02, −3.40), −2.62 (−3.38, −1.85), and 1.03 (−3.73, 5.79) mmHg, respectively (raw and adjusted p-values for linear trend=0.0008 and 0.05, respectively), and percent responses (95% CI) of −3.07 (−3.33, −2.80), −2.07 (−2.74, −1.41), and 0.90 (−3.20, 4.99), respectively (raw and adjusted p-values for linear trend=0.0006 and 0.04, respectively). A similar trend was observed for DBP responses, with absolute responses of −1.47 (−1.74, −1.20), −0.90 (−1.51, −0.28), and 1.60 (−1.40, 4.60) mmHg, respectively (raw and adjusted p-values for linear trend=0.02 and 0.64, respectively), and percent responses of −1.76 (−2.14, −1.38), −0.98 (−1.85, −0.10), and 2.56 (−1.56, 6.69), respectively (raw and adjusted p-values for linear trend=0.02 and 0.69, respectively) for genotypes C/C, C/T, and T/T; and MAP responses, with absolute responses of −2.22 (−2.48, −1.96), −1.47 (−2.07, −0.88), and 1.45 (−2.13, 5.03) mmHg, respectively (raw and adjusted p-values for linear trend=0.003 and 0.18, respectively), and percent responses of −2.37 (−2.66, −2.08), −1.50 (−2.21, −0.80), and 1.86 (−2.25, 5.96), respectively (raw and adjusted p-values for linear trend=0.004 and 0.19, respectively), for genotypes C/C, C/T, and T/T. Inclusion of the appropriate baseline BP measure as an additional covariate in sensitivity analyses for each BP response phenotype did not change these findings. Multipoint linkage analysis of chromosome 3, with an additional phenotype adjustment for rs16860760, explained some of the linkage observed at both 3q24-q26.1 and 3q28. In this analysis, only one phenotype (percent DBP response to potassium intake) achieved a significant maximum multipoint LOD score of 3.27 at 3q25.1.
Figure 3.
–Log p-values for the association between 111 SNPs in 11 candidate genes and absolute (a) and percent (b) systolic blood pressure, diastolic blood pressure, and mean arterial pressure responses to potassium intervention. Labeled SNPs had an adjusted p-value<0.05.
Figure 4.
Absolute (a) and percent (b) systolic blood pressure, diastolic blood pressure, and mean arterial pressure responses to potassium for AGTR1 rs1680760, by genotype.
DISCUSSION
The current study is the first to identify chromosomal regions harboring potentially important QTLs for potassium sensitivity. Maximum multipoint LOD scores of 3.56 at 3q25.1, 3.01 at 3q28, and 4.48 at 11q23.3 were observed for the BP response phenotypes. Furthermore, analysis of positional candidate genes revealed the AGTR1 gene as a potentially important genetic determinant of potassium sensitivity. We identified a significant and inverse dose-allele relationship between the minor T allele of AGTR1 marker rs16860760 and SBP response to potassium intake, with similar trends observed for DBP and MAP responses. In aggregate, these findings have important implications for future genetics research. The chromosomal regions localized in this study provide clues for further investigations aimed at identifying novel genes involved in potassium sensitivity. In addition, we provide early evidence of a definitive genetic mechanism underlying this complex phenotype.
While many important genetic studies of BP have been conducted19, 20, the GenSalt study is the first and only study to examine the genetic etiology of BP responses to dietary potassium intake. Because microsatellite markers were genotyped for all family members (including parents) and multipoint methods were used in the analysis, the current study had increased power to detect linkage signals. The power to detect linkage and association was further enhanced by the large number of BP measures that were collected for each participant, which should have reduced measurement error. Study attributes, including the recruitment of all Han Chinese participants, should make the association analysis robust to population stratification. The study participants were also similar with respect to lifestyle risk factors, including diet and physical activity, which minimized the confounding effects of environment on genotype-phenotype associations. The majority of participants completed the dietary intervention (96.8%), and compliance with the study interventions, as assessed by urinary excretion of sodium and potassium during each intervention period, was excellent. Finally, stringent quality control procedures were employed during measurement of BP and the other study covariates, conduct of the dietary interventions, genotyping, and marker data cleaning. Individuals with clinical cardiovascular disease, chronic kidney disease, and diabetes were excluded from current study. Therefore, our findings might not be directly generalizable to these patients.
We detected significant linkage signals for DBP and MAP responses to potassium intake at 3q24-q26.1 and 3q28. Although this is the first linkage analysis for potassium sensitivity, past linkage scans have implicated this region in relation with other BP-related phenotypes21–25. For example, Rice and colleagues found evidence of linkage to baseline BP values on 3q28 in the HERITAGE Family Study24. Furthermore, in Perola and colleagues’ genome-wide linkage scan of Finnish siblings, the strongest evidence for linkage to hypertension was found for an intragenic AC-repeat microsatellite marker in the AGTR1 gene located in the 3q21-q25 region22. In aggregate, these data provide strong evidence that important QTLs for potassium sensitivity may exist on the long arm of chromosome 3. However, replication studies examining a similar phenotype are needed.
Follow-up analysis of positional candidate genes in the 3q24-q26.1 region of chromosome 3 identified the AGTR1 gene as a potentially important genetic determinant of potassium sensitivity. AGTR1 encodes the angiotensin II, type 1 receptor, a critical component of the renin-angiotensin-aldosterone system26. Agonism of this receptor by angiotensin II increases aldosterone which acts on renal distal tubules to increase the resorption of sodium and water and the excretion of potassium, subsequently increasing BP27, 28. Polymorphisms in this gene could therefore affect physiologic responses to potassium intake. Thus, the AGTR1 gene is not only a statistically significant, but also a biologically plausible candidate for potassium sensitivity. Although the AGTR1 gene has not previously been studied in relation to potassium sensitivity, it has been associated with other BP phenotypes29–31. Findings of Bonnardeux and colleagues, as well as Zhu and colleagues showed significant associations of the AGTR1 gene with essential hypertension29, 30. Furthermore, Gu and colleagues identified several genetic variants in the AGTR1 gene that predicted BP salt-sensitivity31. In the current study, we found a significant association between the AGTR1 marker rs16860760 and SBP responses to potassium. Compared to those who were homozygous for the major C allele, T allele carriers showed reduced BP responses to potassium while homozygotes showed no significant BP responses to potassium intake. Similar trends were identified for DBP and MAP responses. Interestingly, the same AGTR1 rs16860760 variant identified in the current study was recently reported to be associated with diastolic heart failure, an important BP related condition, among a Taiwanese population of Han Chinese ethnicity32. It is unlikely that this intronic variant is causally associated with either trait. Since this SNP was not in strong LD (r2>0.8) with any of the other SNPs genotyped in the current study, further studies to identify the true causal variant are warranted. In addition, while some of the linkage findings on chromosome 3 were explained by this SNP, a significant signal was still observed for percent DBP response to potassium after adjustment for rs1680760. This data suggests that other important and still unidentified genes for potassium sensitivity may exist in this region.
Our strongest evidence of linkage to potassium sensitivity was at chromosomal region 11q22.3-q24.3 (LOD=4.48). Previous studies have linked this region to other BP-related phenotypes33, 34. For example, a genome-scan meta-analysis for hypertension found the strongest evidence of linkage at 11q22.3-q24.133. Similarly, our bivariate linkage analyses suggested that loci in this region may have pleiotropic effects on potassium sensitivity and baseline BP phenotypes. While follow-up genotyping of positional candidate genes did not reveal any significant findings, this region spans over 20,000 kilobases and may harbor important but still undiscovered susceptibility loci for potassium sensitivity. Future investigations aimed at identifying novel genes for potassium sensitivity in this chromosomal region are warranted.
The current study described genetic regions on chromosomes 3 and 11 that may harbor important susceptibility loci for potassium sensitivity. Furthermore, we identified a genetic variant in the AGTR1 gene significantly associated with BP responses to potassium intake. These findings provide early evidence that genetic mechanisms contribute to potassium sensitivity, a unique but particularly relevant phenotype. Further research aimed at identifying novel genes in the chromosomal regions described here is needed. In addition, replication of the AGTR1 locus identified in the current analysis is warranted, along with work to uncover the functional AGTR1 variant.
Current understanding of the genetic mechanisms underlying BP response to dietary potassium intake is limited. Using data from 3,142 Han Chinese participants, including 1,906 who took part in a 7-day high-sodium diet followed by a 7-day high-sodium plus potassium dietary intervention, we conducted a genome-wide linkage scan and positional candidate gene study of systolic blood pressure, diastolic blood pressure and mean arterial pressure responses to changes in dietary potassium intake. Our results identified regions on chromosomes 3 and 11 that may harbor important susceptibility loci for dietary potassium sensitivity. In addition, a novel variant in the AGTR1 gene was shown to be a strong predictor of BP response to dietary potassium. These findings provide early evidence of a definitive genetic mechanism underlying potassium sensitivity. Elucidating the genetic mechanisms that influence this complex phenotype could provide further insight into the pathophysiology of hypertension. In addition, cataloguing variants that influence this trait could potentially lead to the development of targeted dietary interventions among potassium-sensitive subgroups for the primary and the secondary prevention of hypertension.
Supplementary Material
Acknowledgments
Funding Sources: The Genetic Epidemiology Network of Salt Sensitivity is supported by research grants (U01HL072507, R01HL087263, and R01HL090682) from the National Heart, Lung, and Blood Institute, National Institutes of Health, Bethesda, MD. Dr. Kelly and the project described were supported by Award Number K12HD043451 from the Eunice Kennedy Shriver National Institute of Child Health & Human Development. The content is solely the responsibility of the authors and does not necessarily represent the official views of the Eunice Kennedy Shriver National Institute Of Child Health & Human Development or the National Institutes of Health. Upsher-Smith Laboratories, Maple Grove, MN has provided Klor-Con M20 potassium tablets for the GenSalt study.
Footnotes
Publisher's Disclaimer: This is a PDF file of an unedited manuscript that has been accepted for publication. As a service to our customers we are providing this early version of the manuscript. The manuscript will undergo copyediting, typesetting, and review of the resulting proof before it is published in its final citable form. Please note that during the production process errors may be discovered which could affect the content, and all legal disclaimers that apply to the journal pertain.
Conflict of Interest Disclosures: None.
REFERENCES
- 1.Whelton PK, He J, Cutler JA, Brancati FL, Appel LJ, Follmann D, Klag MJ. Effects of oral potassium on blood pressure. Meta-analysis of randomized controlled clinical trials. JAMA. 1997;277:1624–1632. doi: 10.1001/jama.1997.03540440058033. [DOI] [PubMed] [Google Scholar]
- 2.Khaw KT, Thom S. Randomised double-blind cross-over trial of potassium on blood-pressure in normal subjects. Lancet. 1982;2:1127–1129. doi: 10.1016/s0140-6736(82)92787-8. [DOI] [PubMed] [Google Scholar]
- 3.MacGregor GA, Smith SJ, Markandu ND, Banks RA, Sagnella GA. Moderate potassium supplementation in essential hypertension. Lancet. 1982;2:567–570. doi: 10.1016/s0140-6736(82)90657-2. [DOI] [PubMed] [Google Scholar]
- 4.He J, Gu D, Chen J, Jaquish CE, Rao DC, Hixson JE, Chen J-c, Duan X, Huang J-f, Chen C-S, Kelly TN, Bazzano LA, Whelton PK GenSalt Collaborative Research G. Gender difference in blood pressure responses to dietary sodium intervention in the GenSalt study. J Hypertens. 2009;27:48–54. doi: 10.1097/hjh.0b013e328316bb87. [DOI] [PMC free article] [PubMed] [Google Scholar]
- 5.Gu D, Rice T, Wang S, Yang W, Gu C, Chen C-S, Hixson JE, Jaquish CE, Yao Z-J, Liu D-P, Rao DC, He J. Heritability of blood pressure responses to dietary sodium and potassium intake in a Chinese population. Hypertension. 2007;50:116–122. doi: 10.1161/HYPERTENSIONAHA.107.088310. [DOI] [PMC free article] [PubMed] [Google Scholar]
- 6.Zhao Q, Gu D, Kelly T, Hixson J, Rao D, Jaquish C, Chen J, Huang J, Chen C-S, Gu C, Whelton P, He J. Genetic Variants of the Apelin-APJ System and Blood Pressure Responses to Potassium Supplement: the GenSalt Study. Am J Hypertens. 2010;23:606–613. doi: 10.1038/ajh.2010.36. [DOI] [PMC free article] [PubMed] [Google Scholar]
- 7.Montasser M, Shimmin L, Gu D, Chen J, Gu C, Kelly T, Jaquish C, Rice T, Rao D, Cao J, Chen J, Liu D, Whelton P, He J, Hixson J. Blood pressure response to potassium supplementation is associated with genetic variation in endothelin 1 (EDN1) and Interactions with E selectin (SELE) in rural Chinese. J Hypertens. 2010;28:748–755. doi: 10.1097/HJH.0b013e3283355672. [DOI] [PMC free article] [PubMed] [Google Scholar]
- 8.GenSalt: rationale, design, methods and baseline characteristics of study participants. J Hum Hypertens. 2007;21:639–646. doi: 10.1038/sj.jhh.1002207. [DOI] [PMC free article] [PubMed] [Google Scholar]
- 9.Perloff D, Grim C, Flack J, Frohlich ED, Hill M, McDonald M, Morgenstern BZ. Human blood pressure determination by sphygmomanometry. Circulation. 1993;88:2460–2470. doi: 10.1161/01.cir.88.5.2460. [DOI] [PubMed] [Google Scholar]
- 10.Abecasis GR, Cherny SS, Cookson WO, Cardon LR. GRR: graphical representation of relationship errors. Bioinformatics. 2001;17:742–743. doi: 10.1093/bioinformatics/17.8.742. [DOI] [PubMed] [Google Scholar]
- 11.Hinds D, Risch M. [Accessed December 11, 2009];The ASPEX package: affected sib-pair exclusion mapping v1.88. Available at: ftp://lahmed.stanford.edu/pub/aspex/doc/usage.html.
- 12.O'Connell JR, Weeks DE. PedCheck: a program for identification of genotype incompatibilities in linkage analysis. Am J Hum Genet. 1998;63:259–266. doi: 10.1086/301904. [DOI] [PMC free article] [PubMed] [Google Scholar]
- 13.Kruglyak L, Lander ES. Complete multipoint sib-pair analysis of qualitative and quantitative traits. Am J Hum Genet. 1995;57:439–454. [PMC free article] [PubMed] [Google Scholar]
- 14.Yu W, Clyne M, Khoury M, Gwinn M. Phenopedia and Genopedia: Disease-centered and Gene-centered Views of the Evolving Knowledge of Human Genetic Associations. [Accessed December 11, 2009];Bioinformatics. doi: 10.1093/bioinformatics/btp618. [DOI] [PMC free article] [PubMed] [Google Scholar]
- 15.Nishida N, Koike A, Tajima A, Ogasawara Y, Ishibashi Y, Uehara Y, Inoue I, Tokunaga K. Evaluating the performance of Affymetrix SNP Array 6.0 platform with 400 Japanese individuals. BMC Genomics. 2008;9:431. doi: 10.1186/1471-2164-9-431. [DOI] [PMC free article] [PubMed] [Google Scholar]
- 16.Abecasis GR, Cherny SS, Cookson WO, Cardon LR. Merlin--rapid analysis of dense genetic maps using sparse gene flow trees. Nat Genet. 2002;30:97–101. doi: 10.1038/ng786. [DOI] [PubMed] [Google Scholar]
- 17.Almasy L, Blangero J. Multipoint quantitative-trait linkage analysis in general pedigrees. Am J Hum Genet. 1998;62:1198–1211. doi: 10.1086/301844. [DOI] [PMC free article] [PubMed] [Google Scholar]
- 18.Conneely K, Boehnke M. So Many Correlated Tests, So Little Time! Rapid Adjustment of P Values for Multiple Correlated Tests. Am J Hum Genet. 2007;81:1158–1168. doi: 10.1086/522036. [DOI] [PMC free article] [PubMed] [Google Scholar]
- 19.Levy D, Ehret GB, Rice K, Verwoert GC, Launer LJ, Dehghan A, Glazer NL, Morrison AC, Johnson AD, Aspelund T, Aulchenko Y, Lumley T, Kottgen A, Vasan RS, Rivadeneira F, Eiriksdottir G, Guo X, Arking DE, Mitchell GF, Mattace-Raso FUS, Smith AV, Taylor K, Scharpf RB, Hwang S-J, Sijbrands EJG, Bis J, Harris TB, Ganesh SK, O'Donnell CJ, Hofman A, Rotter JI, Coresh J, Benjamin EJ, Uitterlinden AG, Heiss G, Fox CS, Witteman JCM, Boerwinkle E, Wang TJ, Gudnason V, Larson MG, Chakravarti A, Psaty BM, van Duijn CM. Genome-wide association study of blood pressure and hypertension. Nat Genet. 2009;41:677–687. doi: 10.1038/ng.384. [DOI] [PMC free article] [PubMed] [Google Scholar]
- 20.Newton-Cheh C, Johnson T, Gateva V, Tobin MD, Bochud M, Coin L, Najjar SS, Zhao JH, Heath SC, Eyheramendy S, Papadakis K, Voight BF, Scott LJ, Zhang F, Farrall M, Tanaka T, Wallace C, Chambers JC, Khaw K-T, Nilsson P, van der Harst P, Polidoro S, Grobbee DE, Onland-Moret NC, Bots ML, Wain LV, Elliott KS, Teumer A, Luan Ja, Lucas G, Kuusisto J, Burton PR, Hadley D, McArdle WL, Brown M, Dominiczak A, Newhouse SJ, Samani NJ, Webster J, Zeggini E, Beckmann JS, Bergmann S, Lim N, Song K, Vollenweider P, Waeber G, Waterworth DM, Yuan X, Groop L, Orho-Melander M, Allione A, Di Gregorio A, Guarrera S, Panico S, Ricceri F, Romanazzi V, Sacerdote C, Vineis P, Barroso I, Sandhu MS, Luben RN, Crawford GJ, Jousilahti P, Perola M, Boehnke M, Bonnycastle LL, Collins FS, Jackson AU, Mohlke KL, Stringham HM, Valle TT, Willer CJ, Bergman RN, Morken MA, Doring A, Gieger C, Illig T, Meitinger T, Org E, Pfeufer A, Wichmann HE, Kathiresan S, Marrugat J, O'Donnell CJ, Schwartz SM, Siscovick DS, Subirana I, Freimer NB, Hartikainen A-L, McCarthy MI, O'Reilly PF, Peltonen L, Pouta A, de Jong PE, Snieder H, van Gilst WH, Clarke R, Goel A, Hamsten A, Peden JF, Seedorf U, Syvanen A-C, Tognoni G, Lakatta EG, Sanna S, Scheet P, Schlessinger D, Scuteri A, Dorr M, Ernst F, Felix SB, Homuth G, Lorbeer R, Reffelmann T, Rettig R, Volker U, Galan P, Gut IG, Hercberg S, Lathrop GM, Zelenika D, Deloukas P, Soranzo N, Williams FM, Zhai G, Salomaa V, Laakso M, Elosua R, Forouhi NG, Volzke H, Uiterwaal CS, van der Schouw YT, Numans ME, Matullo G, Navis G, Berglund G, Bingham SA, Kooner JS, Connell JM, Bandinelli S, Ferrucci L, Watkins H, Spector TD, Tuomilehto J, Altshuler D, Strachan DP, Laan M, Meneton P, Wareham NJ, Uda M, Jarvelin M-R, Mooser V, Melander O, Loos RJF, Elliott P, Abecasis GR, Caulfield M, Munroe PB. Genome-wide association study identifies eight loci associated with blood pressure. Nat Genet. 2009;41:666–676. doi: 10.1038/ng.361. [DOI] [PMC free article] [PubMed] [Google Scholar]
- 21.Hamet P, Merlo E, Seda O, Broeckel U, Tremblay J, Kaldunski M, Gaudet D, Bouchard G, Deslauriers B, Gagnon F, Antoniol G, Pausova Z, Labuda M, Jomphe M, Gossard F, Tremblay G, Kirova R, Tonellato P, Orlov SN, Pintos J, Platko J, Hudson TJ, Rioux JD, Kotchen TA, Cowley AW., Jr Quantitative founder-effect analysis of French Canadian families identifies specific loci contributing to metabolic phenotypes of hypertension. Am J Hum Genet. 2005;76:815–832. doi: 10.1086/430133. [DOI] [PMC free article] [PubMed] [Google Scholar]
- 22.Perola M, Kainulainen K, Pajukanta P, Terwilliger JD, Hiekkalinna T, Ellonen P, Kaprio J, Koskenvuo M, Kontula K, Peltonen L. Genome-wide scan of predisposing loci for increased diastolic blood pressure in Finnish siblings. J Hypertens. 2000;18:1579–1585. doi: 10.1097/00004872-200018110-00008. [DOI] [PubMed] [Google Scholar]
- 23.Nagy Z, Busjahn A, Bahring S, Faulhaber HD, Gohlke HR, Knoblauch H, Rosenthal M, Muller-Myhsok B, Schuster H, Luft FC. Quantitative trait loci for blood pressure exist near the IGF-1, the Liddle syndrome, the angiotensin II-receptor gene and the renin loci in man. J Am Soc Nephrol. 1999;10:1709–1716. doi: 10.1681/ASN.V1081709. [DOI] [PubMed] [Google Scholar]
- 24.Rice T, Rankinen T, Chagnon YC, Province MA, Perusse L, Leon AS, Skinner JS, Wilmore JH, Bouchard C, Rao DC. Genomewide linkage scan of resting blood pressure: HERITAGE Family Study. Health, Risk Factors, Exercise Training, and Genetics. Hypertension. 2002;39:1037–1043. doi: 10.1161/01.hyp.0000018911.46067.6e. [DOI] [PubMed] [Google Scholar]
- 25.Rice T, Rankinen T, Province MA, Chagnon YC, Perusse L, Borecki IB, Bouchard C, Rao DC. Genome-wide linkage analysis of systolic and diastolic blood pressure: the Quebec Family Study. Circulation. 2000;102:1956–1963. doi: 10.1161/01.cir.102.16.1956. [DOI] [PubMed] [Google Scholar]
- 26.Erdmann J, Riedel K, Rohde K, Folgmann I, Wienker T, Fleck E, Regitz-Zagrosek V. Characterization of polymorphisms in the promoter of the human angiotensin II subtype 1 (AT1) receptor gene. Ann Hum Genet. 1999;63:369–374. doi: 10.1046/j.1469-1809.1999.6340369.x. [DOI] [PubMed] [Google Scholar]
- 27.White PC. Disorders of aldosterone biosynthesis and action. N Engl J Med. 1994;331:250–258. doi: 10.1056/NEJM199407283310408. [DOI] [PubMed] [Google Scholar]
- 28.Jones A, Dhamrait SS, Payne JR, Hawe E, Li P, Toor IS, Luong L, Wootton PTE, Miller GJ, Humphries SE, Montgomery HE. Genetic variants of angiotensin II receptors and cardiovascular risk in hypertension. Hypertension. 2003;42:500–506. doi: 10.1161/01.HYP.0000088853.27673.D0. [DOI] [PubMed] [Google Scholar]
- 29.Bonnardeaux A, Davies E, Jeunemaitre X, Fery I, Charru A, Clauser E, Tiret L, Cambien F, Corvol P, Soubrier F. Angiotensin II type 1 receptor gene polymorphisms in human essential hypertension. Hypertension. 1994;24:63–69. doi: 10.1161/01.hyp.24.1.63. [DOI] [PubMed] [Google Scholar]
- 30.Zhu X, Chang Y-PC, Yan D, Weder A, Cooper R, Luke A, Kan D, Chakravarti A. Associations between hypertension and genes in the renin-angiotensin system. Hypertension. 2003;41:1027–1034. doi: 10.1161/01.HYP.0000068681.69874.CB. [DOI] [PubMed] [Google Scholar]
- 31.Gu D, Kelly TN, Hixson JE, Chen J, Liu D-P, Chen J-c, Rao DC, Mu J, Ma J, Jaquish CE, Rice TK, Gu CC, Hamm LL, Whelton PK, He J. Genetic Variants in the Renin-Angiotensin-Aldosterone System and Salt-Sensitivity of Blood Pressure. J Hypertens. 2010;28:1210–1220. [PMC free article] [PubMed] [Google Scholar]
- 32.Wu C-K, Tsai C-T, Chang Y-C, Luo J-L, Wang Y-C, Hwang J-J, Lin J-L, Tseng C-D, Chiang F-T. Genetic polymorphisms of the angiotensin II type 1 receptor gene and diastolic heart failure. J Hypertens. 2009;27:502–507. doi: 10.1097/hjh.0b013e32831fda3a. [DOI] [PubMed] [Google Scholar]
- 33.Liu W, Zhao W, Chase GA. Genome scan meta-analysis for hypertension. Am J Hypertens. 2004;17:1100–1106. doi: 10.1016/j.amjhyper.2004.07.014. [DOI] [PubMed] [Google Scholar]
- 34.Sharma P, Fatibene J, Ferraro F, Jia H, Monteith S, Brown C, Clayton D, O'Shaughnessy K, Brown MJ. A genome-wide search for susceptibility loci to human essential hypertension. Hypertension. 2000;35:1291–1296. doi: 10.1161/01.hyp.35.6.1291. [DOI] [PubMed] [Google Scholar]
Associated Data
This section collects any data citations, data availability statements, or supplementary materials included in this article.


