

Abstract
KCC2 is a neuron-specific K+-Cl− cotransporter that maintains a low intracellular Cl− concentration essential for hyperpolarizing inhibition mediated by GABAA receptors. Deficits in KCC2 activity occur in disease states associated with pathophysiological glutamate release. However, the mechanisms by which elevated glutamate levels alter KCC2 function are unknown. The phosphorylation of KCC2 residue S940 is known to regulate its surface activity. Here we demonstrated in dissociated rat neurons that NMDA receptor activity and Ca2+ influx caused the dephosphorylation of S940 leading to a loss of KCC2 function that lasted greater than 20 minutes. PP1 mediated the dephosphorylation events of S940 that coincided with a deficit in hyperpolarizing GABAergic inhibition due to the loss of KCC2 activity. Blocking dephosphorylation of S940 reduced the glutamate-induced downregulation of KCC2 and significantly improved the maintenance of hyperpolarizing GABAergic inhibition. Reducing the downregulation of KCC2 thus has therapeutic potential in the treatment of neurological disorders.
Introduction
The neuron-specific K+-Cl− cotransporter KCC2 constitutes the main extruder of Cl− in mature neurons. Maintenance of a low intracellular Cl− concentration is required for hyperpolarizing phasic and tonic inhibitory transmission mediated by Cl−-permeable γ-aminobutyric acid type A (GABAA) and glycine receptors1,2. Without KCC2 GABAergic and glycinergic signaling is limited to inhibitory shunting of membrane conductance or conversely to increased membrane excitability. Indeed, the early postnatal lethality of KCC2 knock-out mice highlights the critical role of KCC2 in neuronal function3.
The establishment of hyperpolarizing transmission follows the postnatal expression pattern of KCC22,4,5. In the adult CNS depolarizing GABAA-mediated responses are observed primarily in pathophysiological conditions6,7. A reduction of KCC2 expression and altered Cl− homeostasis occurs in several models of neuropathic pain8,9,10–12 and ischemic brain injury13,14,15. Consistent with these observations, GABAA receptor agonists and positive allosteric modulators are initially neuroprotective but rapidly lose efficacy after ischemic injury16,17, whereas delayed administration of a negative allosteric modulator improve motor deficits after stroke in mice18. KCC2 function is also decreased by seizures in animals19,20,21. Specific neurons in the subiculum of human epileptic brain tissue exhibit depolarizing GABA responses22, which is attributable to decreased KCC2 expression23. The loss of KCC2 function could underlie the lack of therapeutic efficacy of common antiepileptic drugs in the treatment of temporal lobe epilepsy24,25.
Mounting evidence indicates that phosphorylation of KCC2 dynamically regulates its activity and surface expression. Wnk3 kinase phosphorylation reduces KCC2 activity and causes a deficit in cell volume regulation26, and Wnk1 kinase phosphorylation decreases cell surface stability27. Inhibition of tyrosine kinase activity also decreases KCC2 activity and disrupts surface clustering28. Tyrosine phosphorylation is correlated with decreased KCC2 activity and expression in models of oxidative stress and hyperexcitability29. We recently reported that tyrosine phosphorylation by Src-family kinase promotes lysozomal degradation of KCC2 in an epilepsy model30. Our previous experiments also indicate that KCC2 is directly phosphorylated by Ca2+/phospholipid-dependent protein kinase C (PKC) at residue serine 940 (S940) in the C-terminal intracellular domain, leading to enhanced KCC2 activity and reduced endocytosis31. However, the role of S940 phosphorylation in pathophysiological states is unknown.
Given the role of KCC2 in health and disease, understanding the cellular mechanisms that control its functional expression is of particular importance. Intrahippocampal microdialysis measurements reveal a sharp increase in ambient glutamate levels prior to and during seizures in conscious humans presenting with complex partial seizures32, and glutamate causes a depolarizing shift in the reversal potential of GABA-activated currents (EGABA) by unknown mechanisms33. We hypothesized that pathophysiological levels of extracellular glutamate causes dephosphorylation of S940, leading to downregulation of KCC2 and altered GABAergic responses. Our experiments indicated that NMDA receptor activation and Ca2+ influx induced rapid PP1-dependent dephosphorylation of S940 and downregulation of KCC2. This process was ameliorated by the phosphatase inhibitor okadaic acid (OKA). Dephosphorylation of S940 and its subsequent degradation thus underlie the reduced KCC2 functional expression observed in pathophysiological states associated with elevated levels of glutamate.
Results
GABA depolarizes neurons after glutamate exposure
The neurotransmitter GABA adopts its canonical role as an inhibitor of neuronal excitability upon up-regulation of KCC2 in mature neurons5. KCC2 maintains a low intracellular concentration of Cl− and sets EGABA below the resting membrane potential (EM), thereby enabling a GABAA-mediated Cl− influx that hyperpolarizes the membrane potential. We therefore used the gramicidin perforated patch-clamp technique to preserve the endogenous intracellular Cl− concentration. We began each experiment by establishing that neurons could sustain a hyperpolarizing response to repeated exposures of exogenous GABA. In our experiments on DIV14–21 day dissociated hippocampal neurons, approximately 25% of neurons exhibited depolarizing GABA responses at the beginning of the experiments and were discarded (see Methods for rationale). In voltage follower (I=0) recording mode, GABA application hyperpolarized the membrane potential, indicating that EGABA is less than EM, which we attributed to functional expression of KCC2 (Fig. 1a). Indeed, application of the loop diuretic furosemide dissipated the hyperpolarizing responses to GABA until they became purely shunting, i.e. furosemide positively shifted EGABA to values equal to EM (Fig. 1b). In agreement with our results, furosemide application to rodent brain slices shifts EGABA to more positive values34,35. The dissipation of the ionic gradient varied greatly in time (9 ± 5 min, n = 4) and depended on both the furosemide inhibition of KCC2 function and the concurrent GABAA-mediated Cl− loading. In sharp contrast, the neurons quickly, and with far less variability (4 ± 1 min), reestablished a sustained hyperpolarizing GABA response after washout of furosemide (Fig. 1c).
Figure 1.
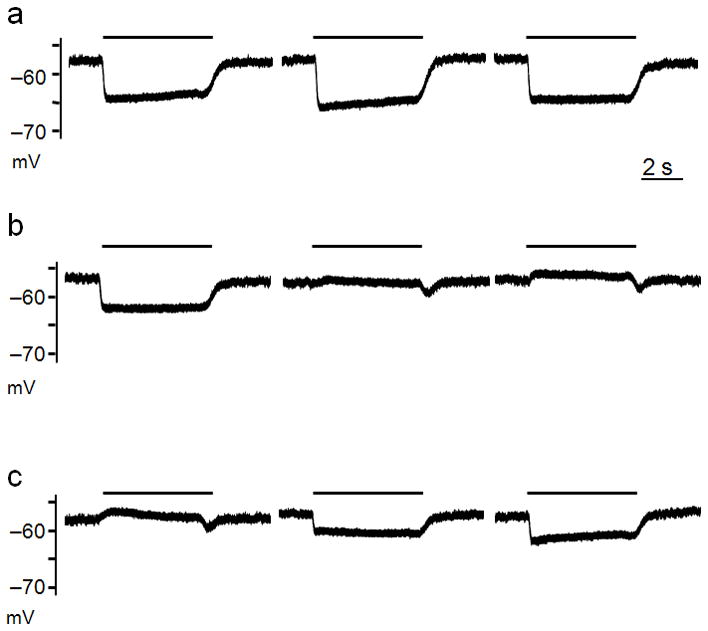
The furosemide-sensitive K+/Cl− pump KCC2 generates hyperpolarizing GABA-activated currents. Recordings of exogenous GABA (10 μM) application were obtained in I=0 recording mode (A–C). A, Consecutive pulses of GABA (5 s, black bars) spaced 1 min apart. B, Exposing neurons to furosemide (100 μM) abolished the hyperpolarizing effects of GABA application within minutes. The traces shown were not consecutive pulses (see text). C, Hyperpolarizing GABA-activated potentials were quickly reestablished after washout of furosemide. Traces shown are from consecutive GABA pulses spaced at 1 min intervals. All data were obtained in the presence of DNQX, AP5, and TTX.
In a separate set of recordings performed in the presence of the ionotropic glutamate receptor antagonists AP5 and DNQX, neurons exhibited sustained hyperpolarizing responses to exogenous GABA and bicuculline-sensitive spontaneous inhibitory postsynaptic potentials (sIPSP’s) (Fig. 2a). We then applied glutamate alone for 2 min to simulate the increased glutamate levels observed prior to and during epileptic events in human hippocampus32 (Fig. 2b). The glutamate application initially triggered a barrage of action potentials (APs) before causing a sustained depolarizing block. At the end of the glutamate application neurons were rapidly exposed to AP5 and DNQX to allow recovery of initial EM values. Every neuron tested (n = 8) exhibited spontaneous excitatory postsynaptic potentials (sEPSP’s) and fired APs that were completely blocked by bicuculline, indicating that EGABA was now greater than EM and that these APs were not due to generalized hyperexcitability caused by an increased Na+ conductance or elevated extracellular K+ 36 (Fig. 2c). Neurons fired 20 ± 11 APs during the first minute, and this activity dramatically increased within the second minute to 42 ± 10 spikes, before slowly decreasing and falling silent after 8 minutes (Fig. 2d). The slow repolarization of the membrane potential and the concurrent voltage-dependent de-inactivation process of the NaV channels that mediate APs were the likeliest causes of the initial increase in AP firing rate.
Figure 2.
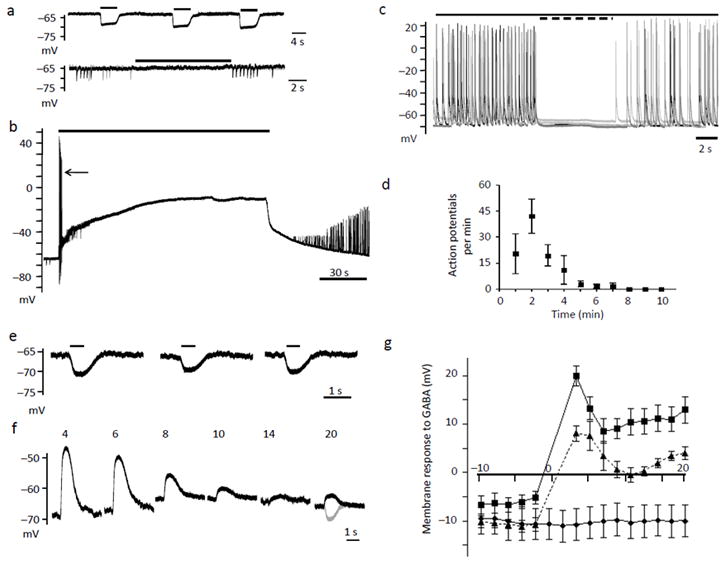
Glutamate application switches GABA transmission to depolarizing and excitatory. A-top, Consecutive pulses of GABA (10 μM-black bars) spaced 1 min apart. A-bottom, Neurons exhibited sIPSP’s that were blocked by bicuculline (50 μM-black bar). Consecutive traces are overlaid in black and gray. B, Glutamate (20 μM) application for 2 min caused a sustained depolarization. Arrow indicates the barrage of action potentials (APs) fired before the depolarizing block. C, Four consecutive overlaid traces obtained 1 min after the end of the glutamate pulse. Solid bar indicates the presence of DNQX and AP5, the dotted bar indicates the addition of bicuculline. D, Quantification of the average number of APs during each 1 min epoch after the glutamate pulse. E, Consecutive 500 ms GABA pulses (black bars) obtained at 2 min intervals. F, After a 2 min glutamate pulse and a 2 min recovery period, GABA was applied every 2 min. Numbers above each trace indicate the time elapsed from the beginning of the glutamate application. For comparison, the last pulse of GABA (gray) from panel (E) prior to glutamate application is superimposed onto the 20th min GABA pulse (black) obtained after glutamate exposure. G, The graph represents the time course of the shift in GABA responses before and after glutamate. Time 0 represents the beginning of the glutamate pulse. Glutamate was applied in the absence (squares) or presence of bicuculline (triangles). DMSO (0.1 %, diamonds) was applied alone as a control. Error bars represent the mean ± SEM.
Glutamate application causes a sustained depolarization of EGABA33. However, using voltage-ramp protocols to determine EGABA can either load or drain the neuron of Cl− depending on the direction (positive or negative) of the ramp procedure. To circumvent these possible artifacts, we performed a series of experiments only in I=0 mode and examined the period of time that neurons maintained a depolarizing GABA response after exposure to glutamate. We performed these experiments in the presence of AP5, DNQX, and TTX to minimize Cl− flux by endogenous GABAergic phasic signaling. We first established that neurons exhibited a sustained hyperpolarizing response to exogenous GABA prior to the 2 min glutamate pulse (Fig. 2e). We then waited 2 min to allow neurons to establish EM values within ± 5 mV of their initial value, and then applied GABA every 2 min over a 20 min period (Fig. 2f). In agreement with our measurements of APs, neurons exhibited their strongest depolarizing responses to GABA within the first 4 min after the glutamate application was terminated (Fig. 2g). Depolarizing GABA responses lasted for at least 20 min after the beginning of the glutamate pulse, indicating that neurons lost their ability to extrude Cl− beyond equilibrium concentrations for a prolonged period. Our data also suggested that the polarity shift and Cl− loading must have taken place during the relatively brief glutamate pulse. We tested if GABAA receptors were responsible for the Cl− influx by co-applying glutamate with the GABAA antagonist bicuculline because a surge in GABA concentration occurs during seizures32. Indeed, bicuculline significantly reduced the amplitude of the depolarizing GABA responses after glutamate exposure (Fig. 2g). However, bicuculline neither protected the Cl− extruding mechanism nor abolished the depolarizing responses, indicating that there are multiple sources of Cl− influx during the glutamate pulse.
Glutamate induced a positive shift in EGABA
We performed a series of experiments in both I=0 and voltage-clamp modes to quantify the effects of glutamate on EGABA values. We first established that neurons exhibited sustained hyperpolarizing GABA responses and then performed steady-state current-voltage (I–V) relationships to estimate EGABA (Fig. 3a,b). We constructed I–V plots and used linear regression analysis to extrapolate EGABA, which ranged between −60 and −96 mV, with an average EGABA of −79 ± 2 mV (n = 22; Fig. 3c). These neurons had an average EM of −65 ± 2 mV, with values ranging between −50 and −77 mV, which yields an average driving force value on GABA-activated currents (DFGABA = EGABA − EM) of −14 ± 3 mV, indicating these neurons possessed a dominant Cl− extruding mechanism (Supplementary Fig. 1a).
Figure 3.
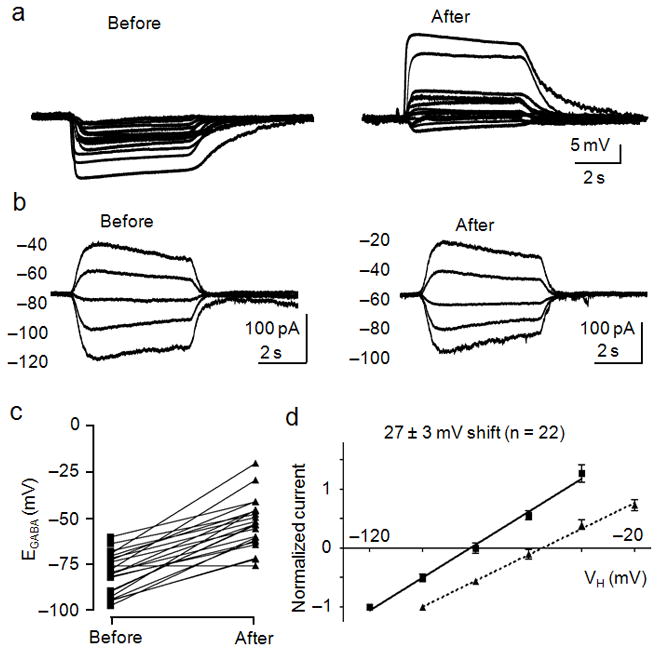
Glutamate shifts EGABA to more depolarized potentials. A, Recordings of the membrane potential responses to GABA (10 μM) were obtained before (left) and 10 min after (right) application of glutamate (20 μM). B, I–V relationships of GABA-activated currents recorded before (left) and after (right) exposure to glutamate. Currents were recorded at the indicated holding potentials shown to the left of each trace. C, Dot plot of the extrapolated EGABA values obtained before and after glutamate treatment. Lines connect the EGABA values obtained for each cell. D, I–V plot of normalized GABA-activated currents obtained before (squares, solid line) and after (triangles, dashed line) glutamate treatment. The calculated shift in EGABA caused by glutamate is displayed above the linear fits to the data points. Error bars represent the mean ± SEM. All of these data were pooled from interleaved glutamate/control experiments performed in parallel with each glutamate/experimental condition.
On the same set of neurons, we then applied glutamate alone for 2 min and allowed the neurons to recover for 8 min before assessing changes in GABA responses. Membrane potential measurements revealed that GABA application caused a sustained depolarizing response in 16 of 22 cells tested, indicating EGABA shifted to values greater than EM, and in 4 of 22 neurons the membrane response was purely shunting (Fig. 3a). However, 2 of 22 neurons retained KCC2 function and hyperpolarizing GABA responses. Further analysis revealed that glutamate application significantly increased the extrapolated EGABA values by 27 ± 3 mV to −52 ± 3 mV (p < 0.001, paired t-test, Supplementary Fig. 1b), and caused a prominent rightward shift in the average I–V relationship (Fig. 3d). After the glutamate application the neurons exhibited EM values ranging between −51 and −82 mV, with an average of −63 ± 2 mV, yielding an average DFGABA value of 10 ± 3 mV (Supplementary Fig. 1a).
Glutamate altered the phosphorylation of KCC2 residue S940
It is emerging that membrane trafficking and activity of KCC2 is subject to regulation by phosphorylation26,27,28–31. We focused on changes in the phosphorylation of S940 because PKC-dependent phosphorylation of this residue both enhances KCC2 activity and increases cell surface stability by reducing endocytosis31. We raised a phospho-antibody against a synthetic peptide containing S940 to specifically analyze its phosphorylation. We first characterized the specificity of phospho-S940 (pS940) using recombinant KCC2 expressed in HEK-293 cells. Activation of PKC by the phorbol ester PDBu significantly increased pS940 immunoreactivity in cells transfected with wild type KCC2, whereas no signal was detected in cells expressing a KCC2 construct in which S940 was mutated to alanine (Supplementary Fig. 2a). We then used a His-tagged fusion protein of the C-terminal intracellular domain of KCC2 (His-C) that is phosphorylated in vitro by PKC at residue S94031. PS940 recognized the phosphorylated form of His-C but not the dephosphorylated form (Supplementary Fig. 2b). PDBu increased the phosphorylation of cell surface KCC2 in biotinylation assays performed on hippocampal neurons and this effect was blocked by the PKC inhibitor calphostin C (Supplementary Fig. 2b,c). Finally, preadsorption with the phosphorylated but not dephosphorylated antigen or pretreatment of the membrane with λ-phosphatase abolished pS940 immunoreactivity (Supplementary Fig. 2d). These results indicated that pS940 detects KCC2 only when phosphorylated on S940.
Subsequent analyses revealed that dephosphorylation of S940 occurred rapidly after glutamate treatment. PS940 immunoreactivity and total KCC2 protein were significantly reduced to 48 ± 10 % and 58 ± 9 % of control values (p < 0.01, n = 3) 15 min after glutamate application, respectively (Fig. 4a and Supplementary Fig. 3). We also calculated the ratio of signal for pS940/KCC2, which indicated the reduced pS940 immunoreactivity is due to dephosphorylation, and not only by degradation of total KCC2. We then examined changes in surface expression since phosphorylation of S940 slows the rate of endocytosis31. Biotinylation assays revealed that glutamate reduced the level of cell surface KCC2 to 42 ± 6 % of control values (Fig. 4b). Although this dramatic reduction in surface KCC2 explains the loss of hyperpolarizing GABA responses, the remaining population of surface KCC2 was most likely responsible for the progressive decrease in the amplitudes of the depolarizing GABA responses (Fig. 2f,g).
Figure 4.
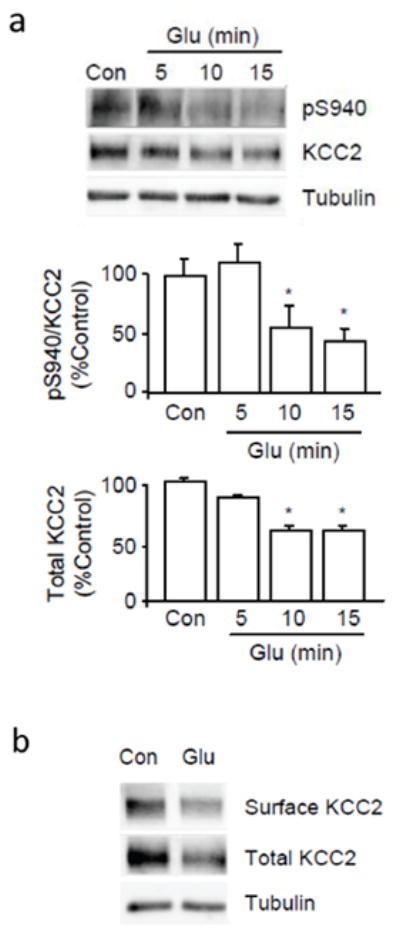
Glutamate caused the dephosphorylation of S940 and the degradation of KCC2. A, Cultured neurons were treated with 20 μM glutamate for 5 to 15 min before cell lysis. Proteins from whole cell lysates were analyzed by SDS-PAGE followed by immunoblotting with pS940 and anti-KCC2 antibodies. Full-length blots are provided in Supplementary Fig. 3. B, Biotinylation assay was performed on cultured neurons after a 10 min treatment of 20 μM glutamate. Anti-α-tubulin (Tubulin) antibodies were used to show equal protein loading. (*) Indicates statistically significant differences relative to control conditions as assessed by an unpaired t-test (p < 0.01; n = 4). Error bars represent the mean ± SEM.
NKCC1 did not mediate the large positive shift in EGABA
GABA is the primary excitatory neurotransmitter in the immature brain. The Na-K-Cl cotransporter NKCC1 maintains the depolarizing effects of GABA by pumping Cl− into the cell and sets EGABA to values greater than EM. However, temporal changes in its expression patterns as the brain matures remain controversial5,6,37. Interestingly, our bicuculline experiments indicated the presence of an additional source of Cl− influx that persisted throughout the experiment, suggesting the influence of an ion pump. We therefore used the NKCC1-specific inhibitor bumetanide to examine the role of NKCC1 in the glutamate-induced shift in EGABA. We added bumetanide (10 μM) to all solutions to prevent rapid recovery of NKCC1 activity. Prior to glutamate application GABA hyperpolarized the membrane potential, and GABA-activated currents reversed at −83 ± 4 mV (n = 9; Supplementary Fig. 4a,b). After glutamate exposure the average EGABA value was significantly shifted by 22 ± 5 mV to a value of −61 ± 5 mV (p < 0.01, paired t-test, Supplementary Figs. 1b and 4c). This large shift in EGABA was not significantly less than that observed in the absence of bumetanide. After glutamate exposure, neurons had an average EM value of −57 ± 2 mV, yielding an average DFGABA value of −4 ± 5 mV (Supplementary Fig. 1a). The change in DFGABA was statistically different from the shift observed in the absence of bumetanide. These data indicated that the combined effect of bumetanide and glutamate was to shift EGABA to an averaged shunting level. GABA responses became depolarizing in only 3 of 9 neurons, whereas 4 of 9 retained hyperpolarizing responses and 2 of 9 neurons exhibited a purely shunting response to GABA. These results demonstrated that NKCC1 activity supported the sustained depolarizing GABA responses in some neurons23, but did not mediate the large glutamate-induced shift in EGABA.
To support our electrophysiological experiments we measured the expression levels of NKCC1 in cultured neurons after glutamate treatment. Consistent with our results with bumetanide the expression levels of NKCC1 were not modified upon exposure to glutamate (Supplementary Fig. 4d). These results indicated that glutamate-induced shifts in EGABA are largely caused by the loss of KCC2 function and are minimally dependent on NKCC1. However, it should be noted that our selection of only those neurons with hyperpolarizing GABA responses favored the examination of cells exhibiting a dominant Cl− extruding mechanism and presumably less influential levels of NKCC1.
Effects of glutamate are Ca2+- and NMDA receptor-dependent
Deficits caused by glutamate are often associated with increased levels of intracellular Ca2+. We therefore examined the role of extracellular Ca2+ in the glutamate-induced shift in EGABA by co-applying the Ca2+ chelator EDTA with glutamate. GABA application initially elicited sustained hyperpolarizing membrane potentials, and neurons exhibited EGABA values ranging between −60 and −86 mV, with an average value of −75 ± 4 mV (n = 7, Fig. 5a,b). Co-application of glutamate and EDTA prevented the loss of hyperpolarizing GABA responses on six of seven neurons tested, with one neuron exhibiting a purely shunting response (Fig. 5a). Furthermore, EDTA reduced the large shift in EGABA, with an average value of −67 ± 2 mV after glutamate treatment (Fig. 5b,c). In some instances the glutamate treatment was without effect on EGABA, resulting in nearly superimposed average I–V relationships and an insignificant shift in EGABA (8 ± 3 mV, n = 7, p > 0.05, paired t-test). Neurons exhibited average EM values of −56 ± 2 mV and DFGABA values of −19 ± 4 mV before, and EM values of −56 ± 2 mV and DFGABA values of −10 ± 2 mV after glutamate application (Supplementary Fig. 1). We then evaluated the role of Ca2+ in the glutamate-induced dephosphorylation and degradation of KCC2 by incubating neurons in the presence of EDTA for 15 min prior to the glutamate treatment. We found that EDTA pretreatment reduced the glutamate-induced dephosphorylation of S940 and degradation of total KCC2, indicating that Ca2+ influx was necessary for dephosphorylation of S940 and degradation of KCC2 (Fig. 5d).
Figure 5.
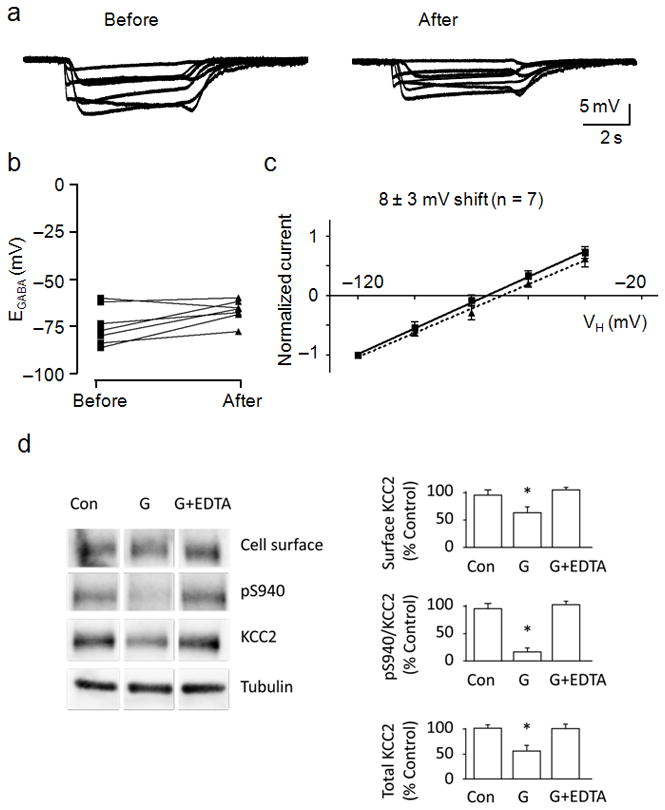
The glutamate-induced effects on KCC2 were Ca2+-dependent. A, Membrane potential responses to GABA (10 μM) were obtained before (left) and after (right) glutamate (20 μM) and EDTA (5 mM) co-application. B, Dot plot of the extrapolated EGABA values obtained before and after glutamate/EDTA treatment. Lines connect the EGABA values obtained for each cell. C, I–V plot of normalized GABA-activated currents obtained before (squares, solid line) and after (triangles, dashed line) glutamate/EDTA treatment. The calculated shift in EGABA caused by glutamate is displayed above the linear fits to the data points. EDTA was applied only during the glutamate pulse. D, Cultured neurons were treated with EDTA (5 mM) for 15 min before administration of glutamate followed by biotinylation and cell lysis. Biotin-labeled surface proteins were pulled down using avidin. Whole cell lysates and biotinylated portions were analyzed by SDS-PAGE followed by immunoblotting. For all panels, anti-α-tubulin (Tubulin) antibodies were used to show equal protein loading. The ratio of signal given by surface KCC2, pS940:KCC2 and the total amount of KCC2 were quantified in the panels shown to the right. (*) Indicates statistically significant differences relative to control conditions as assessed by an unpaired t-test (p < 0.01; n = 4). Error bars represent the mean ± SEM.
We next examined the role of the Ca2+-permeable NMDA receptor in this process by co-application of the NMDA receptor antagonist AP5 with glutamate. Membrane potential measurements recorded before and after glutamate treatment revealed that AP5 prevented the loss of hyperpolarizing responses to GABA in 7 of 9 neurons tested, whereas only 2 neurons exhibited depolarizing responses (Fig. 6a). I–V experiments performed before and after glutamate treatment revealed that co-application of glutamate and AP5 caused a significant but much smaller shift in EGABA, from −88 ± 4 mV to −72 ± 5 mV (p < 0.01, paired t-test) (Fig. 6b,c and Supplementary Fig. 1). Neurons exhibited averaged EM values of −60 ± 2 mV and −58 ± 2 mV, and averaged DFGABA values of −18 ± 4 mV and −8 ± 4 mV before and after glutamate treatment, respectively (Supplementary Fig. 1a). We conducted biochemical assays and found that application of AP5 minimized the glutamate-induced reduction of cell surface KCC2, dephosphorylation of S940 and degradation of total KCC2 (Fig. 6d).
Figure 6.
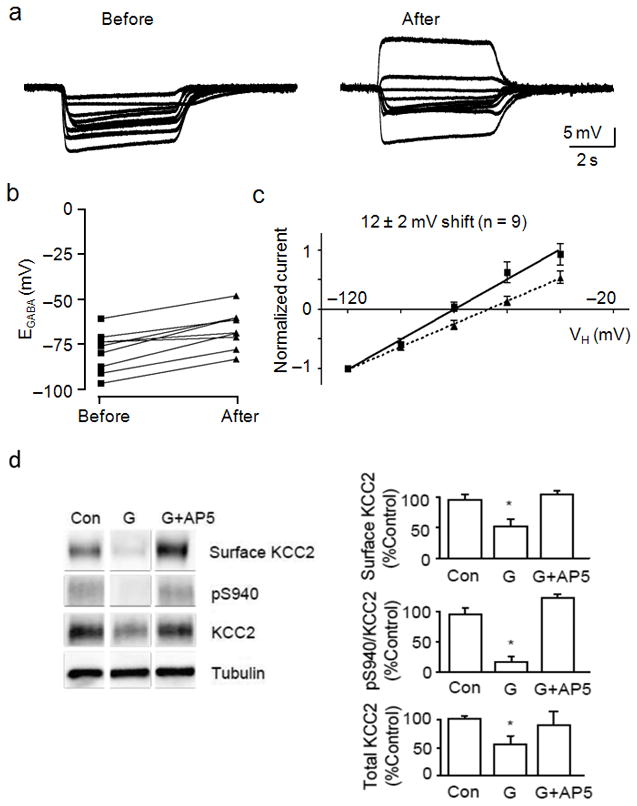
The glutamate-induced effects on KCC2 were mediated by NMDA receptors. A, Membrane potential measurements of GABA (10 μM) application were obtained before (left) and after (right) a 2 min exposure to glutamate (20 μM) and AP5 (50 μM). B, Dot plot of the extrapolated EGABA values obtained before and after glutamate/AP5 treatment. Lines connect the EGABA values for each cell. C, I–V plot of normalized GABA-activated currents obtained before (squares, solid line) and after (triangles, dashed line) glutamate/AP5 treatment. The calculated shift in EGABA caused by glutamate is displayed above the linear fits to the data points. D, Cultured neurons were treated with 50 μM AP5 for 15 min before administration of glutamate followed by biotinylation. Biotin-labeled surface proteins were pulled down using avidin. For all panels, anti-α-tubulin (Tubulin) antibodies were used to show equal protein loading. The ratio of signal given by cell surface KCC2, pS940:KCC2 and the total amount of KCC2 were quantified in the panels on the right. (*) Indicates statistically significant differences relative to control conditions as assessed by an unpaired t-test (p < 0.01; n = 4). Error bars represent the mean ± SEM.
Okadaic acid reduced the effects of glutamate on KCC2
The dephosphorylation of serine/threonine residues is mediated by specific protein phosphatases including PP1, PP2A and PP2B38. We employed specific pharmacological agents to inhibit endogenous phosphatase activities to determine which phosphatase(s) was responsible for dephosphorylation of S940. For this experiment we exposed neurons to OKA, which inhibits PP1/PP2A, or to cyclosporine A, which primarily inhibits PP2B38. Treatment of cultured neurons with OKA significantly increased phosphorylation of S940 to 192 ± 21% of control while cyclosporine A was without effect (Fig. 7a). This result suggested that dephosphorylation of S940 was carried out by PP1 or PP2A. To further distinguish between these closely related phosphatases we monitored the level of S940 phosphorylation with increasing concentrations of OKA. We determined that phosphorylation of S940 occurred at a concentration of OKA above 100 nM, with a potency of 481 nM (Fig. 7b). Together these results suggested that PP1 dephosphorylates KCC2 residue S940. We then evaluated the effects of inhibiting PP1 on the glutamate-induced dephosphorylation of KCC2 by pretreating neurons with OKA 15 min before the administration of glutamate. Pretreatment with OKA minimized the glutamate-induced reduction of cell surface KCC2, dephosphorylation of S940 and degradation of total KCC2 protein (Fig. 7c).
Figure 7.
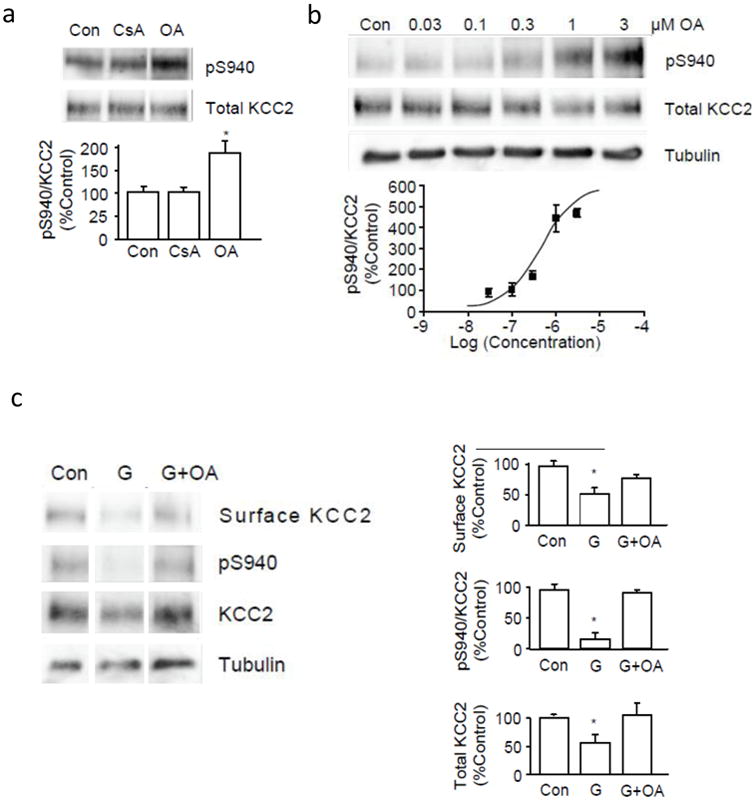
The dephosphorylation of S940 and internalization of KCC2 caused by glutamate is dependent on PP1. A, Cultured neurons were treated with 500 nM okadaic acid (OA) or 20 μM cyclosporin A (CsA) for 15 min before cell lysis. Proteins were analyzed by SDS-PAGE followed by immunoblotting using pS940 or anti-KCC2 antibodies. Signals from pS940:KCC2 between control and drug-treated conditions were quantified and compared in the lower panel. B, Different concentrations of OA (0.03 to 3 μM) were applied to cultured neurons for 15 min before cell lysis. Proteins were analyzed by SDS-PAGE followed by immunoblotting using pS940 and anti-KCC2 antibodies. Signals from pS940:KCC2 in each sample were quantified and normalized to total KCC2 before plotting against their respective log concentration values. C, Cultured neurons were treated with 1 μM OA for 15 min before administration of glutamate followed by biotinylation. Biotin-labeled surface proteins were pulled down using avidin. This surface fraction and whole cell lysates were analyzed by SDS-PAGE followed by immunoblotting. The cell surface amount of KCC2, pS940:KCC2 and the total amount of KCC2 protein were quantified in the panels on the right. (*) Indicates significantly different from control condition (p < 0.01, unpaired t-test, n = 3). Error bars represent the mean ± SEM.
To support our biochemical analysis we determined if OKA could minimize the loss of functional KCC2 and maintain hyperpolarizing GABA responses. We therefore examined EGABA and GABA-activated potentials before and after glutamate exposure on neurons that were pretreated with OKA for 10 min after establishing the perforated patch configuration. OKA was also added to the GABA- and glutamate-containing solutions to maintain the inhibition of phosphatase activity throughout the recording period. Neurons exhibited sustained hyperpolarizing responses to GABA and EGABA values ranged between −72 and −97 mV, with an average value of −86 ± 4 mV (n = 7, Fig. 8a,b). Steady-state I–V relationships revealed that OKA reduced the large shift in the average EGABA value after treatment with glutamate (Fig. 8c and Supplementary Fig. 1). Neurons exhibited an average EGABA value of −75 ± 5 mV (Fig. 8b). Although glutamate still caused a statistically significant shift in EGABA as assessed by a paired t-test (p < 0.01), the average glutamate-induced shift of 11 ± 3 mV was significantly less (p < 0.05) than that produced in the absence of OKA (Supplementary Fig. 1b). In addition, GABA-activated potentials remained hyperpolarizing after glutamate treatment on 5 of 7 neurons tested, whereas GABA depolarized only 2 neurons (Fig. 8a). Neurons exhibited averaged EM values of −66 ± 2 mV and −62 ± 2 mV, and averaged DFGABA values of −21 ± 4 mV and −12 ± 5 mV before and after glutamate treatment, respectively (Supplementary Fig. 1a). As a control, we applied the vehicle DMSO (0.1 %) to a separate set of neurons for 30 min and found no significant shift in EGABA values (−77 ± 5 mV before and −76 ± 1 mV after 30 min, n = 3, p > 0.05, paired t-test) or membrane potential responses over this period (Fig. 2g). Together these results indicated that inhibition of PP1 activity by OKA pretreatment can reduce the functional loss of KCC2 caused by glutamate.
Figure 8.
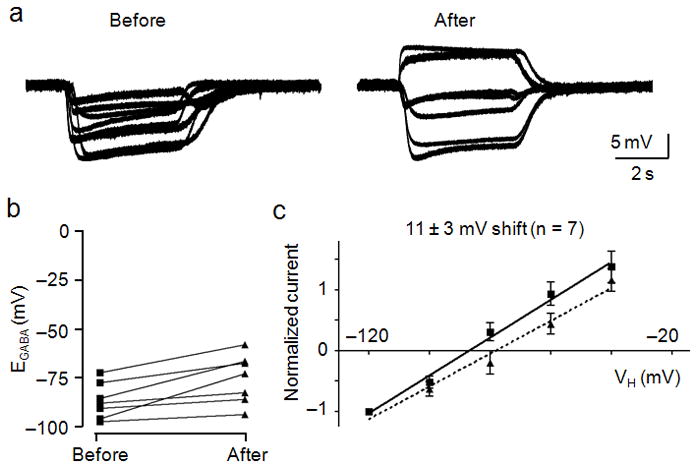
Okadaic acid reduced the glutamate-induced shift in EGABA. OA was applied 10 min prior to recording and for the entire duration of the experiment, including the glutamate pulse. A, Membrane potential measurements of GABA (10 μM) application were obtained before (left) and after (right) glutamate (20 μM) treatment. B, Dot plot of the extrapolated EGABA values obtained before and after glutamate treatment. Lines connect the EGABA values obtained for each cell both before and after glutamate exposure. C, I–V plot of normalized GABA-activated currents obtained before (squares, solid line) and after (triangles, dashed line) glutamate treatment. Error bars represent the mean ± SEM.
Discussion
We described for the first time a cellular mechanism by which elevated levels of ambient glutamate downregulated KCC2 and abolished hyperpolarizing GABAergic transmission. We used biochemical and electrophysiological analyses of cultured rat hippocampal neurons to study KCC2 and determined that the glutamate-induced loss of KCC2 function involved a molecular pathway beginning with NMDA receptor activation and Ca2+ influx that ultimately caused PP1-mediated dephosphorylation of KCC2 residue S940.
Cl− homeostatic mechanisms are the primary determinants of the ion conduction properties of GABAA and glycine receptors. While the mechanism of action and roles of the ClC channels in the brain are becoming increasingly clear39,40, the best characterized effectors of the Cl− distribution at rest in the central nervous system are NKCC1 and KCC2. Our data indicated that the role of KCC2 was to maintain hyperpolarizing GABA responses, and after the glutamate-induced loss of KCC2 function, the influence of NKCC1 was uncovered and it maintained depolarizing GABA responses. Due to our method of applying bath saline containing low concentrations of K+, it is highly unlikely that KCC2 reversed its directionality and contributed to Cl− loading, however, this process could occur in vivo or in acute brain slices where solution exchange is not as rapid41. Although our experiments were performed only on neurons exhibiting an adult-like dominant influence of KCC2, DIV14–21 day neurons are not adult neurons. Neurons become less plastic as they mature and could begin to express proteins that weaken or strengthen the surface stability of KCC2. Nevertheless, in our experiments pathophysiological levels of glutamate caused the selective disruption of the Cl− homeostatic mechanism such that Cl− permeable GABAA receptors depolarized neurons.
Our laboratory has previously demonstrated that PKC phosphorylates residue S940 thereby increasing both the amount and activity of KCC2 on the neuronal surface31. Group I metabotropic glutamate receptor (mGluR1) agonists shift EGABA to more hyperpolarized potentials42, likely by activation of PKC. It is possible that in our experiments mGluR1 activation of PKC was overwhelmed by the Ca2+ effect on PP1 activity. Our data is in agreement with and explains critical experiments demonstrating that elevated levels of glutamate caused a lasting depolarizing shift in EGABA values33. It might be expected that blockade of NMDA receptor activity would isolate the mGluR1 activation of PKC and cause a hyperpolarizing shift in EGABA. However, comparison of our AP5 and EDTA data suggest that other sources of Ca2+ such as L-type voltage-gated Ca2+ channels and intracellular stores could balance out PKC-dependent phosphorylation of S940. But despite these other possible sources of Ca2+, blockade of NMDA receptor activity accounted for the majority of the glutamate-induced shift in EGABA values and improved the maintenance of hyperpolarizing GABA responses from nearly 10 % to greater than 75 % of neurons tested.
We propose a dynamic phosphorylation-dependent mechanism controlled by the balance between PKC and PP1 activity at residue S940 that regulates the functional expression of KCC2. The efficiency of this regulatory process is significant given the high turnover rate of cell surface KCC2 and its dependence on clathrin-mediated endocytosis21,30,31. In our experiments, we observed a downregulation of surface KCC2 and a concurrent loss of hyperpolarizing GABAergic responses in a matter of minutes after glutamate exposure.
Excessive glutamate release after neuronal damage is well known16. Axonal damage causes a downregulation of KCC2 and a loss of hyperpolarizing GABAergic signaling43,44. KCC2 protein and expression levels also decrease after ischemic insults13,14,15, and victims of stroke have a higher susceptibility to seizures after the neurological insult45,46. Similarly, glutamate levels are elevated in sclerotic human epileptic brain tissue32,47 and KCC2 function is reduced in both human and animal models of epilepsy23,48. The pilocarpine model of epileptiform activity is associated with neuronal death in rat hippocampus and results in a depolarizing shift of EGABA and a reduction in total KCC2 protein levels that lasted weeks20. We recently reported that muscarinic receptor activation and pilocarpine-induced seizures in mice results in the phosphorylation of KCC2 residues Tyr903 and Tyr1087 and its degradation30. Brief periods of kindling-induced seizures in rats that are not associated with extensive neuronal damage causes a reduction in the expression of KCC2 that correlates with increased levels of endogenous BDNF/TrkB receptor signaling and the release of Ca2+ from intracellular stores49. Together with our present findings it is clear that the loss of KCC2 function is highly correlated with pathophysiological levels of ambient glutamate and Ca2+ flux in several disease states.
Our results indicated that KCC2 function is dynamically regulated by balancing the activation of specific protein kinases and phosphatases. Given that isoforms of these phosphatases and kinases are differentially expressed among specific neuronal subtypes and circuits, it is likely that certain neurons are more prone to glutamate-induced loss of KCC2 function. Indeed our experiments revealed that a small percentage of rat hippocampal neurons retained KCC2 function after exposure to glutamate. It is therefore possible that the susceptibility to compromised GABAergic signaling could underlie the etiology and therapeutic profiles of specific types of epilepsy. Our research also highlights KCC2 as a possible therapeutic target. The development of pharmacological agents that can restore KCC2 function by blocking its endocytosis and degradation could represent a novel clinical strategy.
Methods
Development of phospho-specific antibody
Oligopeptides of KCC2 C-terminal intracellular domain from amino acid (aa) 935 to aa 946 (DESRGSIRRKNP in which S940 is denoted by S) were chemically synthesized and a phosphate group was added to the residue S940 to form p-Pep. These phospho-peptides were subject to an immunization protocol provided by PhosphoSolutions, Inc. to yield a phospho-specific antibody. Briefly, 0.6 mg p-Pep was injected intradermally into a rabbit in Complete Freund’s Adjuvant. Two subsequent injections of 0.3 mg p-Pep in Incomplete Freund’s Adjuvant were administered 2 weeks and 4 weeks after the initial injection. Serum collection was carried out each week for the next 3 weeks, followed by another injection of 0.3 mg p-Pep in Incomplete Freund’s Adjuvant and 3 more weeks of serum collection. We then purified the phospho-specific antibody from the collected serum as described previously50.
Purification of fusion proteins
We performed this procedure as described previously31. Briefly, we treated E. coli transformed with DNA plasmids expressing the His-tagged C-terminal intracellular domain of KCC2 with 100 mM isopropyl 1-thio-β-D-galatopyranoside (Sigma) for 3 h and then lysed and sonicated the bacterial pellets using 6 M guanidine hydrochloride (pH 7.8) (Sigma). The fusion protein was then bound to ProBond™ resin (Invitrogen) in 8 M urea (pH 7.8) for 30 min and washed with decreasing pH of buffer. The fusion protein was eluted by washing the resin with a buffer at pH 4.0. The eluted protein was dialyzed extensively in phosphate-buffered saline (PBS) and stored at −80 °C before use. We determined protein concentration using a Micro BCA protein assay kit (Thermo Scientific).
In vitro phosphorylation of fusion proteins
We incubated 0.5 mg of His-C fusion protein with 50 μM rATP (Promega) and 5 ng of purified PKC (EMD Biosciences) in a buffer containing (in mM): 20 HEPES (pH 7.5) and 10 MgCl2 for 10 min at 30 °C and terminated by the addition of 2x SDS-PAGE sample buffer. We analyzed the reaction mixture by SDS-PAGE.
Transfection of HEK-293 cells
We transfected HEK-293 cells using an electroporation protocol as described previously31. First, we washed cells briefly in PBS before removing them from the culture dishes using 1 mL of 0.05 % trypsin-EDTA. We then spun down the cells by centrifugation at 4000 rpm for 5 min. The culture medium was removed and we added Opti-MEM (Invitrogen) reduced serum medium for resuspension. We added 3 μg of plasmid to 100 μL of the resuspended cells and transferred it to a Gene Pulser electroporation cuvette (Bio-Rad). We electroporated cells using a Gene Pulser XCell electroporation machine (Bio-Rad) and transferred the cells back to a 60 mm culture dish containing 5 mL of growth medium (DMEM supplemented with 10 % FBS and 10 μg/mL penicillin/streptomycin, Invitrogen) for incubation.
Immunoblotting
We extracted proteins from cultured cells using lysis buffer containing (in mM): 10 NaPO4, 5 EGTA, 5 EDTA, 10 Na pyrophosphate, 1 Na vanadate, 100 NaCl, 25 NaF, 2 % Triton X–100 and 0.5 % deoxycholate. We added fresh protease inhibitors leupeptin, pepstatin, and aprotinin (10 μg/mL, Sigma) before cell lysis. We then spun down the cell lysates using a bench top microcentrifuge at 13200 rpm at 4 °C for 10 min. We then separated the extracted proteins by SDS-PAGE and transferred them to a nitrocellulose membrane (Bio-Rad) for detection by immunoblotting as described previously31. We used a mouse monoclonal antibody targeting the KCC2 C-terminal intracellular domain (aa 932–1043) (anti-KCC2 from NeuroMab facility, UC Davis) as the primary antibody and an HRP-conjugated anti-mouse secondary antibody (Pierce Biotechnology). On a separate blot we determined the amount of phosphorylated residue S940 using the pS940 antibody and an HRP-conjugated anti-rabbit secondary antibody (GE Life Sciences).
Biotinylation assay
Cells were first washed twice with PBS with 50 mM MgCl2 and 100 mM CaCl2 (PBS-CM) and then incubated with 2 mL of PBS-CM containing 2 mg of EZ-link sulfo-NHS-SS-biotin (Pierce Biotechnology) for 30 min. We then washed the cells 3 times with PBS-CM containing glycine and bovine serum albumin (quench buffer). Lastly, we washed cells with PBS and lysed with lysis buffer as mentioned above. We spun down the cell lysates using a bench top microcentrifuge at 13200 rpm for 10 min. We then added 40 μL of 1:1 slurry of UltraLink immobilized Neutravidin beads (Pierce Biotechnology) and lysis buffer to the supernatant. The mixture was incubated at 4°C on a rotating wheel for 2 h. We then spun down the beads by centrifugation at 4000 rpm for 2 min, and then washed them twice with lysis buffer with 0.5 M NaCl and once with lysis buffer alone. We removed the lysis buffer after centrifugation and added 20 μL of sample buffer to the beads. We analyzed the sample by SDS-PAGE.
Electrophysiology
All the data points are presented as replicates of experiments performed on the same rat cultured hippocampal DIV14–21 day neuron both before and after the glutamate treatment. We did not obtain any data from a neuron exclusively before or after glutamate exposure. We excluded from our analysis all neurons with EM values above −50 mV at any point other than during the glutamate pulse. As mentioned in the text, we discarded nearly 25% of DIV14–21 neurons patched because they exhibited depolarizing GABA responses at the beginning of the experiment. Although neurons which exhibit depolarizing responses to GABA can still express KCC2, which could be verified by a combination of immunocytochemical and electrophysiological assays23, a sustained hyperpolarizing GABA response is a simple measure by which one can verify the presence of functional KCC2 using only electrophysiological techniques.
We used the perforated patch-clamp technique in every recording. We used gramicidin D (50 μg/mL, Sigma) to establish access resistances between 30–40 MΩ throughout the recording period. We performed the recordings at 34°C and applied all compounds locally to neurons by a gravity-fed three-barreled pipette driven by a fast-step motor (Warner Instruments). The recording pipette saline contained (in mM) 140 KCl and 10 HEPES, pH 7.4 KOH. Bath saline contained (in mM) 140 NaCl, 4.7 KCl, 2.5 CaCl2, 1.2 MgCl2, 10 HEPES, 11 glucose, pH 7.4 NaOH., We performed all the experiments for the determination of EGABA values in the presence of TTX (500 nM), DNQX (20 μM), and AP5 (50 μM) to block voltage-gated sodium channels, AMPA receptors, and NMDA receptors, respectively. However, we applied glutamate (20 μM) for 2 min without these antagonists and it was always applied in I=0 mode, never in voltage-clamp mode. After glutamate treatment, we immediately re-exposed neurons to the ion channel blocker/antagonists for 8 min prior to recording GABA-evoked currents. For the I–V experiments, we voltage-clamped neurons at specified holding potentials (20 mV increments in either direction beginning at −60 mV) for 30 s prior to the application of GABA. We performed the experiments testing furosemide inhibition, the role of excitatory GABA, and the time-course of EGABA shifts on separate groups of neurons. We employed voltage-ramp protocols prior to glutamate application to determine the reversal potential of leak currents for a secondary assessment of resting membrane potential. These data revealed our I=0 measurements of resting membrane potential were accurate to within 5 mV (data not shown). Furosemide, bumetanide, and okadaic acid were dissolved in DMSO (0.1% final concentration), all other compounds were dissolved in deionized H2O. We used a three-barreled (0.7 mm diameter per barrel) glass perfusion pipette (Warner Instruments) placed just above the target neuron to apply all agonists, antagonists, compounds, and control saline. We applied these solutions through the perfusion pipette at a rate of 0.5 mL/min and we used a computer controlled perfusion fast-step device (Warner Instruments) to ensure rapid and complete exchange of solutions. We obtained all data using an Axopatch 200B amplifier and pClamp 8 software (Axon Instruments). Data were recorded onto a personal computer for offline analysis using Clampfit. All records were filtered at 2 kHz and digitized at 10 kHz.
Statistical analysis
All experimental data derived from experiments described here were analyzed as previously described31. We used the MultiGauge program (Fujifilm) for the quantification of all immunoblots. We used GraphPad Prism 4 software for statistical analysis. We used paired and unpaired t-tests and one-way ANOVA with a post hoc Dunnett’s test where indicated. We constructed I–V plots and fit the data points by linear regression analysis using GraphPad Prism software.
Supplementary Material
Supplementary Figure 1. Glutamate caused shifts in DFGABA and EGABA values.
Supplementary Figure 2. The pS940 antibody was specific for phosphorylated S940.
Supplementary Figure 3. Glutamate decreased the levels of total KCC2 protein and phosphorylation of S940.
Supplementary Figure 4. The loss of hyperpolarizing GABA responses was not dependent on NKCC1 activity.
Acknowledgments
We thank Yolande Haydon and Liza K. Chau for critical comments on the manuscript and Dr. Hong Tang and Liliya Silayeva for providing technical assistance. The work was supported in part by NIH/NINDS grants NS036296, NS047478, NS048045 and NS054900. HHCL is supported by a Postdoctoral Fellowship from the American Heart Association. The article must be marked ‘advertisement’ in accordance with 18 U.S.C. Section 1734 solely to indicate this fact.
Footnotes
Author Contributions: H.H.C.L. and T.Z.D. contributed equally to this work. H.H.C.L. and J.A.W. performed biochemical experiments and T.Z.D. and P.A.D. performed electrophysiological recordings. H.H.C.L., T.Z.D. and S.J.M. designed the experiments and co-wrote the manuscript.
References
- 1.Payne JA, Stevenson TJ, Donaldson LF. Molecular characterization of a putative K-Cl cotransporter in rat brain. A neuronal-specific isoform. J Biol Chem. 1996;271:16245–16252. doi: 10.1074/jbc.271.27.16245. [DOI] [PubMed] [Google Scholar]
- 2.Rivera C, et al. The K+/Cl− co-transporter KCC2 renders GABA hyperpolarizing during neuronal maturation. Nature. 1999;397:251–255. doi: 10.1038/16697. [DOI] [PubMed] [Google Scholar]
- 3.Hubner CA, et al. Disruption of KCC2 reveals an essential role of K-Cl cotransport already in early synaptic inhibition. Neuron. 2001;30:515–524. doi: 10.1016/s0896-6273(01)00297-5. [DOI] [PubMed] [Google Scholar]
- 4.Ben-Ari Y. Excitatory actions of GABA during development: the nature of the nurture. Nat Rev Neurosci. 2002;3:728–739. doi: 10.1038/nrn920. [DOI] [PubMed] [Google Scholar]
- 5.Lu J, Karadsheh M, Delpire E. Developmental regulation of the neuronal-specific isoform of K-Cl cotransporter KCC2 in postnatal rat brains. J Neurobiol. 1999;39:558–568. [PubMed] [Google Scholar]
- 6.Blaesse P, Airaksinen MS, Rivera C, Kaila K. Cation-chloride cotransporters and neuronal function. Neuron. 2009;61:820–838. doi: 10.1016/j.neuron.2009.03.003. [DOI] [PubMed] [Google Scholar]
- 7.Kahle KT, et al. Roles of the cation-chloride cotransporters in neurological disease. Nat Clin Pract Neurol. 2008;4:490–503. doi: 10.1038/ncpneuro0883. [DOI] [PubMed] [Google Scholar]
- 8.Coull JA, et al. Trans-synaptic shift in anion gradient in spinal lamina I neurons as a mechanism of neuropathic pain. Nature. 2003;424:938–942. doi: 10.1038/nature01868. [DOI] [PubMed] [Google Scholar]
- 9.Cramer SW, et al. The role of cation-dependent chloride transporters in neuropathic pain following spinal cord injury. Mol Pain. 2008;4:36. doi: 10.1186/1744-8069-4-36. [DOI] [PMC free article] [PubMed] [Google Scholar]
- 10.Lu Y, Zheng J, Xiong L, Zimmermann M, Yang J. Spinal cord injury-induced attenuation of GABAergic inhibition in spinal dorsal horn circuits is associated with down-regulation of the chloride transporter KCC2 in rat. J Physiol. 2008;586:5701–5715. doi: 10.1113/jphysiol.2008.152348. [DOI] [PMC free article] [PubMed] [Google Scholar]
- 11.Price TJ, Cervero F, Gold MS, Hammond DL, Prescott SA. Chloride regulation in the pain pathway. Brain Res Rev. 2009;60:149–170. doi: 10.1016/j.brainresrev.2008.12.015. [DOI] [PMC free article] [PubMed] [Google Scholar]
- 12.Wu LA, Huang J, Wang W, Wang XJ, Wu SX. Down-regulation of K+-Cl− co-transporter 2 in mouse medullary dorsal horn contributes to the formalin-induced inflammatory orofacial pain. Neurosci Lett. 2009;457:36–40. doi: 10.1016/j.neulet.2009.03.107. [DOI] [PubMed] [Google Scholar]
- 13.Galeffi F, Sah R, Pond BB, George A, Schwartz-Bloom RD. Changes in intracellular chloride after oxygen-glucose deprivation of the adult hippocampal slice: effect of diazepam. J Neurosci. 2004;24:4478–4488. doi: 10.1523/JNEUROSCI.0755-04.2004. [DOI] [PMC free article] [PubMed] [Google Scholar]
- 14.Jaenisch N, Witte OW, Frahm C. Downregulation of potassium chloride cotransporter KCC2 after transient focal cerebral ischemia. Stroke. 2010;41:e151–159. doi: 10.1161/STROKEAHA.109.570424. [DOI] [PubMed] [Google Scholar]
- 15.Papp E, Rivera C, Kaila K, Freund TF. Relationship between neuronal vulnerability and potassium-chloride cotransporter 2 immunoreactivity in hippocampus following transient forebrain ischemia. Neuroscience. 2008;154:677–689. doi: 10.1016/j.neuroscience.2008.03.072. [DOI] [PubMed] [Google Scholar]
- 16.Ginsberg MD. Neuroprotection for ischemic stroke: past, present and future. Neuropharmacology. 2008;55:363–389. doi: 10.1016/j.neuropharm.2007.12.007. [DOI] [PMC free article] [PubMed] [Google Scholar]
- 17.Kristensen BW, Noraberg J, Zimmer J. The GABAA receptor agonist THIP is neuroprotective in organotypic hippocampal slice cultures. Brain Res. 2003;973:303–306. doi: 10.1016/s0006-8993(03)02550-2. [DOI] [PubMed] [Google Scholar]
- 18.Clarkson AN, Huang BS, MacIsaac SE, Mody I, Carmichael ST. Reducing excessive GABA-mediated tonic inhibition promotes functional recovery after stroke. Nature. 2010;468:305–309. doi: 10.1038/nature09511. [DOI] [PMC free article] [PubMed] [Google Scholar]
- 19.Jin X, Huguenard JR, Prince DA. Impaired Cl− extrusion in layer V pyramidal neurons of chronically injured epileptogenic neocortex. J Neurophysiol. 2005;93:2117–2126. doi: 10.1152/jn.00728.2004. [DOI] [PubMed] [Google Scholar]
- 20.Pathak HR, et al. Disrupted dentate granule cell chloride regulation enhances synaptic excitability during development of temporal lobe epilepsy. J Neurosci. 2007;27:14012–14022. doi: 10.1523/JNEUROSCI.4390-07.2007. [DOI] [PMC free article] [PubMed] [Google Scholar]
- 21.Rivera C, et al. Mechanism of activity-dependent downregulation of the neuron-specific K-Cl cotransporter KCC2. J Neurosci. 2004;24:4683–4691. doi: 10.1523/JNEUROSCI.5265-03.2004. [DOI] [PMC free article] [PubMed] [Google Scholar]
- 22.Cohen I, Navarro V, Clemenceau S, Baulac M, Miles R. On the origin of interictal activity in human temporal lobe epilepsy in vitro. Science. 2002;298:1418–1421. doi: 10.1126/science.1076510. [DOI] [PubMed] [Google Scholar]
- 23.Huberfeld G, et al. Perturbed chloride homeostasis and GABAergic signaling in human temporal lobe epilepsy. J Neurosci. 2007;27:9866–9873. doi: 10.1523/JNEUROSCI.2761-07.2007. [DOI] [PMC free article] [PubMed] [Google Scholar]
- 24.Semah F, et al. Is the underlying cause of epilepsy a major prognostic factor for recurrence? Neurology. 1998;51:1256–1262. doi: 10.1212/wnl.51.5.1256. [DOI] [PubMed] [Google Scholar]
- 25.Stephen LJ, Kwan P, Brodie MJ. Does the cause of localisation-related epilepsy influence the response to antiepileptic drug treatment? Epilepsia. 2001;42:357–362. doi: 10.1046/j.1528-1157.2001.29000.x. [DOI] [PubMed] [Google Scholar]
- 26.Kahle KT, et al. WNK3 modulates transport of Cl− in and out of cells: implications for control of cell volume and neuronal excitability. Proc Natl Acad Sci USA. 2005;102:16783–16788. doi: 10.1073/pnas.0508307102. [DOI] [PMC free article] [PubMed] [Google Scholar]
- 27.Rinehart J, et al. Sites of regulated phosphorylation that control K-Cl cotransporter activity. Cell. 2009;138:525–536. doi: 10.1016/j.cell.2009.05.031. [DOI] [PMC free article] [PubMed] [Google Scholar]
- 28.Watanabe M, Wake H, Moorhouse AJ, Nabekura J. Clustering of neuronal K+-Cl− cotransporters in lipid rafts by tyrosine phosphorylation. J Biol Chem. 2009;284:27980–27988. doi: 10.1074/jbc.M109.043620. [DOI] [PMC free article] [PubMed] [Google Scholar]
- 29.Wake H, et al. Early changes in KCC2 phosphorylation in response to neuronal stress result in functional downregulation. J Neurosci. 2007;27:1642–1650. doi: 10.1523/JNEUROSCI.3104-06.2007. [DOI] [PMC free article] [PubMed] [Google Scholar]
- 30.Lee HH, Jurd R, Moss SJ. Tyrosine phosphorylation regulates the membrane trafficking of the potassium chloride co-transporter KCC2. Mol Cell Neurosci. 2010;45:173–179. doi: 10.1016/j.mcn.2010.06.008. [DOI] [PMC free article] [PubMed] [Google Scholar]
- 31.Lee HH, et al. Direct protein kinase C-dependent phosphorylation regulates the cell surface stability and activity of the potassium chloride cotransporter KCC2. J Biol Chem. 2007;282:29777–29784. doi: 10.1074/jbc.M705053200. [DOI] [PubMed] [Google Scholar]
- 32.During MJ, Spencer DD. Extracellular hippocampal glutamate and spontaneous seizure in the conscious human brain. Lancet. 1993;341:1607–1610. doi: 10.1016/0140-6736(93)90754-5. [DOI] [PubMed] [Google Scholar]
- 33.Kitamura A, et al. Sustained depolarizing shift of the GABA reversal potential by glutamate receptor activation in hippocampal neurons. Neurosci Res. 2008;62:270–277. doi: 10.1016/j.neures.2008.09.002. [DOI] [PubMed] [Google Scholar]
- 34.Banke TG, McBain CJ. GABAergic input onto CA3 hippocampal interneurons remains shunting throughout development. J Neurosci. 2006;26:11720–11725. doi: 10.1523/JNEUROSCI.2887-06.2006. [DOI] [PMC free article] [PubMed] [Google Scholar]
- 35.Hewitt SA, Wamsteeker JI, Kurz EU, Bains JS. Altered chloride homeostasis removes synaptic inhibitory constraint of the stress axis. Nat Neurosci. 2009;12:438–443. doi: 10.1038/nn.2274. [DOI] [PubMed] [Google Scholar]
- 36.Vargová L, Jendelová P, Chvátal A, Syková E. Glutamate, NMDA, and AMPA induced changes in extracellular space volume and tortuosity in the rat spinal cord. J Cereb Blood Flow Metab. 2001;21:1077–1089. doi: 10.1097/00004647-200109000-00005. [DOI] [PubMed] [Google Scholar]
- 37.Plotkin MD, Snyder EY, Hebert SC, Delpire E. Expression of the Na-K-2Cl cotransporter is developmentally regulated in postnatal rat brains: a possible mechanism underlying GABA’s excitatory role in immature brain. J Neurobiol. 1997;33:781–795. doi: 10.1002/(sici)1097-4695(19971120)33:6<781::aid-neu6>3.0.co;2-5. [DOI] [PubMed] [Google Scholar]
- 38.Cohen P. The structure and regulation of protein phosphatases. Annu Rev Biochem. 1989;58:453–508. doi: 10.1146/annurev.bi.58.070189.002321. [DOI] [PubMed] [Google Scholar]
- 39.Foldy C, Lee SH, Morgan RJ, Soltesz I. Regulation of fast-spiking basket cell synapses by the chloride channel ClC-2. Nat Neurosci. 2010;13:1047–1049. doi: 10.1038/nn.2609. [DOI] [PMC free article] [PubMed] [Google Scholar]
- 40.Staley K, Smith R, Schaack J, Wilcox C, Jentsch TJ. Alteration of GABAA receptor function following gene transfer of the CLC-2 chloride channel. Neuron. 1996;17:543–551. doi: 10.1016/s0896-6273(00)80186-5. [DOI] [PubMed] [Google Scholar]
- 41.Thompson SM, Gahwiler BH. Activity-dependent disinhibition. II. Effects of extracellular potassium, furosemide, and membrane potential on ECL- in hippocampal CA3 neurons. J Neurophysiol. 1989;61:512–523. doi: 10.1152/jn.1989.61.3.512. [DOI] [PubMed] [Google Scholar]
- 42.Banke TG, Gegelashvili G. Tonic activation of group I mGluRs modulates inhibitory synaptic strength by regulating KCC2 activity. J Physiol. 2008;586:4925–4934. doi: 10.1113/jphysiol.2008.157024. [DOI] [PMC free article] [PubMed] [Google Scholar]
- 43.Nabekura J, et al. Reduction of KCC2 expression and GABAA receptor-mediated excitation after in vivo axonal injury. J Neurosci. 2002;22:4412–4417. doi: 10.1523/JNEUROSCI.22-11-04412.2002. [DOI] [PMC free article] [PubMed] [Google Scholar]
- 44.Toyoda H, et al. Induction of NMDA and GABAA receptor-mediated Ca2+ oscillations with KCC2 mRNA downregulation in injured facial motoneurons. J Neurophysiol. 2003;89:1353–1362. doi: 10.1152/jn.00721.2002. [DOI] [PubMed] [Google Scholar]
- 45.Bladin CF, et al. Seizures after stroke: a prospective multicenter study. Arch Neurol. 2000;57:1617–1622. doi: 10.1001/archneur.57.11.1617. [DOI] [PubMed] [Google Scholar]
- 46.Garrett MC, et al. Predictors of seizure onset after intracerebral hemorrhage and the role of long-term antiepileptic therapy. J Crit Care. 2009;24:335–339. doi: 10.1016/j.jcrc.2008.10.015. [DOI] [PubMed] [Google Scholar]
- 47.Cavus I, et al. Decreased hippocampal volume on MRI is associated with increased extracellular glutamate in epilepsy patients. Epilepsia. 2008;49:1358–1366. doi: 10.1111/j.1528-1167.2008.01603.x. [DOI] [PubMed] [Google Scholar]
- 48.Palma E, et al. Anomalous levels of Cl− transporters in the hippocampal subiculum from temporal lobe epilepsy patients make GABA excitatory. Proc Natl Acad Sci USA. 2006;103:8465–8468. doi: 10.1073/pnas.0602979103. [DOI] [PMC free article] [PubMed] [Google Scholar]
- 49.Rivera C, et al. BDNF-induced TrkB activation down-regulates the K+-Cl− cotransporter KCC2 and impairs neuronal Cl− extrusion. J Cell Biol. 2002;159:747–752. doi: 10.1083/jcb.200209011. [DOI] [PMC free article] [PubMed] [Google Scholar]
- 50.Jovanovic JN, Thomas P, Kittler JT, Smart TG, Moss SJ. Brain-derived neurotrophic factor modulates fast synaptic inhibition by regulating GABA(A) receptor phosphorylation, activity, and cell-surface stability. J Neurosci. 2004;24:522–530. doi: 10.1523/JNEUROSCI.3606-03.2004. [DOI] [PMC free article] [PubMed] [Google Scholar]
Associated Data
This section collects any data citations, data availability statements, or supplementary materials included in this article.
Supplementary Materials
Supplementary Figure 1. Glutamate caused shifts in DFGABA and EGABA values.
Supplementary Figure 2. The pS940 antibody was specific for phosphorylated S940.
Supplementary Figure 3. Glutamate decreased the levels of total KCC2 protein and phosphorylation of S940.
Supplementary Figure 4. The loss of hyperpolarizing GABA responses was not dependent on NKCC1 activity.