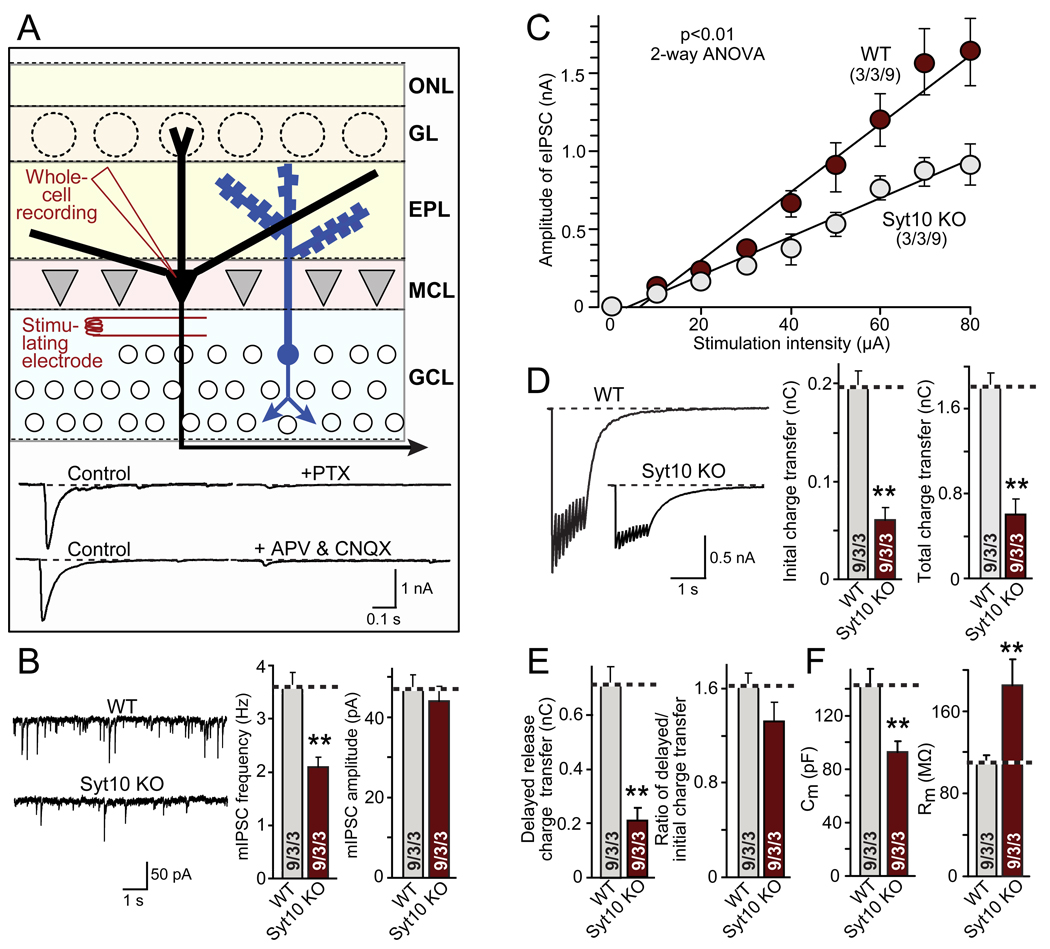
Figure 2. Syt10 KO Impairs synaptic transmission as analyzed in acute olfactory bulb slices.
A. Recording strategy. Whole-cell recordings were performed in mitral neurons; inhibitory postsynaptic currents (IPSCs) were triggered by stimulation (80 µA for 1 s) with an extracellular concentric bipolar electrode in the granule cell layer to antidromically activate mitral neurons. IPSCs are dependent on retrograde action potentials in mitral neurons that trigger reciprocal excitatory postsynaptic currents (EPSCs) and IPSCs in dendro-dendritic synapses in the external plexiform layer (EPL), as shown by the sensitivity of responses to both the GABA-receptor blocker picrotoxin (PTX) and the glutamate receptor blockers D-APV and CNQX (bottom). EPSCs are not visible in the mitral cell recordings because excitatory synapses are only formed on granule cells, not between mitral cells. For optimization of the location of stimulus electrodes, see Fig. S2A (ONL, olfactory nerve layer; GL, glomerular layer; MCL, mitral cell layer; GCL, granule cell layer).
B. Representative traces (left), frequency (middle) and amplitude (right) of spontaneous 'mini' mIPSCs recorded in 1 µM tetrodotoxin (TTX), 20 µM CNQX, and 50 µM D-APV.
C. Input/output curves of evoked IPSCs (for sample traces, see Fig. S2B)
D. Representative traces (left) and synaptic charge transfer during the initial 100 ms (middle) and total train (right) of evoked IPSCs elicited by a 10 Hz stimulus train at 80 µA applied for 1 sec.
E. Analysis of delayed release during the 10 Hz 1 sec stimulus train as the delayed charge transfer (left) and the ratio of delayed to total charge transfer (right).
F. Capacitance (left) and input resistance (right) of mitral cells in olfactory bulb slices from wild-type and Syt10 KO mice.
All summary graphs show means ± SEMs; number of recordings/slices/animals analyzed are shown in individual bars. Statistical analyses were performed by Student's t-test comparing mitral cell neurons in Syt10 KO and littermate wild-type control slices (**=p<0.01), except for the input/output cure which was analyzed by 2-way ANOVA (F=12.84).

