Abstract
Surface-enhanced Raman scattering (SERS) is a phenomenon that occurs on nanoscale-roughed metallic surface. The magnitude of the Raman scattering signal can be greatly enhanced when the scatterer is placed in the very close vicinity of the surface, which enables this phenomenon to be a highly sensitive analytical technique. SERS inherits the general strongpoint of conventional Raman spectroscopy and overcomes the inherently small cross section problem of a Raman scattering. It is a sensitive and nondestructive spectroscopic method for biological samples, and can be exploited either for the delivery of molecular structural information or for the detection of trace levels of analytes. Therefore, SERS has long been regarded as a powerful tool in biomedical research. Metallic nanostructure plays a key role in all the biomedical applications of SERS because the enhanced Raman signal can only be obtained on the surface of a finely divided substrate. This review focuses on progress made in the use of SERS as an analytical technique in bio-imaging, analysis and detection. Recent progress in the fabrication of SERS active nanostructures is also highlighted.
1. Introduction
In 1923, inelastic light scattering was first theoretically predicted by Smekal. Then Raman and Krishnan experimentally observed the phenomenon in 1928 which is now known as Raman scattering.1 The wavelength changes when a phonon undergoes this inelastic light scattering attributed to the excitation of vibrational modes of a molecule. Because the molecular polarizability changes as the molecular vibrations displace the constituent atoms from their equilibrium positions,2 Raman spectroscopy provides abundant structural information and does not suffer from aqueous interference. It plays an increasingly important role in analytical science, especially in biomedical analysis. However, Raman scattering cross sections are typically 12–14 orders of magnitude smaller than those of fluorescence.3 The inherently small intensity of the signal has restricted the application of Raman spectroscopy to the analysis of relatively concentrated samples for many years. In 1974, Fleischman and co-workers observed enhanced Raman signals from pyridine on a rough silver electrode.4 The signal enhancement was attributed to the enrichment of analyte molecules on the rough surface. After that many studies from different laboratories gave evidence that the enormously strong Raman signal is caused by the special property of the noble-metal substrate.5,6 This phenomenon is known as surface-enhanced Raman scattering (SERS), which has overcome the inherent problem of low sensitivity in conventional non-resonant Raman spectroscopy. The enhancement factors can reach 1014 corresponding to a cross section of at least 10 16 cm2 for each molecule.7 Such a big cross section has made SERS a single molecule detection tool.8–13
SERS fully inherits the advantages of normal Raman spectroscopy, abundant structural information and low aqueous interference. At the same time, along with the development of biomedical science, chemists and biologists have paid more attention to the components present in very low absolute amounts in living organisms. Therefore, SERS is an ideal method for the detection and characterization of low analyte concentration in a complex biological environment, and has attracted growing interest in biochemical and biomedical fields. Besides, every SERS active molecule has a unique enhanced spectrum because different functional groups have different characteristic vibrational energies.2 Some of the active molecules have extremely strong SERS signal even at a very low concentration. They can be used as Raman reporters for the imaging or detection of bio-markers in biological samples by their high spectral intensity and specificity. The SERS signal originated from different molecules can be easily distinguished based on their characteristic narrow bands. Simultaneous detection of different components can be realized either by using the unique spectra of molecular reporters or by the signals directly from analytes. In this article, we will review the application of SERS in bio-imaging, analysis and detection. Since the SERS enhancement strongly depends on the metallic nanostructure substrates, we will also discuss the use of nanostructures in biomedical field.
2. Fundamental theory of Raman and SERS
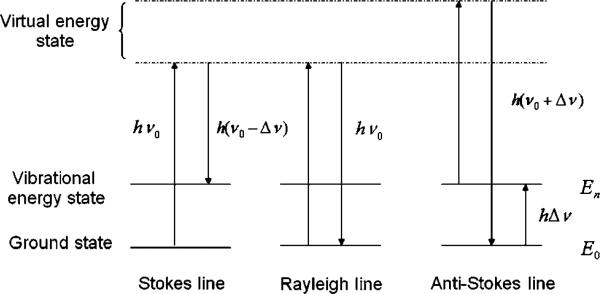
Generally, when light is incident upon a substance, the photons with a wavelength in the region of infrared and ultraviolet are easily to be absorbed. The ultraviolet photons will excite the outer-shell electron from ground state to an excited state. A fluorescent emission will be generated when the electron goes back to the ground state after vibrational relaxation in the excited state. In Raman scattering, the electron will undergo a transition from ground state to a virtual state after being excited by an excitation photon (ν0). When the electron moves back to the ground state, a scattered photon with a frequency of ν1 will be generated. The difference between ν0 and ν1 corresponds to the vibrational level of the molecule. If the excitation frequency ν0 changes, the scattering frequency ν1 will change, but the difference between them (Δν = |ν0-ν1|) will not change. The wave number shown in a Raman spectrum stands for the frequency shift from excitation photon to scattered photon. Therefore, the position of a Raman band will not change if a different excitation wavelength is used. The excited electron in Raman scattering does not undergo a vibrational relaxation and the process of Raman scattering is shorter than that of fluorescence. The optical absorption in infrared region will change the vibrational mode of a molecule. Thus infrared spectroscopy (IR) and Raman spectroscopy are both molecular vibrational spectroscopy. The difference is that IR is a single-photon process and the absorbed photon must correspond to the molecular vibrational energy level. Raman scattering is a two-photon process, and, in principle, it can be excited by any excitation wavelength.
When light is scattered, most of the photons will be elastically scattered, which is known as Rayleigh scattering. Only a small part of the photons will undergo a Raman scattering. If the scattering frequency ν1 is smaller than the original ν0, the scattering is called Stokes Raman line. Otherwise, it is an anti-Stokes line (ν1 > ν0). As shown in Fig. 1, the electron is excited from vibrational energy state to the virtual energy state in the anti-Stokes scattering. Stokes line and anti-Stokes line are symmetrically distributed on two sides of the Rayleigh line. However, anti-Stokes line is weaker than Stokes line because the number of electrons in vibrational energy state is much smaller than that in ground state according to Boltzmann's law of distribution.
Fig. 1.
Diagram of energy level of Raman and Rayleigh scattering.
The mechanism of SERS has become a hot topic of research since the discovery of the phenomenon. Indeed, there are several models established for the enhancement. The two common mechanisms are chemical enhancement and electromagnetic enhancement. In chemical enhancement, the metal and adsorbate molecules create a charge-transfer state, which increases the probability of a Raman transition by providing a pathway for resonant excitation.14 Chemical enhancement is site-specific and analyte-dependent. The analyte molecules must be directly adsorbed to the metallic surface to experience the charge-transfer state.2 The theory of chemical enhancement has been developed slowly in recent years. Because charge transfer process is complicated, and there are too many influencing factors such as analyte molecules, nanostructures of metals, excitation wavelength, and molecular vibrational modes, it is difficult to simulate all these factors theoretically. In addition, the charge-transfer state is an excited state with very short life. It is not possible to observe such unstable state in experiment. So far, only a few simple models have been theoretically studied.15
In electromagnetic enhancement, when electromagnetic radiation with certain frequency is incident upon the nanostructures, the conduction electrons will be driven into collective oscillation by the electric field of the radiation, which is known as surface plasmon resonance (SPR). Large electromagnetic fields will be generated at the surface of the nanostructures. The Raman signals originated from the molecules being confined within these electromagnetic fields will be greatly enhanced. Therefore, the electromagnetic enhancement has long-range effect because analyte molecules do not have to “touch” the metallic surface. Electromagnetic enhancement emphasizes the role of the substrate supporting the electromagnetic fields, which depends strongly on its inherent properties such as material, size, shape, and interparticle spacing. Theoretical modeling has long been a method to study the electromagnetic enhancement.16,17 By this method many special metallic nanostructures have been predicted to be extremely SERS active.18–20 We believe that the progress made in fundamental theory can greatly facilitate the development of SERS in the future.
3. SERS substrates used for bio-imaging, detection & analysis
The most important aspect of performing a SERS experiment is the choice and use of SERS substrate. It has been proved that only substrates with nanoscale “roughness”, such as rough electrodes and nanoparticles, can provide SERS enhancement. The shape, component, size and interparticle spacing of the metallic nanostructures are critical factors influencing the SPR and electromagnetic fields. These factors must be chosen carefully to ensure strong SERS enhancement and good signal reproducibility.21 Generally, conventional SERS substrates include rough electrodes, nanoparticles, and supported nanoarrays. Electrodes roughened by the oxidation–reduction cycle are the earliest and most stable SERS substrates. They enable in situ SERS detection of catalytic reactions and other electrochemical systems.22,23 However, rough electrodes are rarely used in biomedical research because their SERS enhancement factor is lower than other substrates and the surface reproducibility is poor.
Metallic nanoparticles can be chemically synthesized in glass flasks without sophisticated instrumentation. By far, they are the most commonly used SERS substrates and provide the most sensitive SERS experiments, even single-molecule detection.9,24 As we know, the Raman scattering in SERS takes place in the high local optical fields of noble metallic nanostructures, and this is the most important factor of the targeted study within a complex biological environment. Therefore, nanoparticles are well suited to the targeted imaging and detection in biological samples because they can be easily dispersed in solution-phase systems. Besides bio-application, nanoparticles are also used extensively in chemical sensing, especially in trace analysis. Examples are the detection of perchlorate,25 TNT,26 and nuclear waste.27
Although nanoparticles have strongest SERS enhancement, the SERS signal they provided are often not reproducible. The nanoparticle suspension is an unstable system and the interparticle structure changes from time to time. Supported nanoarrays can overcome this disadvantage by fixing the nanoparticles or other delicate metallic nanostructures on a 1D, 2D or 3D substrate. The supporting substrates, such as carbon nanotubes and porous materials,28,29 always have well-defined structures. Thus a supported nanoarray may have a secondary structure or even tertiary structure. These unique structures provide not only stability to the SERS substrates but also strong SERS enhancement due to the coupling of different SPR modes. Today, researchers worldwide continue to fabricate novel SERS substrates to maximize the enhancement and improve the reproducibility. These studies are extended to non-coin metals and even metal oxide materials.30–34 Typical SERS substrates and their chemical analytes are listed in Table 1.
Table 1.
SERS substrates and analytes
| Metallic nanostructures | Analytes | Detection limits | Ref. |
|---|---|---|---|
| Rough electrodes | |||
| Au electrode | Fluoroacetate anions | N.A. | 23 |
| Polypyrrole | N.A. | 35,36 | |
| Ethylene | N.A. | 37 | |
| Benzonitrile | N.A. | 38 | |
| Bombesin | N.A. | 39 | |
| Pyridoxine | N.A. | 40 | |
| Ag electrode | Pyridine | N.A. | 4,41 |
| Bombesin-like peptides | N.A. | 39,42 | |
| Single-walled carbon nanotubes | N.A. | 43 | |
| Flavone and hydroxy derivatives | N.A. | 44 | |
| Isonicotinic acid | N.A. | 45 | |
| Benzonitrile | N.A. | 38 | |
| α-Aminophosphinic acids | N.A. | 46 | |
| Phosphonate derivatives of imidazole, thiazole, and pyridine | N.A. | 47 | |
| Supported 1D nanoarray | |||
| Ag NPs on single-walled carbon nanotube | Single-walled carbon nanotube | N.A. | 48 |
| Au–Ag core-shell NPs on multi-walled carbon nanotube | Adenine and 4-aminothiophenol | N.A. | 28 |
| Supported 2D nanoarray | |||
| Ag NPs on Ag surface | Pyridine, pyrazine and benzene | N.A. | 49 |
| Ag island film | N,N′-Bis(neopentyl)-3,4,9,10-perylenebis(dicarboximide) | Single molecule | 50 |
| TiO2 NPs on Au surface | Polypyrrole | N.A. | 51 |
| Au NPs in Si microholes | Rhodamine 6G | 1 × 10⁻⁸ M | 52 |
| Ag NPs in Si microholes | Rhodamine 6G | 1 × 10⁻¹⁰ M | 52 |
| Pd nanostructures on flat film | 4-Mercaptopyridine | N.A. | 53 |
| SiO2–Ag “post-cap” nanostructure | trans-1,2-Bis(4pyridyl)ethane | N.A. | 54 |
| Ag on cicada wing | Rhodamine 6G | N.A. | 55 |
| Ag elliptical arrsay on Si wafer | Rhodamine 6G | N.A. | 56 |
| Au on polystyrene nanosphere arrays | Crystal violet and urine | N.A. | 57 |
| Ag nanoarrays on poly(dimethylsiloxane) | Crystal violet | 1 × 10⁻⁸ M | 58 |
| Mitoxantrone | 1 × 10⁻⁹ M | ||
| Ag dot dimer arrays | 4,4′-Bipyridine and 2,2′-bipyridine | N.A. | 59 |
| Ag NPs on silica rods arrays | 4-Aminobenzenethiol | N.A. | 60 |
| Supported 3D nanoarray | |||
| Ag NPs on aluminium oxide | 4-Mercaptopyridine | 1 × 10⁻⁶ M | 61 |
| Nanoporous Cu and Ni | Rhodamine 6G | 1 × 10⁻⁸ M | 29 |
| Au nanostructures on polyaniline membranes | 4-Mercaptobenzoic acid | N.A. | 62 |
| Ag-coated silica beads | r-IgG | 1 × 10⁻¹⁰ g mL–1 | 63 |
| Au–Ag core-shell NPs on Fe3O4 hybrid nanospheres | 4-Aminothiophenol | N.A. | 64 |
| NPs suspension | |||
| Ag NPs | Rhodamine 6G | Single molecule | 8 |
| Crystal violet | Single molecule | 9 | |
| Bombesin-like peptides | N.A. | 65 | |
| Flavone and hydroxy derivatives | N.A. | 44 | |
| Polycyclic aromatic hydrocarbons and calixarenes | 1 × 10⁻⁸ M | 66 | |
| 2,4,6-TNT | <1 × 10⁻¹⁰ g | 26 | |
| Phenylacetic acid, 3-phenylpropionic acid, 4-phenylbutyric acid, 5-phenylvaleric acid, and 6-phenylhexanoic acid | N.A. | 67 | |
| Pyrene | 1 × 10⁻⁷ M | 68 | |
| Triphenylene | 1 × 10⁻⁷ M | 69 | |
| 1,10-Phenanthroline | N.A. | 70 | |
| Au NPs | 2,2′-Biquinoline and 8-hydroxyquinoline | N.A. | 71 |
| 2,4,6-TNT | <1 × 10⁻¹⁰ g | 26 | |
| Poly(4-vinylpyridine) | N.A. | 72 | |
| Phenyldithioester | N.A. | 73 | |
| Star-shaped Au NPs | 1-Naphthalenethiol, AlexaFluor 750, and phenol | N.A. | 74 |
| Au–Ag core-shell NPs | 1,10-Phenanthroline | N.A. | 75 |
| Ag–Au core-shell NPs | 1,10-Phenanthroline | N.A. | 75 |
| Au-SiO2 core-shell NPs | Nile blue A, toluidine blue O, and methylene blue | N.A. | 76 |
| TiO2-core Au-shell NPs | meso-Tetra(4-carboxylphenyl) porphine, tris(2,2′-bipyridyl) ruthenium(ii) chloride and Rhodamine 6G (R6G) | N.A. | 77 |
| Other substrates | |||
| Electromigrated nanoscale Au gaps | p-Mercaptoaniline | <100 molecules | 78 |
| Sphere segment void Au surface | Benzenethiol | N.A. | 79 |
| Cy3 and Cy5 | N.A. | 80 | |
| Fe, Co, and Ni electrodes | 1,10-Phenanthroline | N.A. | 32 |
| Au@Pt NPs film electrodes | CO, H2 and benzene | N.A. | 81 |
| Rh and Pd surfaces | Adenine | N.A. | 31 |
| Ni electrode | Pyridine | N.A. | 82 |
| TiO2 NPs | 4-Mercaptobenzoic acid | 1 × 10⁻⁵ M | 33 |
| Ag NPs dimers | 4-Methylbenzenethiol | N.A. | 83 |
| Metal coated tip | Single-walled carbon nanotube | 1 tube | 84 |
| Double-hole nanostructure in metal film | Oxazine 720 | ~20 molecules | 85 |
4. Biomedical applications of SERS
4.1 Detection and analysis of biomolecules based on SERS
Sensitive and detailed molecular structural information plays an increasingly important role in biochemistry and biomedicine. Delivering molecular structural information from the target analyte in aqueous solution is the most important advantage of SERS, which until now has not been possible by any other technique. SERS has therefore become a useful spectroscopic method in detection and analysis of biomolecules. The sensitivity of SERS in biomolecular detection has been proved to be excellent since the single adenine molecule SERS spectrum was first obtained by using Ag nanoparticles as SERS substrate.10 Generally, SERS detection of biomolecules is very straightforward. Two approaches can be used to make the analyte molecules anchored onto SERS active substrates. In one approach, sample molecules are immobilized onto nanoparticles, typically Au and Ag, suspended in solution phase, through either electrostatic interaction or conjugation chemistry. In the other approach, instead of using suspended nanoparticles, solid substrates that contain nanostructured SERS active components are employed to anchor the analytes. In both methods, only low concentrations of analytes are needed, due to the high sensitivity of SERS detection.
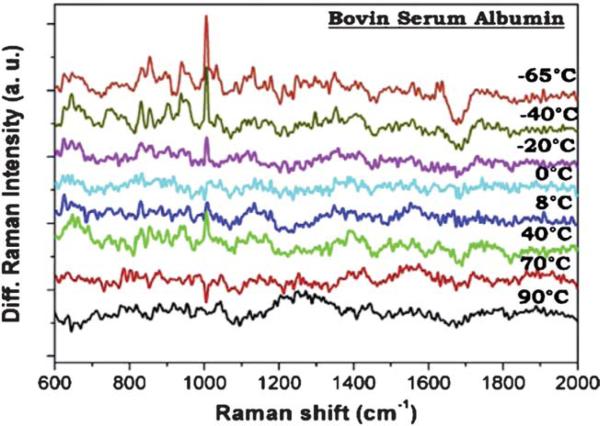
Recently, preconcentration method was applied to SERS detection to earn additional sensitivity. In that work, adenine molecules were concentrated on the surface of gold electrode by an electrokinetic preconcentration technique, and the SERS signal of 10 fM solution was amplified to the level of the signal of non-preconcentrated 1 μM sample.86 Besides high sensitivity, SERS provides high structural information content that can be used to study the secondary structure of macromolecules such as proteins and nucleic acids. A recent example is the study of the structural changes of different proteins including lysozyme, ribonuclease-B, bovin serum albumin (BSA) and myoglobin due to alteration of temperature in the range of –65 and 90 °C.87 Fig. 2 shows the spectral changes of BSA at different temperatures. The position and intensity ratio changes obtained in the difference spectra indicate the structural changes of the protein molecules. Interaction between different biomolecules, or between biomolecules and drugs, is usually accompanied with molecular structural changes. SERS can be employed to study the mechanisms of such interactions by providing real-time structural information.88 And the methods developed in the mechanism studies could be used to screen anti-cancer drugs in vitro.89 Surface-enhanced resonance Raman scattering (SERRS) is similar to SERS except that it is carried out under certain conditions. When the excitation frequency is close to the absorption of the analyte and the plasmon of the metal surface, a resonance contribution from the chromophore will be coupled with the SERS effect and give higher enhancement. SERRS can be used to detect the disentangling interfacial redox processes of proteins.90 Recently, gold film covered silver electrode was used to take advantage of the electrochemical properties and chemical stability of gold and the strong SERS enhancement of silver. SERRS of cytochrome c molecules adsorbed on gold surface was excited in the violet spectral range for the first time.91
Fig. 2.
Difference SERS spectra of BSA protein with respect to the BSA spectrum at room temperature.87Reproduced by permission of Elsevier.
4.2 Imaging and analysis of cells based on SERS
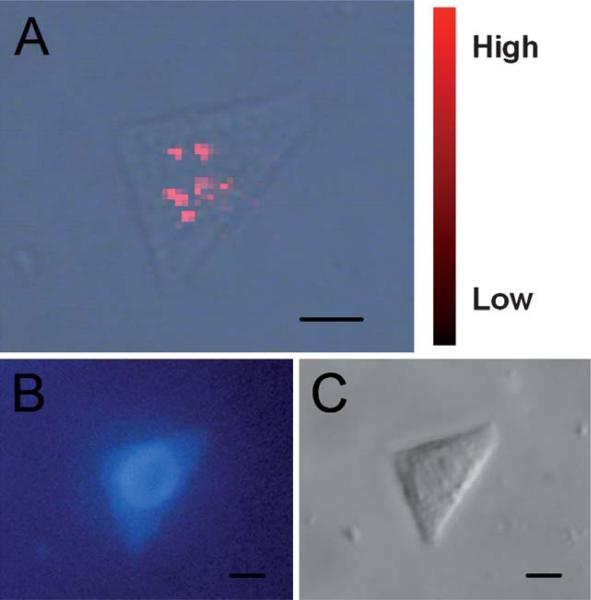
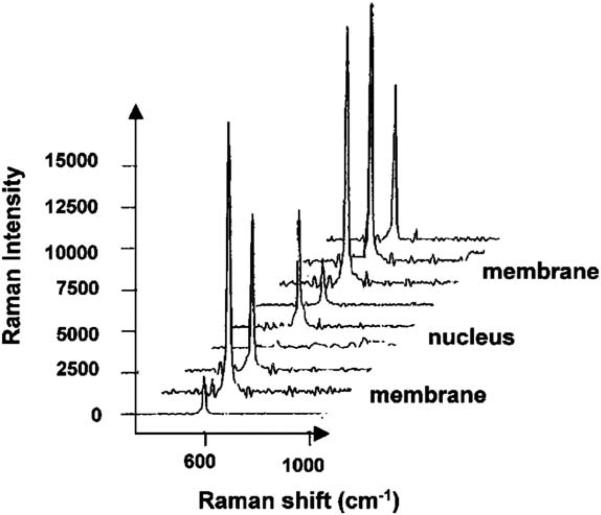
Because the native constituents are present in a cell at very low concentrations and the applicable excitation laser intensity is limited by effects of cell degeneration, normal Raman scattering from cells is very weak. However, it is easy to collect informative signals from the intracellular microcosm within seconds in a SERS experiment. The strategic point of performing a SERS experiment for cells is the emplacement of SERS substrate. Studying single living cells by SERS based on Au nanoparticles was first reported by Kneipp et al.92 The nanoparticles’ internalization into cells was achieved by fluid phase uptake. Generally the nanoparticles were mixed with the culture medium 24 h before the experiment. Immediately before the experiments, free nanoparticles were removed by rinsing with a buffer solution. The obtained Raman bands were originated from native constituents such as DNA, RNA, phenylalanine, and tyrosine. However, there is an unarguable fact that the distribution of bare nanoparticles in cells is not under control. In the past few years, SERS detection methods for intracellular localized measurements have been developed by transporting the nanoparticles to cell organelles. For example, nuclear targeted detection can be realized by functionalizing nanoparticles with nuclear localization signal (NLS) peptide derived from virus.93 Fig. 3 shows the SERS mapping of a single living cell treated with targeted nanoprobe. The conjugation of functional biomolecules and the SERS substrate is very important in the fabrication of targeted SERS nanoprobe. The theory of SERS enhancement emphasizes the adsorption or compact adjacency of the analyte and the metal surface. If the metal surface is fully covered, or if the modified reagents impose too much influence on the SERS detection, the functionalized nanoparticles will not be able to enhance the Raman signal from cellular components.94 Recently, a new analytical approach for intracellular detection utilizing a SERS-enabled nanopipette has been reported. A glass pipette was modified with positively charged polymer and then coated with negatively charged Au nanoparticles. This nanopipette tip can enhance Raman signal in its vicinity after insertion into the living cells.95
Fig. 3.
(A) Merged SERS image made up of a SERS map and an optical transmission image. (B) Fluorescent image of the cell after nuclear staining by Hoechst 33258. (C) Differential interference contrast micrograph of the cell. Scale bar: 10 μm.93 Reproduced by permission of The American Chemical Society.
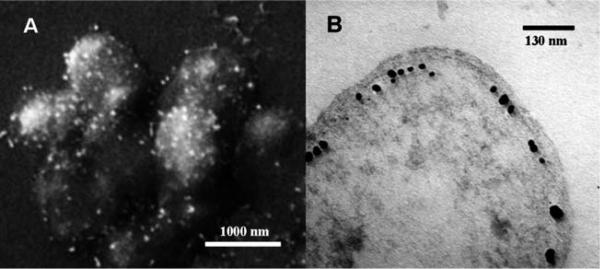
Except for collecting Raman signal from intracellular molecules by fluid phase uptake of SERS active nanoparticle substrates into cells, characteristic Raman information can also be detected on the outer wall of cells. Currently such measurement is critically important in the detection of one-celled creatures such as bacteria and yeast cells as internalization of nanoparticles into these small cells is difficult. Sujith et al. detected the cell wall of living yeast cells by mixing them together with Ag nanoparticles. The nanoparticles aggregated and deposited on the cell wall and enabled SERS detection.98 Similar detection performed on bacterial cells coated with Au and Ag nanoparticles has been reported by Kahraman and co-workers (Fig. 4a).96 Besides coating nanoparticles onto cell surface, Raman measurement can also be done by directly placing cells onto a macro-scale SERS active solid structure. Recently, in situ reduction of metal ions has been reported to introduce metallic nanoparticles directly inside bacteria, making it possible to analyze intracellular components of bacteria as well (Fig. 4b).97
Fig. 4.
(A) SEM image of E. coli coated with Au nanoparticles.96Reproduced by permission of Springer. (B) TEM image of a G. sulfurreducens bacterial cell with intracellular Au deposits.97 Reproduced by permission of The American Chemical Society.
4.3 Imaging and analysis of tissues based on SERS
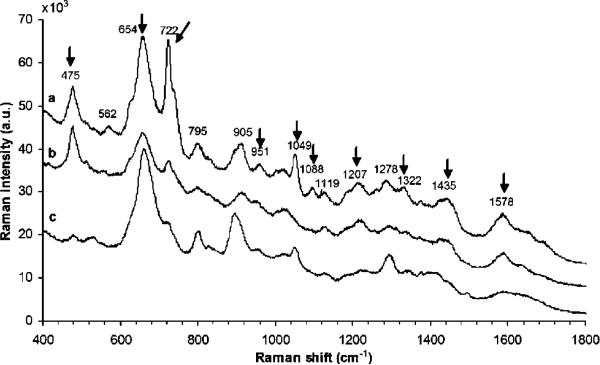
Raman spectra of tissues can be obtained without enhancement because tissue is more condensed than cell. However, SERS can quench the fluorescent background and shorten the signal acquisition time. Moreover, the preparation of tissue sample is simpler than cell experiment. The SERS substrates can either be dropped on tissue sections or be mixed with tissue fragments. Since tissue samples are generally gathered for clinical/medical purpose, SERS studies of tissues are mainly focused on optical diagnosis. For example, SERS differentiation of normal brain tissue and tumors has been performed recently. Frozen tissue samples collected from hospitals are crashed and mixed with Ag nanoparticles before the SERS detection. The obtained spectra show significant spectral differences which can be used to distinguish tumors from healthy tissue regions (Fig. 5).99 Some previous work in SERS detection and analysis of biomedical samples are listed in Table 2.
Fig. 5.
SERS spectra of the tissue collected from a patient with meningioma, (a) tumor, (b) peripheral, and (c) healthy tissue.99 Reproduced by permission of The Optical Society of America.
Table 2.
SERS detection of biomedical samples
| Samples | Substrates | Detection limits | Ref. |
|---|---|---|---|
| Biomolecules | |||
| Calf-thymus DNA and herring sperm DNA | Ag NPs | N.A. | 100 |
| Insulin | Adaptive silver films | N.A. | 101 |
| Adenine, adenine phosphate and polyadenine | Films of Au nanoshells on quartz and silicon | N.A. | 102 |
| Adenine | Au electrode | 1 × 10–14 M | 103 |
| Ag NPs | Single molecule | 10 | |
| Pterins | Ag NPs | 1 × 10⁻⁹ M | 104 |
| Lysozyme, ribonuclease-B, bovin serum albumin and myoglobin | Au nanograin-aggregate array | N.A. | 87 |
| Aromatic peptides | Au nanoshells | N.A. | 105 |
| Hairpin ribozyme RNA | Ag NPs | N.A. | 106 |
| Adenosine triphosphate, hemoglobin and myoglobin | Ag–Au core-shell NPs | N.A. | 107 |
| Albumins | Ag NPs | N.A. | 108 |
| Lysozyme | Au NPs and Ag NPs | N.A. | 109 |
| Cytochrome c | Anodized Al oxide films | N.A. | 110 |
| Au film covered Ag electrode | N.A. | 91 | |
| Phenylalanine and antifreeze glycoprotein | Ag-coated porous substrate | N.A. | 111 |
| Cytochrome c and heme protein | Ag tip | N.A. | 112 |
| Herring sperm DNA | Ag NPs | N.A. | 88 |
| Glucose | Alkanethiol modified Ag substrate | N.A. | 113,114 |
| Human integrins | Ag NPs | 3 × 10⁻⁸ M | 115 |
| Phospholipids | Ag NPs | N.A. | 116 |
| Cells | |||
| HT29 intestinal epithelial cells | Au NPs | Subcellular level | 92 |
| E. coli and B. cereus | Metalized poly(p-xylylene) films | Single cell | 117,118 |
| Thermophilic bacteria | Ag NPs | N.A. | |
| HeLa cells | Au NPs coated glass pipettes | Subcellular level | 95 |
| Peptide modified Au NPs | Subcellular level | 93 | |
| Multispecies biofilm | Ag NPs | N.A. | 119 |
| Spores of Bacillus subtilis | Anodized Al oxide films | N.A. | 110 |
| HSC3 oral squamous carcinoma cell | Au nanorods | Subcellular level | 120 |
| E. coli | Antibody conjugated Ag NPs | N.A. | 121 |
| G. sulfurreducens | Au NPs | N.A. | 97 |
| E. coli and S. cohnii | Au NPs and Ag NPs | N.A. | 96 |
| Human dermal keratinocytes | Ag coated AFM tip | N.A. | 122 |
| Yeast cells W303-1A | Ag NPs | Subcellular level | 98 |
| Macrophage cells | Au NPs | Subcellular level | 123 |
| T. asperellum | Au NPs and Ag NPs | N.A. | 124 |
| C666 nasopharyngeal and A431 epidermoid carcinoma cells | Ag NPs | Subcellular level | 125 |
| Mitochondria isolated from A549 lung cancer cells | Au NPs | N.A. | 126 |
| Tissues | |||
| Colon adenocarcinoma tissue and normal colon epithelial tissue | Ag NPs | N.A. | 127 |
| Normal brain tissue and tumor tissue | Ag NPs | N.A. | 99 |
| Cancerous and normal nasopharyngeal tissues | Au NPs | N.A. | 128 |
| Prostate cancer tissue | Silica-encapsulated SAMs on Au/Ag nanoshells | N.A. | 129 |
| Rat tissues (heart, lung, liver, kidney, spleen, testes and brain) | Ag NPs | N.A. | 130 |
4.4 Bio-imaging and detection using SERS tags
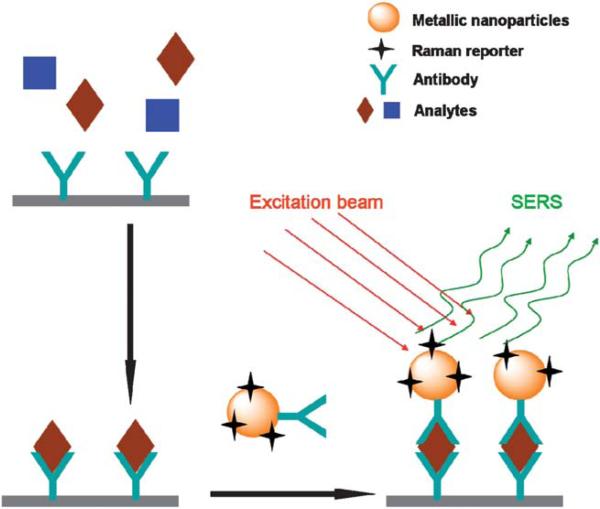
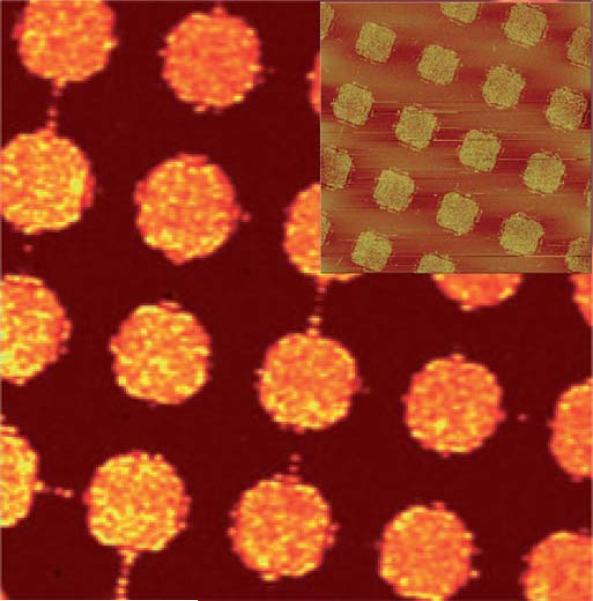
The enhancement of SERS is analyte-dependent. SERS active molecules such as cresyl violet, 4-mercaptobenzoic acid and Rhodamine compounds can provide high intensity SERS signal at a very low concentration. But most of the natural bio-components are not SERS active. It's very difficult to detect them in a complex biological environment which contains large amount of different biomolecules. The SERS active molecular reporter can be used to highlight the target analytes by their high SERS intensity and spectral specificity. Fig. 6 shows a typical strategy of detection of antibody-specific biomolecules based on SERS tags. Metallic nanoparticles are modified with Raman reporter molecules. The metallic surface can be conjugated covalently to mercaptoacetic acid (MAA), which can be easily coupled to the amine group of many compounds such as Rhodamine and cresyl violet (CV). Su and co-workers have reported the synthesis of composite organic-inorganic nanoparticles (COINs) by aggregating the nanoparticles with organic molecules, which allows the incorporation of the organic Raman reporter into COINs to produce SERS spectra. They demonstrated multi-detection capability of COINs by using different Raman reporters for different proteins.131 Sun et al. developed DNA micro-pattern imaging method by using Raman reporter labeled gold nanoparticles and SERS (Fig. 7). This study proved again that SERS is a powerful optical readout method for array based miniaturized systems.132 SERS is also capable of multi-detection for nucleic acids. For example, the multiplex detection of viral DNA or RNA using dye-labeled Au nanoparticles was carried out by Mirkin's group. They used different reporters to label different oligonucleotides to distinguish the complementary oligonucleotide sequences by hybridization reactions.133 SERRS has also been used for DNA detection based on the signal from Raman reporters. This research field has been reviewed previously134 and will not be discussed here.
Fig. 6.
Illustration of a typical SERS detection of antibody-specific analytes.
Fig. 7.
A 50 × 50 μm SERS image of DNA micro-patterns using Raman band from the labeled reporter at 1641 cm–1. The inset shows the AFM of the nanoparticle conjugated patterns.132 Reproduced by permission of The Royal Society of Chemistry.
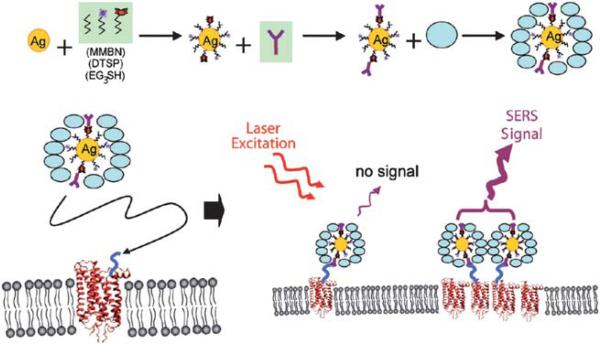
The Raman scattering in SERS only takes place on the surface of metallic substrate. Therefore, intracellular SERS signal can only be obtained in the position where the metallic nanoparticles meet the analyte molecules. Some of the nanoparticles may be blind because the native components inside cells are not homogeneous. That means the distribution of metallic nanoparticles in a cell can not be determined even if SERS mapping is obtained. SERS tags can be used to highlight themselves in the cells by their characteristic Raman fingerprint, like the role of fluorescent reagents or quantum dots, which are used extensively in cellular imaging and detection.136 Nithipatikom et al. detected enzymes in cells by using modified Ag nanoparticles. In their study, antibodies were used to conjugate enzymes or receptors of interest with Raman labels before SERS detection of the cells (Fig. 8).135 This research shows that multiple detection of different components in a single cell could be realized by using SERS tags. Aggregation of cell surface receptors could be related to their biological signaling. For example the heart beating of mammalian is controlled by the β2-adrenergic receptors clusters. Recently, detection of β2-adrenergic receptors clustering by SERS of antibody functionalized Ag nanoparticles has been reported. In this work, an isolated nanoparticle didn't enhance the Raman signal of the modified label molecules because the electromagnetic field generated by a single particle is too weak (Fig. 9). The characterized Raman bands obtained in the SERS imaging of a cell only highlighted the position of β2-adrenergic receptor aggregations.137 This technique can be used to investigate the aggregation of other receptors and explore their distribution on cell surfaces.
Fig. 8.
SERS detection of Angiotensin I receptor in bovine adrenal zona glomerulosa cells.135Reproduced by permission of Elsevier.
Fig. 9.
Schematic depiction of the fabrication of functionalized Ag nanoparticles and particles binding to the cell surface receptors via the covalently immobilized antibody.137 Reproduced by permission of The American Chemical Society.
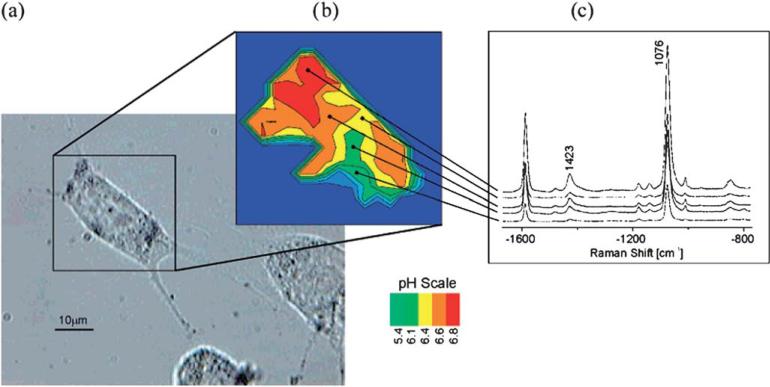
SERS nanotags can be designed as chemical sensors by changing the functional residues. Talley and co-workers developed an intracellular pH sensor based on Ag nanoparticles modified with 4-mercaptobenzoic acid, which yields different Raman signal under different pH values. Then the modified nanoparticles were added into cells by passive uptake before the measurement. SERS image of the cells shows that the nanoparticle sensors with robust SERS signal were incorporated into living cells and the pH value of the micro-environment is below 6, indicating that the particles are encapsulated in lysosome.138 Kneipp et al. demonstrated their intracellular pH sensing based on 4-mercaptobenzoic acid and Au nanoaggregates. They use the ratio of Raman band at 1423 and 1076 cm–1 as a function of pH. Fig. 10 shows the pH imaging of a single live cell using a SERS nanosensor.139 2-aminobenzenethiol is a widely used Raman reporter which has similar molecular structure as mercaptobenzoic acid, and also can be used for pH sensing. For example, Wang et al. reported the use of 2-aminobenzenethiol functionalized Ag nanoparticles for SERS detection of living cells at different pH values. The pH-dependent SERS spectra can be used to detect pH value of the surrounding over the range of 3.0–8.0.140
Fig. 10.
(a) White light image of the cell after incubation with nanotags. (b) pH mapping of the cell according to the intensity ratios of Raman bands at 1423 and 1076 cm–1. (c) SERS spectra obtained in endosomal compartments of different pH values.139 Reproduced by permission of The American Chemical Society.
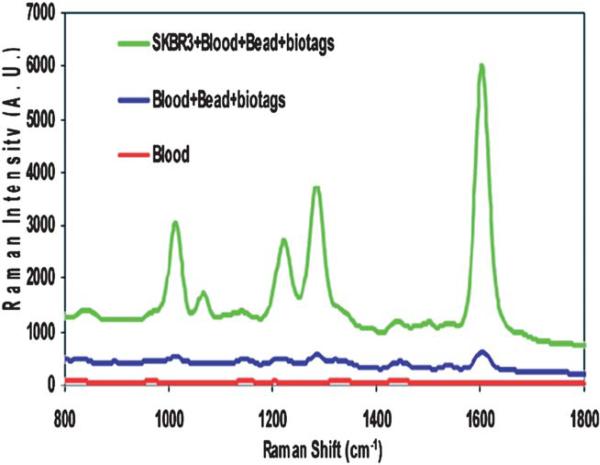
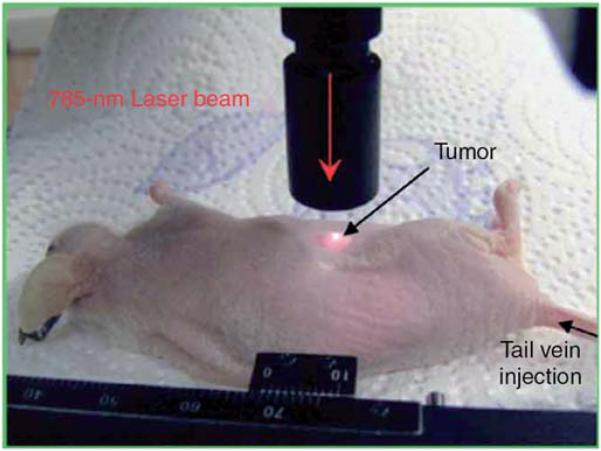
By a more sophisticated nanoparticle engineering process, SERS tags conjugated with antibodies can be used for cancer identification via cultured cells, tissues and even living animals. Sha and coworkers reported the identification of breast cancer cells in blood samples. They combined anti-her2 antibody conjugated SERS tags with epithelial cell-specific antibody functionalized magnetic nanoparticles. Both of these two components can specifically bind to breast cancer cells in a mixed sample of whole blood and cultured SKBr3 cells. Once recognized, the cancer cells are concentrated onto the wall of container tube by applying an external magnetic field. SERS measurement can then be conducted rapidly with good sensitivity (Fig. 11).141 Prostate cancer can be identified by SERS detection of prostate-specific antigen (PSA) on tissue section. The SERS mapping of the tissue section incubated with anti-PSA antibody modified metallic nanoparticles could be a criterion of epithelium and stroma.142 Cancer detection in living animals by using optical method is a challenging task. Qian et al. reported a tumor targeted nanoprobe for in vivo SERS detection. Au nanoparticles modified with Raman reporter molecules were stabilized by thiol-modified polyethylene glycols. These PEGylated SERS nanotags were even more sensitive than quantum dots with scattering in near-infrared region. When single-chain variable fragment (ScFv) antibodies were conjugated, the nanoparticles were able to target epidermal growth factor receptors. The resultant nanoprobes were then injected into nude mice bearing human head-and-neck squamous cell carcinoma (Tu686) xeno-graft tumor for in vivo SERS detection (Fig. 12).143 Recently, possibility of SERS detection in deep tissue was demonstrated by Stone et al. They injected the Raman reporter modified silver nanoparticles into thick (15–25 mm) pig tissue and collected SERRS signal on the opposite side of the samples.144 This work has the potential to open applications in noninvasive SERS biomedical diagnoses. The samples and substrates of bio-imaging and detection by using SERS tags are summarized in Table 3.
Fig. 11.
Detection of SKBR3 cancer cells spiked into blood.141 Reproduced by permission of The American Chemical Society.
Fig. 12.
In vivo cancer targeting and SERS detection by using antibody conjugated Au nanoparticles.143 Reproduced by permission of The Nature Publishing Group.
Table 3.
Bio-imaging and detection using SERS tags
| Samples | Substrates | Raman reporters | Detection limits | Ref. |
|---|---|---|---|---|
| Biomolecules | ||||
| Interleukin-2 (IL-2) and IL-8 proteins | Composite organic- inorganic NPs | 8-Azaadenine and benzoyladenine | N.A. | 131 |
| DNA pattern | Ag NPs | Benzotriazole azo dye | N.A. | 132 |
| Virus DNA and RNA | Ag stained/enhanced Au NPs | Cy3, TAMRA, Texas red, Cy3.5, Rhodamine 6G, Cy5 | 2 × 10–14 M | 133 |
| Mouse-IgG (anti-insulin) | Ag NPs | Azoaniline | 0.158 ngmL–1 | 145 |
| Glutathione | Ag NPs | Rhodamine 6G, crystal violet, and 5,5′-dichloro-3,3′-disulfopropyl thiacyanine | 1 × 10⁻⁶ M | 146 |
| Recombinant human interleukin-2 | Ag NPs | 8-Azaadenine and N-benzoyladenine | N.A. | 131 |
| Human IgG | Au nanorods embedded silica particles | 4-Aminothiophenol | 0.1 ng mL–1 | 147 |
| Biotin | Silica-Ag-magnetic beads | Benzenethiol, 4-mercaptotoluene, 2-naphthalenethiol and 4-aminothiophenol | N.A. | 148 |
| Cells | ||||
| Bronchioalveolar stem cells | Ag-doped silica NPs | Mercaptotoluene, benzenethiol and naphthalenethiol | Single cell | 149 |
| Magnetic-SERS dots with Ag NPs | 4-Methylbenzenethiol and benzenethiol | N.A. | 150 | |
| MCF-7 mammary gland adenocarcinoma cells | Au nanorods | 4-Mercaptopyridine | Subcellular level | 151 |
| Hollow Au nanospheres | Crystal violet | Subcellular level | 152 | |
| Ag NPs embedded silica spheres | 4-Mercaptotoluene and 2-naphthalenethiol | Subcellular level | 153 | |
| Bovine adrenal zona glomerulosa | Ag NPs | Cresyl violet | Subcellular level | 135 |
| Human hepatoma cells | Ag NPs | Carborane | Subcellular level | 154 |
| Mouse fibroblast 3T3 cells | Au NPs | Rose Bengal and crystal violet | Subcellular level | 155 |
| Au NPs | 4-Mercaptobenzoic acid | Subcellular level | 139 | |
| Human mammary epithelial cells and PC-3 prostate cancer cells | Ag coated optical fibers | 4-Mercaptobenzoic acid | Subcellular level | 156 |
| R3327 rat prostate carcinoma cells | Au NPs and Ag NPs | Indocyanine green | Subcellular level | 157 |
| SKBR3 breast cancer cells | silica coated Au NPs | N.A. | 10 cells mL–1 | 141 |
| HeLa cells | PVP coated Ag NPs | 4,4′-Bipyridine and 4-mercaptobenzoic acid | N.A. | 158 |
| Macrophage cells | Au nanoflower | Rhodamine B | N.A. | 159 |
| H9c2 cardiac myocytes | Ag NPs | 4-(Mercaptomethyl)benzonitrile | Subcellular level | 137 |
| U937 monocytic leukemia cells | Ag NPs | Basic fuchsin | N.A. | 160 |
| MCF10 epithelial cells | Au NPs | Dinitrophenol derivative | N.A. | 161 |
| MIAPaCa-2 pancreas carcinoma cells | Ag NPs | 2-Aminothiophenol | Single cell | 140 |
| HEK 293 embryonic kidney cells | Ag NPs | Brilliant green | Subcellular level | 162 |
| Chinese hamster ovary cells | Ag NPs | Cresyl violet | Subcellular level | 163,164 |
| Ag NPs | 4-Mercaptobenzoic acid | Subcellular level | 138 | |
| Lymphocyte | Au NPs | Rhodamine 6G | Subcellular level | 165 |
| Tissues | ||||
| Prostate tissue | Au nanoshells | 5,5′-Dithiobis(succinimidyl-2-nitrobenzoate) | N.A. | 166 |
| Ag NPs | N.A. | N.A. | 142 | |
| Au nanoshells | 5,5′-Dithiobis(2-nitrobenzoic acid) | N.A. | 167 |
5. Conclusion
This article introduces the application of SERS in biomedical research. Generally, SERS enables biomedical detection in three ways: First, an analyte locates directly on the metallic nanostructure surface. A SERS spectrum originated form the analyte molecules can be used to study the structural changes due to various reactions. Second, the metallic nanostructures enhance the signal from Raman reporter molecules which detects a specific analyte. The SERS spectrum obtained here is a code or fingerprint without any structural information of the analyte itself. Third, the reporter molecules modified on the SERS substrates respond to the chemical surroundings. In the past decade, SERS has become a well established optical detection tool in these three ways including the studies of drug-biomolecule interaction, intracellular targeted probing, cancer-marker identification, and chemical environment sensing. These studies have confirmed that SERS can provide molecular structural information in addition to qualitative analysis, making it a more excellent analytical method for biomedical samples than other optical techniques such as fluorescence.
However, the conflict between reproducibility and sensitivity is a stubborn disadvantage of SERS, which has not been overcome yet. The problem is that the SERS active metallic nanostructures have poor structural reproducibility. New substrates for SERS enhancement should be developed to solve this problem. The breakthrough of the fabrication of novel metallic nanostructures will open up great opportunities in both fundamental theory and application of SERS.
Moreover, SERS is dependent on the nanostructures of the substrates and the biological samples such as cells and tissues are intrinsically inhomogeneous. As a result, any inhomogeneous distribution of the SERS probes superimposed on the inhomogenous molecular distribution on the biological samples will reduce the accuracy of the SERS-based bio-imaging, detection and analysis. Therefore, controlling the spatial localization of the nanostructures is another challenge in the biomedical application of SERS. Ideally, SERS measurements on the biological samples need to obtain enhancements from components of interest and get rid of the interference from the complex environment of the samples. Developing targeted nanoprobes with controllable distribution on the biological samples should be the most promising solution and is also a daunting challenge. Availability of such nanoprobes should no doubt facilitate SERS based bio-imaging, detection and analysis.
Acknowledgements
We thank the National Science Foundation (DMR-0847758, CBET-0854414, CBET-0854465), National Institutes of Health (R21EB009909-01A1, R03AR056848-01, R01HL092526-01A2), and Oklahoma Center for the Advancement of Science and Technology (HR06-161S) for the financial support.
Biography
 Chuanbin Mao received his undergraduate degree and PhD from Northeastern University in China. He then worked at Tsinghua University, first as a postdoctoral researcher and lecturer and then as an associate professor. After a short stay at the University of Tennessee, he took a postdoctoral position at the University of Texas at Austin in 2000. He became an assistant professor at the University of Oklahoma in 2005. He was promoted to associated professor and named an Edith Kinney Gaylord presidential professor in 2010 by the same University. His research interests include biotemplated nanosynthesis, biosensing and bioimaging, bionanotechnology, nanobiology, and nanomedicine.
References
- 1.Raman CV, Krishnan KS. Nature. 1928;121:501–502. [Google Scholar]
- 2.Haynes CL, McFarland AD, Van Duyne RP. Anal. Chem. 2005;77:338A–346A. [Google Scholar]
- 3.Kneipp K, Kneipp H, Itzkan I, Dasari RR, Feld MS. J. Phys.: Condens. Matter. 2002;14:R597–R624. [Google Scholar]
- 4.Fleischmann M, Hendra PJ, McQuillan AJ. Chem. Phys. Lett. 1974;26:163–166. [Google Scholar]
- 5.Jeanmaire DL, van Duyne RP. J. Electroanal. Chem. 1977;84:1–20. [Google Scholar]
- 6.Albrecht MG, Creighton JA. J. Am. Chem. Soc. 1977;99:5215–5217. [Google Scholar]
- 7.Kneipp K, Wang Y, Kneipp H, Itzkan I, Dasari RR, Feld MS. Phys. Rev. Lett. 1996;76:2444–2447. doi: 10.1103/PhysRevLett.76.2444. [DOI] [PubMed] [Google Scholar]
- 8.Nie SM, Emery SR. Science. 1997;275:1102–1106. doi: 10.1126/science.275.5303.1102. [DOI] [PubMed] [Google Scholar]
- 9.Kneipp K, Wang Y, Kneipp H, Perelman LT, Itzkan I, Dasari R, Feld MS. Phys. Rev. Lett. 1997;78:1667–1670. [Google Scholar]
- 10.Kneipp K, Kneipp H, Kartha VB, Manoharan R, Deinum G, Itzkan I, Dasari RR, Feld MS. Phys. Rev. E: Stat. Phys., Plasmas, Fluids, Relat. Interdiscip. Top. 1998;57:R6281–R6284. [Google Scholar]
- 11.Xu HX, Bjerneld EJ, Kall M, Borjesson L. Phys. Rev. Lett. 1999;83:4357–4360. [Google Scholar]
- 12.Michaels AM, Jiang J, Brus L. J. Phys. Chem. B. 2000;104:11965–11971. [Google Scholar]
- 13.Jiang J, Bosnick K, Maillard M, Brus L. J. Phys. Chem. B. 2003;107:9964–9972. [Google Scholar]
- 14.Campion A, Kambhampati P. Chem. Soc. Rev. 1998;27:241–250. [Google Scholar]
- 15.Otto A. J. Raman Spectrosc. 2005;36:497–509. [Google Scholar]
- 16.Schatz GC. Theochem–J. Mol. Struc. 2001;573:73–80. [Google Scholar]
- 17.Jensen T, Kelly L, Lazarides A, Schatz GC. J. Cluster Sci. 1999;10:295–317. [Google Scholar]
- 18.Xu H, Wang XH, Persson MP, Xu HQ, Kall M, Johansson P. Phys. Rev. Lett. 2004;93:243002. doi: 10.1103/PhysRevLett.93.243002. [DOI] [PubMed] [Google Scholar]
- 19.Xu HX. Appl. Phys. Lett. 2004;85:5980–5982. [Google Scholar]
- 20.Hao E, Schatz GC. J. Chem. Phys. 2004;120:357–366. doi: 10.1063/1.1629280. [DOI] [PubMed] [Google Scholar]
- 21.Haynes CL, Van Duyne RP. J. Phys. Chem. B. 2001;105:5599–5611. [Google Scholar]
- 22.Li X, Gewirth AA. J. Am. Chem. Soc. 2003;125:11674–11683. doi: 10.1021/ja0363112. [DOI] [PubMed] [Google Scholar]
- 23.Delgado JM, Blanco R, Orts JM, Perez JM, Rodes A. J. Phys. Chem. C. 2009;113:989–1000. [Google Scholar]
- 24.Nie SM, Emory SR. Abstr. Pap. Am. Chem. Soc. 1997;213:177. [Google Scholar]
- 25.Gu BH, Ruan CM, Wang W. Appl. Spectrosc. 2009;63:98–102. doi: 10.1366/000370209787169894. [DOI] [PubMed] [Google Scholar]
- 26.Jerez-Rozo JI, Primera-Pedrozo OM, Barreto-Caban MA, Hernandez-Rivera SP. IEEE Sens. J. 2008;8:974–982. [Google Scholar]
- 27.Bao LL, Mahurin SM, Haire RG, Dai S. Anal. Chem. 2003;75:6614–6620. doi: 10.1021/ac034791+. [DOI] [PubMed] [Google Scholar]
- 28.Guo SJ, Li J, Ren W, Wen D, Dong SJ, Wang EK. Chem. Mater. 2009;21:2247–2257. [Google Scholar]
- 29.Han RB, Wu H, Wan CL, Pan W. Scr. Mater. 2008;59:1047–1050. [Google Scholar]
- 30.Ren B, Liu GK, Lian XB, Yang ZL, Tian ZQ. Anal. Bioanal. Chem. 2007;388:29–45. doi: 10.1007/s00216-007-1141-2. [DOI] [PubMed] [Google Scholar]
- 31.Cui L, Wu DY, Wang A, Ren B, Tian ZQ. J. Phys. Chem. C. 2010;114:16588–16595. [Google Scholar]
- 32.Andrade GFS, Temperini MLA. J. Phys. Chem. C. 2007;111:13821–13830. [Google Scholar]
- 33.Yang LB, Jiang X, Ruan WD, Zhao B, Xu WQ, Lombardi JR. J. Raman Spectrosc. 2009;40:2004–2008. [Google Scholar]
- 34.Cui L, Wang A, Wu DY, Ren B, Tian ZQ. J. Phys. Chem. C. 2008;112:17618–17624. [Google Scholar]
- 35.Liu YC. J. Phys. Chem. B. 2004;108:2948–2952. [Google Scholar]
- 36.Liu YC, Wang CC. J. Phys. Chem. B. 2005;109:5779–5782. doi: 10.1021/jp045313l. [DOI] [PubMed] [Google Scholar]
- 37.Mrozek MF, Weaver MJ. J. Phys. Chem. B. 2001;105:8931–8937. [Google Scholar]
- 38.Mrozek MF, Wasileski SA, Weaver MJ. J. Am. Chem. Soc. 2001;123:12817–12825. doi: 10.1021/ja010049k. [DOI] [PubMed] [Google Scholar]
- 39.Podstawka E, Niaura G. J. Phys. Chem. B. 2009;113:10974–10983. doi: 10.1021/jp903847c. [DOI] [PubMed] [Google Scholar]
- 40.Chu YP, Chen S, Zheng JF, Li ZL. J. Raman Spectrosc. 2009;40:229–233. [Google Scholar]
- 41.Roguska A, Kudelski A, Pisarek M, Lewandowska M, Kurzydlowski KJ, Janik-Czachor M. Surf. Sci. 2009;603:2820–2824. [Google Scholar]
- 42.Podstawka E. Biopolymers. 2008;89:980–992. doi: 10.1002/bip.21047. [DOI] [PubMed] [Google Scholar]
- 43.Hou XM, Fang Y. Spectrochim. Acta, Part A. 2008;69:1140–1145. doi: 10.1016/j.saa.2007.06.033. [DOI] [PubMed] [Google Scholar]
- 44.Teslova T, Corredor C, Livingstone R, Spataru T, Birke RL, Lombardi JR, Canamares MV, Leona M. J. Raman Spectrosc. 2007;38:802–818. [Google Scholar]
- 45.Wen R, Fang Y. J. Colloid Interface Sci. 2005;292:469–475. doi: 10.1016/j.jcis.2005.05.091. [DOI] [PubMed] [Google Scholar]
- 46.Podstawka E, Kudelski A, Drag M, Oleksyszyn J, Proniewicz LM. J. Raman Spectrosc. 2009;40:1578–1584. [Google Scholar]
- 47.Podstawka E, Kudelski A, Olszewski TK, Boduszek B. J. Phys. Chem. B. 2009;113:10035–10042. doi: 10.1021/jp902328j. [DOI] [PubMed] [Google Scholar]
- 48.Chen YC, Young RJ, Macpherson JV, Wilson NR. J. Phys. Chem. C. 2007;111:16167–16173. [Google Scholar]
- 49.Li XY, Huang QJ, Petrov VI, Xie YT, Luo I, Yu XY, Yan YJ. J. Raman Spectrosc. 2005;36:555–573. [Google Scholar]
- 50.Goulet PJG, Aroca RF. Can. J. Anal. Sci. Spectrosc. 2007;52:172–177. [Google Scholar]
- 51.Liu YC, Yu CC, Wang CC, Juang LC. Chem. Phys. Lett. 2006;420:245–249. [Google Scholar]
- 52.Luo LB, Chen LM, Zhang ML, He ZB, Zhang WF, Yuan GD, Zhang WJ, Lee ST. J. Phys. Chem. C. 2009;113:9191–9196. [Google Scholar]
- 53.Li Y, Lu GW, Wu XF, Shi GQ. J. Phys. Chem. B. 2006;110:24585–24592. doi: 10.1021/jp0638787. [DOI] [PubMed] [Google Scholar]
- 54.Kim SM, Zhang W, Cunningham BT. Opt. Express. 2010;18:4300–4309. doi: 10.1364/OE.18.004300. [DOI] [PubMed] [Google Scholar]
- 55.Kostovski G, White DJ, Mitchell A, Austin MW, Stoddart PR. Biosens. Bioelectron. 2009;24:1531–1535. doi: 10.1016/j.bios.2008.10.016. [DOI] [PubMed] [Google Scholar]
- 56.Oran JM, Hinde RJ, Abu Hatab N, Retterer ST, Sepaniak MJ. J. Raman Spectrosc. 2008;39:1811–1820. [Google Scholar]
- 57.Kho KW, Qing KZM, Shen ZX, Ahmad IB, Lim SSC, Mhaisalkar S, White TJ, Watt F, Soo KC, Olivo M. J. Biomed. Opt. 2008;13:054026. doi: 10.1117/1.2976140. [DOI] [PubMed] [Google Scholar]
- 58.Abu Hatab NA, Oran JM, Sepaniak MJ. ACS Nano. 2008;2:377–385. doi: 10.1021/nn7003487. [DOI] [PubMed] [Google Scholar]
- 59.Sawai Y, Takimoto B, Nabika H, Ajito K, Murakoshi K. J. Am. Chem. Soc. 2007;129:1658–1662. doi: 10.1021/ja067034c. [DOI] [PubMed] [Google Scholar]
- 60.Schierhorn M, Lee SJ, Boettcher SW, Stucky GD, Moskovits M. Adv. Mater. 2006;18:2829. [Google Scholar]
- 61.Ji N, Ruan WD, Wang CX, Lu ZC, Zhao B. Langmuir. 2009;25:11869–11873. doi: 10.1021/la901521j. [DOI] [PubMed] [Google Scholar]
- 62.Xu P, Mack NH, Jeon S-H, Doorn SK, Han X, Wang H-L. Langmuir. 2010;26:8882–8886. doi: 10.1021/la904617p. [DOI] [PubMed] [Google Scholar]
- 63.Kim K, Lee YM, Lee HB, Shin KS. ACS Appl. Mater. Interfaces. 2009;1:2174–2180. doi: 10.1021/am9003396. [DOI] [PubMed] [Google Scholar]
- 64.Guo S, Dong S, Wang E. Chem.–Eur. J. 2009;15:2416–2424. doi: 10.1002/chem.200801942. [DOI] [PubMed] [Google Scholar]
- 65.Podstawka E, Proniewicz LM. J. Phys. Chem. B. 2009;113:4978–4985. doi: 10.1021/jp8110716. [DOI] [PubMed] [Google Scholar]
- 66.Garcia-Ramos JV, Domingo C, Guerrini L, Leyton P, Campos-Vallette M, Sanchez-Cortes S. Can. J. Anal. Sci. Spectrosc. 2007;52:186–197. [Google Scholar]
- 67.Seballos L, Olson TY, Zhang JZ. J. Chem. Phys. 2006:125. doi: 10.1063/1.2404648. [DOI] [PubMed] [Google Scholar]
- 68.Guerrini L, Garcia-Ramos JV, Domingo C, Sanchez-Cortes S. Langmuir. 2006;22:10924–10926. doi: 10.1021/la062266a. [DOI] [PubMed] [Google Scholar]
- 69.Lopez-Tocon I, Otero JC, Arenas JF, Garcia-Ramos JV, Sanchez-Cortes S. Langmuir. 2010;26:6977–6981. doi: 10.1021/la904204s. [DOI] [PubMed] [Google Scholar]
- 70.Muniz-Miranda M, Pergolese B, Bigotto A. Phys. Chem. Chem. Phys. 2010;12:1145–1151. doi: 10.1039/b913014d. [DOI] [PubMed] [Google Scholar]
- 71.Kim S, Joo SW. Vib. Spectrosc. 2005;39:74–80. [Google Scholar]
- 72.Kim K, Ryoo H, Lee YM, Shin KS. J. Colloid Interface Sci. 2010;342:479–484. doi: 10.1016/j.jcis.2009.10.019. [DOI] [PubMed] [Google Scholar]
- 73.Blakey I, Schiller TL, Merican Z, Fredericks PM. Langmuir. 2010;26:692–701. doi: 10.1021/la9023162. [DOI] [PubMed] [Google Scholar]
- 74.Rodriguez-Lorenzo L, Alvarez-Puebla RA, de Abajo FJG, Liz-Marzan LM. J. Phys. Chem. C. 2010;114:7336–7340. [Google Scholar]
- 75.Pande S, Ghosh SK, Praharaj S, Panigrahi S, Basu S, Jana S, Pal A, Tsukuda T, Pal T. J. Phys. Chem. C. 2007;111:10806–10813. doi: 10.1021/jp065740u. [DOI] [PubMed] [Google Scholar]
- 76.Fernandez-Lopez C, Mateo-Mateo C, Alvarez-Puebla RA, Perez-Juste J, Pastoriza-Santos I, Liz-Marzan LM. Langmuir. 2009;25:13894–13899. doi: 10.1021/la9016454. [DOI] [PubMed] [Google Scholar]
- 77.Li WB, Guo YY, Zhang P. J. Phys. Chem. C. 2010;114:7263–7268. doi: 10.1021/jp908160m. [DOI] [PMC free article] [PubMed] [Google Scholar]
- 78.Ward DR, Grady NK, Levin CS, Halas NJ, Wu YP, Nordlander P, Natelson D. Nano Lett. 2007;7:1396–1400. doi: 10.1021/nl070625w. [DOI] [PubMed] [Google Scholar]
- 79.Mahajan S, Cole RM, Soares BF, Pelfrey SH, Russell AE, Baumberg JJ, Bartlett PN. J. Phys. Chem. C. 2009;113:9284–9289. [Google Scholar]
- 80.Mahajan S, Baumberg JJ, Russell AE, Bartlett PN. Phys. Chem. Chem. Phys. 2007;9:6016–6020. doi: 10.1039/b712144j. [DOI] [PubMed] [Google Scholar]
- 81.Li JF, Yang ZL, Ren B, Liu GK, Fang PP, Jiang YX, Wu DY, Tian ZQ. Langmuir. 2006;22:10372–10379. doi: 10.1021/la061366d. [DOI] [PubMed] [Google Scholar]
- 82.Gu W, Fan XM, Yao JL, Ren B, Gu RA, Tian ZQ. J. Raman Spectrosc. 2009;40:405–410. [Google Scholar]
- 83.Rycenga M, Camargo PHC, Li W, Moran CH, Xia Y. J. Phys. Chem. Lett. 2010;1:696–703. doi: 10.1021/jz900286a. [DOI] [PMC free article] [PubMed] [Google Scholar]
- 84.Ichimura T, Fujii S, Verma P, Yano T, Inouye Y, Kawata S. Phys. Rev. Lett. 2009:102. doi: 10.1103/PhysRevLett.102.186101. [DOI] [PubMed] [Google Scholar]
- 85.Min Q, Santos MJL, Girotto EM, Brolo AG, Gordon R. J. Phys. Chem. C. 2008;112:15098–15101. [Google Scholar]
- 86.Cho H, Lee B, Liu GL, Agarwal A, Lee LP. Lab Chip. 2009;9:3360–3363. doi: 10.1039/b912076a. [DOI] [PubMed] [Google Scholar]
- 87.Das G, Mecarini F, Gentile F, De Angelis F, Kumar HGM, Candeloro P, Liberale C, Cuda G, Di Fabrizio E. Biosens. Bioelectron. 2009;24:1693–1699. doi: 10.1016/j.bios.2008.08.050. [DOI] [PubMed] [Google Scholar]
- 88.Xie W, Ye Y, Shen AG, Zhou L, Lou ZW, Wang XH, Hu JM. Vib. Spectrosc. 2008;47:119–123. [Google Scholar]
- 89.Ye Y, Hu JM, He L, Zeng Y. Vib. Spectrosc. 1999;20:1–4. [Google Scholar]
- 90.Murgida DH, Hildebrandt P. Chem. Soc. Rev. 2008;37:937–945. doi: 10.1039/b705976k. [DOI] [PubMed] [Google Scholar]
- 91.Feng JJ, Gernert U, Sezer M, Kuhlmann U, Murgida DH, David C, Richter M, Knorr A, Hildebrandt P, Weidinger IM. Nano Lett. 2009;9:298–303. doi: 10.1021/nl802934u. [DOI] [PubMed] [Google Scholar]
- 92.Kneipp K, Haka AS, Kneipp H, Badizadegan K, Yoshizawa N, Boone C, Shafer-Peltier KE, Motz JT, Dasari RR, Feld MS. Appl. Spectrosc. 2002;56:150–154. [Google Scholar]
- 93.Xie W, Wang L, Zhang YY, Su L, Shen A, Tan JQ, Hu JM. Bioconjugate Chem. 2009;20:768–773. doi: 10.1021/bc800469g. [DOI] [PubMed] [Google Scholar]
- 94.Tkachenko AG, Xie H, Coleman D, Glomm W, Ryan J, Anderson MF, Franzen S, Feldheim DL. J. Am. Chem. Soc. 2003;125:4700–4701. doi: 10.1021/ja0296935. [DOI] [PubMed] [Google Scholar]
- 95.Vitol EA, Orynbayeva Z, Bouchard MJ, Azizkhan-Clifford J, Friedman G, Gogotsi Y. ACS Nano. 2009;3:3529–3536. doi: 10.1021/nn9010768. [DOI] [PubMed] [Google Scholar]
- 96.Kahraman M, Zamaleeva AI, Fakhrullin RF, Culha M. Anal. Bioanal. Chem. 2009;395:2559–2567. doi: 10.1007/s00216-009-3159-0. [DOI] [PubMed] [Google Scholar]
- 97.Jarvis RM, Law N, Shadi LT, O'Brien P, Lloyd JR, Goodacre R. Anal. Chem. 2008;80:6741–6746. doi: 10.1021/ac800838v. [DOI] [PubMed] [Google Scholar]
- 98.Sujith A, Itoh T, Abe H, Yoshida KI, Kiran MS, Biju V, Ishikawa M. Anal. Bioanal. Chem. 2009;394:1803–1809. doi: 10.1007/s00216-009-2883-9. [DOI] [PubMed] [Google Scholar]
- 99.Aydin O, Altas M, Kahraman M, Bayrak OF, Culha M. Appl. Spectrosc. 2009;63:1095–1100. doi: 10.1366/000370209789553219. [DOI] [PubMed] [Google Scholar]
- 100.Etchegon P, Liem H, Maher RC, Cohen LF, Brown RJC, Hartigan H, Milton MJT, Gallop JC. Chem. Phys. Lett. 2002;366:115–121. [Google Scholar]
- 101.Drachev VP, Thoreson MD, Nashine V, Khaliullin EN, Ben-Amotz D, Davisson VJ, Shalaev VM. J. Raman Spectrosc. 2005;36:648–656. [Google Scholar]
- 102.Kundu J, Neumann O, Janesko BG, Zhang D, Lal S, Barhoumi A, Scuseria GE, Halas NJ. J. Phys. Chem. C. 2009;113:14390–14397. [Google Scholar]
- 103.Cho HS, Lee B, Liu GL, Agarwal A, Lee LP. Lab Chip. 2009;9:3360–3363. doi: 10.1039/b912076a. [DOI] [PubMed] [Google Scholar]
- 104.Stevenson R, Stokes RJ, MacMillan D, Armstrong D, Faulds K, Wadsworth R, Kunuthur S, Suckling CJ, Graham D. Analyst. 2009;134:1561–1564. doi: 10.1039/b905562b. [DOI] [PubMed] [Google Scholar]
- 105.Wei F, Zhang DM, Halas NJ, Hartgerink JD. J. Phys. Chem. B. 2008;112:9158–9164. doi: 10.1021/jp8025732. [DOI] [PubMed] [Google Scholar]
- 106.Percot A, Lecomte S, Vergne J, Maurel MC. Biopolymers. 2009;91:384–390. doi: 10.1002/bip.21143. [DOI] [PubMed] [Google Scholar]
- 107.Kumar GVP, Shruthi S, Vibha B, Reddy BAA, Kundu TK, Narayana C. J. Phys. Chem. C. 2007;111:4388–4392. [Google Scholar]
- 108.Fabriciova G, Sanchez-Cortes S, Garcia-Ramos JV, Miskovsky P. J. Raman Spectrosc. 2004;35:384–389. [Google Scholar]
- 109.Das R, Jagannathan R, Sharan C, Kumar U, Poddar P. J. Phys. Chem. C. 2009;113:21493–21500. [Google Scholar]
- 110.Zhang C, Smirnov AI, Hahn D, Grebel H. Chem. Phys. Lett. 2007;440:239–243. [Google Scholar]
- 111.Pan Z, Morgan SH, Ueda A, Mu R, Cui Y, Guo M, Burger A, Yeh Y. J. Raman Spectrosc. 2005;36:1082–1087. [Google Scholar]
- 112.Yeo BS, Madler S, Schmid T, Zhang WH, Zenobi R. J. Phys. Chem. C. 2008;112:4867–4873. [Google Scholar]
- 113.Shafer-Peltier KE, Haynes CL, Glucksberg MR, Van Duyne RP. J. Am. Chem. Soc. 2003;125:588–593. doi: 10.1021/ja028255v. [DOI] [PubMed] [Google Scholar]
- 114.Haynes CL, Yonzon CR, Zhang XY, Van Duyne RP. J. Raman Spectrosc. 2005;36:471–484. [Google Scholar]
- 115.Chowdhury MH, Gant VA, Trache A, Baldwin A, Meininger GA, Cote GL. J. Biomed. Opt. 2006;11:8. doi: 10.1117/1.2187022. [DOI] [PubMed] [Google Scholar]
- 116.Aoki PHB, Alessio P, Riul A, De Saja Saez JA, Constantino CJL. Anal. Chem. 2010;82:3537–3546. doi: 10.1021/ac902585a. [DOI] [PubMed] [Google Scholar]
- 117.Demirel MC, Kao P, Malvadkar N, Wang H, Gong X, Poss M, Allara DL. Biointerphases. 2009;4:35–41. doi: 10.1116/1.3147962. [DOI] [PubMed] [Google Scholar]
- 118.Kao P, Malvadkar NA, Cetinkaya M, Wang H, Allara DL, Demirel MC. Adv. Mater. 2008;20:3562. [Google Scholar]
- 119.Ivleva NP, Wagner M, Horn H, Niessner R, Haisch C. Anal. Chem. 2008;80:8538–8544. doi: 10.1021/ac801426m. [DOI] [PubMed] [Google Scholar]
- 120.Oyelere AK, Chen PC, Huang XH, El-Sayed IH, El-Sayed MA. Bioconjugate Chem. 2007;18:1490–1497. doi: 10.1021/bc070132i. [DOI] [PubMed] [Google Scholar]
- 121.Naja G, Bouvrette P, Hrapovic S, Luong JHT. Analyst. 2007;132:679–686. doi: 10.1039/b701160a. [DOI] [PubMed] [Google Scholar]
- 122.Bohme R, Richter M, Cialla D, Rosch P, Deckert V, Popp J. J. Raman Spectrosc. 2009;40:1452–1457. [Google Scholar]
- 123.Fujita K, Ishitobi S, Hamada K, Smith NI, Taguchi A, Inouye Y, Kawata S. J. Biomed. Opt. 2009;14:7. doi: 10.1117/1.3119242. [DOI] [PubMed] [Google Scholar]
- 124.Fakhrullin RF, Zamaleeva AI, Morozov MV, Tazetdinova DI, Alimova FK, Hilmutdinov AK, Zhdanov RI, Kahraman M, Culha M. Langmuir. 2009;25:4628–4634. doi: 10.1021/la803871z. [DOI] [PubMed] [Google Scholar]
- 125.Lin JQ, Chen R, Feng SY, Li YZ, Huang ZF, Xie SS, Yu Y, Cheng M, Zeng HS. Biosens. Bioelectron. 2009;25:388–394. doi: 10.1016/j.bios.2009.07.027. [DOI] [PubMed] [Google Scholar]
- 126.Karatas OF, Sezgin E, Aydin O, Culha M. Colloids Surf., B. 2009;71:315–318. doi: 10.1016/j.colsurfb.2009.02.020. [DOI] [PubMed] [Google Scholar]
- 127.Pinzaru SC, Andronie LM, Domsa I, Cozar O, Astilean S. J. Raman Spectrosc. 2008;39:331–334. [Google Scholar]
- 128.Feng SY, Lin JQ, Cheng M, Li YZ, Chen GN, Huang ZF, Yu Y, Chen R, Zeng HS. Appl. Spectrosc. 2009;63:1089–1094. doi: 10.1366/000370209789553291. [DOI] [PubMed] [Google Scholar]
- 129.Kustner B, Gellner M, Schutz M, Schoppler F, Marx A, Strobel P, Adam P, Schmuck C, Schlucker S. Angew. Chem., Int. Ed. 2009;48:1950–1953. doi: 10.1002/anie.200804518. [DOI] [PubMed] [Google Scholar]
- 130.Aydin O, Kahraman M, Kilic E, Culha M. Appl. Spectrosc. 2009;63:662–668. doi: 10.1366/000370209788559647. [DOI] [PubMed] [Google Scholar]
- 131.Su X, Zhang J, Sun L, Koo TW, Chan S, Sundararajan N, Yamakawa M, Berlin AA. Nano Lett. 2005;5:49–54. doi: 10.1021/nl0484088. [DOI] [PubMed] [Google Scholar]
- 132.Sun SQ, Thompson D, Schmidt U, Graham D, Leggett GJ. Chem. Commun. 2010;46:5292–5294. doi: 10.1039/c0cc00904k. [DOI] [PubMed] [Google Scholar]
- 133.Cao YWC, Jin RC, Mirkin CA. Science. 2002;297:1536–1540. doi: 10.1126/science.297.5586.1536. [DOI] [PubMed] [Google Scholar]
- 134.Faulds K, Smith WE, Graham D. Analyst. 2005;130:1125–1131. doi: 10.1039/b500248f. [DOI] [PubMed] [Google Scholar]
- 135.Nithipatikom K, McCoy MJ, Hawi SR, Nakamoto K, Adar F, Campbell WB. Anal. Biochem. 2003;322:198–207. doi: 10.1016/j.ab.2003.07.020. [DOI] [PubMed] [Google Scholar]
- 136.Wu XY, Liu HJ, Liu JQ, Haley KN, Treadway JA, Larson JP, Ge NF, Peale F, Bruchez MP. Nat. Biotechnol. 2003;21:41–46. doi: 10.1038/nbt764. [DOI] [PubMed] [Google Scholar]
- 137.Kennedy DC, Tay LL, Lyn RK, Rouleau Y, Hulse J, Pezacki JP. ACS Nano. 2009;3:2329–2339. doi: 10.1021/nn900488u. [DOI] [PubMed] [Google Scholar]
- 138.Talley CE, Jusinski L, Hollars CW, Lane SM, Huser T. Anal. Chem. 2004;76:7064–7068. doi: 10.1021/ac049093j. [DOI] [PubMed] [Google Scholar]
- 139.Kneipp J, Kneipp H, Wittig B, Kneipp K. Nano Lett. 2007;7:2819–2823. doi: 10.1021/nl071418z. [DOI] [PubMed] [Google Scholar]
- 140.Wang ZY, Bonoiu A, Samoc M, Cui YP, Prasad PN. Biosens. Bioelectron. 2008;23:886–891. doi: 10.1016/j.bios.2007.09.017. [DOI] [PubMed] [Google Scholar]
- 141.Sha MY, Xu HX, Natan MJ, Cromer R. J. Am. Chem. Soc. 2008;130:17214. doi: 10.1021/ja804494m. [DOI] [PMC free article] [PubMed] [Google Scholar]
- 142.Lutz B, Dentinger C, Sun L, Nguyen L, Zhang JW, Chmura AJ, Allen A, Chan S, Knudsen B. J. Histochem. Cytochem. 2008;56:371–379. doi: 10.1369/jhc.7A7313.2007. [DOI] [PMC free article] [PubMed] [Google Scholar]
- 143.Qian XM, Peng XH, Ansari DO, Yin-Goen Q, Chen GZ, Shin DM, Yang L, Young AN, Wang MD, Nie SM. Nat. Biotechnol. 2008;26:83–90. doi: 10.1038/nbt1377. [DOI] [PubMed] [Google Scholar]
- 144.Stone N, Faulds K, Graham D, Matousek P. Anal. Chem. 2010;82:3969–3973. doi: 10.1021/ac100039c. [DOI] [PubMed] [Google Scholar]
- 145.Dou X, Takama T, Yamaguchi Y, Yamamoto H, Ozaki Y. Anal. Chem. 1997;69:1492–1495. [Google Scholar]
- 146.Huang GG, Hossain MK, Han XX, Ozaki Y. Analyst. 2009;134:2468–2474. doi: 10.1039/b914976g. [DOI] [PubMed] [Google Scholar]
- 147.Wang CG, Chen Y, Wang TT, Ma ZF, Su ZM. Adv. Funct. Mater. 2008;18:355–361. [Google Scholar]
- 148.Jun BH, Noh MS, Kim G, Kang H, Kim JH, Chung WJ, Kim MS, Kim YK, Cho MH, Jeong DH, Lee YS. Anal. Biochem. 2009;391:24–30. doi: 10.1016/j.ab.2009.05.005. [DOI] [PubMed] [Google Scholar]
- 149.Woo MA, Lee SM, Kim G, Baek J, Noh MS, Kim JE, Park SJ, Minai-Tehrani A, Park SC, Seo YT, Kim YK, Lee YS, Jeong DH, Cho MH. Anal. Chem. 2009;81:1008–1015. doi: 10.1021/ac802037x. [DOI] [PubMed] [Google Scholar]
- 150.Noh MS, Jun BH, Kim S, Kang H, Woo MA, Minai-Tehrani A, Kim JE, Kim J, Park J, Lim HT, Park SC, Hyeon T, Kim YK, Jeong DH, Lee YS, Cho MH. Biomaterials. 2009;30:3915–3925. doi: 10.1016/j.biomaterials.2009.03.059. [DOI] [PubMed] [Google Scholar]
- 151.Park H, Lee S, Chen L, Lee EK, Shin SY, Lee YH, Son SW, Oh CH, Song JM, Kang SH, Choo J. Phys. Chem. Chem. Phys. 2009;11:7444–7449. doi: 10.1039/b904592a. [DOI] [PubMed] [Google Scholar]
- 152.Lee S, Chon H, Lee M, Choo J, Shin SY, Lee YH, Rhyu IJ, Son SW, Oh CH. Biosens. Bioelectron. 2009;24:2260–2263. doi: 10.1016/j.bios.2008.10.018. [DOI] [PubMed] [Google Scholar]
- 153.Kim JH, Kim JS, Choi H, Lee SM, Jun BH, Yu KN, Kuk E, Kim YK, Jeong DH, Cho MH, Lee YS. Anal. Chem. 2006;78:6967–6973. doi: 10.1021/ac0607663. [DOI] [PubMed] [Google Scholar]
- 154.Kennedy DC, Duguay DR, Tay LL, Richeson DS, Pezacki JP. Chem. Commun. 2009:6750–6752. doi: 10.1039/b916561d. [DOI] [PubMed] [Google Scholar]
- 155.Kneipp J, Kneipp H, Rajadurai A, Redmond RW, Kneipp K. J. Raman Spectrosc. 2009;40:1–5. [Google Scholar]
- 156.Scaffidi JP, Gregas MK, Seewaldt V, Vo-Dinh T. Anal. Bioanal. Chem. 2009;393:1135–1141. doi: 10.1007/s00216-008-2521-y. [DOI] [PMC free article] [PubMed] [Google Scholar]
- 157.Kneipp J, Kneipp H, Rice WL, Kneipp K. Anal. Chem. 2005;77:2381–2385. doi: 10.1021/ac050109v. [DOI] [PubMed] [Google Scholar]
- 158.Tan XB, Wang ZY, Yang J, Song CY, Zhang RH, Cui YP. Nanotechnology. 2009;20:7. [Google Scholar]
- 159.Xie JP, Zhang QB, Lee JY, Wang DIC. ACS Nano. 2008;2:2473–2480. doi: 10.1021/nn800442q. [DOI] [PubMed] [Google Scholar]
- 160.Koh AL, Shachaf CM, Elchuri S, Nolan GP, Sinclair R. Ultramicroscopy. 2008;109:111–121. doi: 10.1016/j.ultramic.2008.09.004. [DOI] [PMC free article] [PubMed] [Google Scholar]
- 161.Shamsaie A, Heim J, Yanik AA, Irudayaraj J. Chem. Phys. Lett. 2008;461:131–135. [Google Scholar]
- 162.Wang Y, Li D, Li P, Wang W, Ren W, Dong S, Wang E. J. Phys. Chem. C. 2007;111:16833–16839. [Google Scholar]
- 163.Vo-Dinh T, Yan F, Wabuyele MB. J. Raman Spectrosc. 2005;36:640–647. [Google Scholar]
- 164.Wabuyele MB, Yan F, Griffin GD, Vo-Dinh T. Rev. Sci. Instrum. 2005;76:7. [Google Scholar]
- 165.Eliasson C, Loren A, Engelbrektsson J, Josefson M, Abrahamsson J, Abrahamsson K. Spectrochim. Acta, Part A. 2005;61:755–760. doi: 10.1016/j.saa.2004.05.038. [DOI] [PubMed] [Google Scholar]
- 166.Schlucker S, Kustner B, Punge A, Bonfig R, Marx A, Strobel P. J. Raman Spectrosc. 2006;37:719–721. [Google Scholar]
- 167.Jehn C, Kustner B, Adam P, Marx A, Strobel P, Schmuck C, Schlucker S. Phys. Chem. Chem. Phys. 2009;11:7499–7504. doi: 10.1039/b905092b. [DOI] [PubMed] [Google Scholar]


