

Abstract
NeuroMaps (2009) is a web-based application that enables investigators to map data from macaque studies to a canonical atlas of the macaque brain. It includes an image processor enabling one to create figures suitable for publication. Eventually it will enable investigators studying several species to analyze overlap between their data and multimodality data mapped by others. The purpose of this project was to incorporate the Waxholm canonical mouse brain (Hawrylycz, 2009) into NeuroMaps. An enhanced gradient echo (T2*) magnetic resonance image (MRI) of the Waxholm brain (Johnson et al., 2010) was warped to bring the irregular biological midplane of the MRI into line with the mathematically flat midsagittal plane of Waxholm space. The left hemisphere was deleted and the right reflected to produce a symmetrical 3D MRI. The symmetrical T2* image was imported into NeuroMaps. The map executing the warp was applied to four other voxellated volumes based on the same specimen and maintained at the Center for In-Vitro Microscopy (CIVM): a T2-weighted MRI, a T1 weighted MRI, a segmented image and an image reconstructed from Nissl-stained histological sections. Symmetric versions of those images were submitted to the CIVM repository where they are available to other laboratories. Utility of the symmetric atlas was demonstrated by mapping and comparing a cortical areas illustrated in three conventional mouse brain atlases. The symmetric Waxholm mouse brain atlas is now accessible in NeuroMaps. Investigators can map image data to standard templates over the Web and process them for publication, presentation and archival purposes: http://braininfo.rprc.washington.edu/MapViewData.aspx.
Keywords: canonical brain atlas, image processing, neuroinformatics, warping, Waxholm space, NeuroMaps, Mouse brain, Web neuroscience resource
1. Introduction
Quantitative neuroanatomy involves mathematical and statistical analyses of shape, size and overlap between multimodality data and neuroanatomical structures. Comparisons are conducted most effectively when data are mapped from multiple sources to a standard canonical brain. Data from MRI modalities can sometimes be mapped adequately using automated voxel-matching techniques (Toga, 1999). Data from stained histological sections, however, are best mapped relative to fiducial landmarks that are visible in both the canonical brain and the histological section. In practice, the landmarks are often point features of the classical neuroanatomical structures revealed by the stains for Nissl substance and myelin on which the classical neuroanatomical nomenclature is based.
Until recently, brain atlases with a useful level of resolution could only be constructed from sets of Nissl- and myelin-stained sections taken at regular intervals through the brain (Bowden, 2000a). In the past decade, however, MRI resolution has come to rival that of low-magnification microscopic images of stained sections. The structural features revealed by MRI and by the classical stains are sufficiently similar that MRIs can be used to construct atlases suitable for mapping data with respect to the classical neuroanatomical structures. Atlases are more effectively constructed from MRIs than from stained sections, because, unlike stained sections, MRIs do not suffer nonlinear distortion due to differential shrinkage during fixation, physical shearing and compression during cutting and mounting, or uneven staining from one section to the next.
NeuroMaps (2009), the atlas component of BrainInfo (2009) is a web-based canonical atlas, mapping tool and image processor, developed around a 3D canonical atlas of the rhesus macaque brain. It currently enables investigators to map data in a standard format for publication, slide presentations, web displays and image archiving. When completed, it will enable investigators to compare quantitatively the distribution of their data with all other data mapped to the same atlas.
The purpose of the present project was to load the Waxholm canonical mouse brain (Johnson et al., 2010) into NeuroMaps to allow investigators to map data from mouse studies as well as from macaque studies. Four steps were involved: 1) warping the biological midline of the Waxholm canonical MRI to the midsagittal plane of the Waxholm space; 2) reflecting one hemisphere across this synthetic midsagittal plane to produce a symmetrical canonical image; 3) loading the symmetrical MRI into the NeuroMaps space; and 4) demonstrating suitability of the atlas for mapping structural boundaries from conventional mouse brain atlases to the Waxholm brain.
2. Methods and Results
2.1 The Waxholm Specimen
The brain specimen for the Waxholm mouse canonical model was obtained from a single perfusion-fixed adult male of the C57BL/6J strain (Johnson et al., 2010). Five image-volumes obtained from the specimen were downloaded from the Duke Center for In-Vivo Microscopy (CIVM, 2010). Three were MRIs, one a 3D reconstruction from Nissl-stained histological sections, and one a set of labels of 37 brain structures. All five datasets were in NIfTI-1 format. The gray levels of voxels in MRIs were represented as 16-bit integers. All were registered to the identical Waxholm space.
The Waxholm space involves two coordinate systems, that of the MRI volume and that of the canonical mouse brain atlas. The MRI coordinate system defines a rectangular volume, which is by convention a region inside the first octant of a three-dimensional Cartesian space. Defined by Method 2 of the NIfTI-1 header format (Cox, 2007), its axes are scaled in continuous coordinates (i,j,k) with each voxel identified by the coordinates of its center. Voxels are isotropic, 21.5mu on a side. The dimensions of the image volume are 512 × 1024 × 512 voxels. This is roughly in proportion to the shape of the mouse brain, where the posterior-anterior dimension is about twice the lateral and ventral-dorsal dimensions. The brain image is positioned in the MRI space in standard NIfTI orientation, i.e., a coronal section shows the brain in cross-section as viewed from behind with the animal’s right side on the right and left side on the left. Coordinates on the i-axis from 0 to 511 run along the brain’s left to right dimension; coordinates along the j-axis from 0 to 1023 run along the brain from posterior to anterior; coordinates along the k-axis from 0 to 511 run along the brain from ventral to dorsal. The nominal stereotaxic midplane of the brain is assigned to a vertical (JK) plane near the center of the i-axis of the space. Ventrodorsally, the image is positioned with the anterior commissure (ac) near the center of the j-axis. Finally, in accord with the mouse brain atlas of Paxinos and Franklin (2001), the base of the brain image is aligned parallel to the horizontal (IJ) plane. For the Waxholm canonical mouse brain, the origin of the atlas coordinate system (x,y,z) = (0,0,0) is set to the center of ac at MRI coordinates (i,j,k) = (250,560,253). The x,y,z axes are scaled in millimeters.
The symmetric version of the brain produced in this project was based on an enhanced gradient echo volume, the Waxholm skull-stripped canonical T2* MRI (dataset: SSCT2star.nii.gz) (Johnson et al., 2010). This image was selected because it showed more anatomic detail and greater contrast between gray and white matter than the other skull-stripped, high-resolution images provided by the CIVM. The other four images, which were to be converted to symmetric versions by applying the warp developed on the T2* image, were a skull-stripped T2 image (SSCT2.nii.gz) and T1 image volume (SSCT1.nii.gz) (Johnson et al., 2007); a label volume representing 37 structures by different gray levels for voxels in different structures (CLabel.nii.gz) (Sharief et al., 2008) and a volume reconstructed from Nissl-stained histological sections of the postmortem brain after the MRI was obtained (Ma et al., 2005) (CNissl.nii.gz) (Johnson et al., 2010). Symmetric versions of these volumes were returned to the CIVM repository for sharing with other laboratories.
2.2 Flattening the Midline
The image volumes were inspected using MRIcro (Rorden, 2010), and the biological midplane of each image-volume was warped to the midsagittal plane using Edgewarp (Bookstein and Green, 2002) in the following sequence of operations.
2.2.1 Match canonical volume to Edgewarp’s internal format
Each volume was stripped of its NIfTI header and each voxel value truncated to produce a substitute MRI volume of 8 unsigned bits (gray levels 0–255) in the geometry of the original MRI coordinate system.
2.2.2 Determine maximal dimensions of canonical brain
Inspection of the image by planes parallel to the original MRI coordinate axes found maximal extents as follows: posterior to anterior, i.e., from a plane just posterior to the spinomedullary junction to the rostral poles of the olfactory bulbs, a total range of 871 voxels or 18.7mm; left to right: total range 496 voxels or 10.7mm; ventral to dorsal: 345 voxels or 7.4mm.
2.2.3 Subdivide the posterior-anterior range
From previous experience with Edgewarp we estimated that subdividing the MRI brain into 20 coronal blocks would provide a sufficient sample of cross-sections to allow the software to flatten the sagittal midplane. The posterior-anterior range was divided into twenty blocks at spacing of 18.7mm/20 = 935mu. The blocks abutted at 19 plane sections of the original MRI volume, each section lying between a pair of consecutive MRI slices at the original 21.5mu spacing. Edgewarp generated 19 synthetic sections by linear interpolation of the 8-bit image between pairs of abutting blocks.
2.2.4 Identify midline points
Two to six points lying in the biological midline were identified by inspection in each of the 19 synthetic image sections (Fig. 1, right panel). We began with the MRI plane fifth from the rostral pole of the olfactory bulb and proceeded posteriorly to just beyond the spinomedullary junction. This resulted in the placement of a total of 74 landmark registration points in the 19 coronal planes as seen in mediolateral view (Fig. 1, left panel).
Figure 1. Edgewarp Screen Mockup.

Left panel: midline sagittal section of Waxholm canonical mouse brain MRI showing vertical and horizontal axes through the origin of the Waxholm space in NeuroMaps. Plus sign (+) represent the locations of registration points used to flatten the biological midsagittal plane to the stereotaxic midsagittal plane; thin arrow: registration point illustrated in right panel; thick arrow: registration point added to correct the first warp (Sec. 2.2.7). Right panel: coronal section with two upper and two lower registration points recorded; cross-hairs illustrate recording of a fifth registration point.
2.2.5 Determine i-coordinate of flat midsagittal plane
The lateral (i) coordinates of the 74 biologically midplane points were averaged, and the mathematical midplane was set at a coordinate equal to the average. Most displacements from the biological midplane to the synthetic midplane were six voxels (13mu) or less, although some ranged to as high as 15 voxels, about 340mu, at the anterior-posterior extremes.
2.2.6 Define maximal left-right dimension
Fiducial points were set at the leftmost and rightmost points of the MRI to produce a left-right width through the brain near its widest section. These fiducial points brought the number of reference points to 76. They were not landmarks, however, but served a technical function in the spline warping to follow.
2.2.7 Warp biological midplane to a flat plane
A 3D thin-plate spline warped the 74 points of the biological midplane (Sec. 2.2.4) onto the mathematically flat midplane (Sec. 2.2.5), while leaving the lateral extreme fiducial points (Sec. 2.2.6) in their original locations. The warping of some 256 million voxels as a function of 76 reference points required 9 minutes on a 2005 Dell, single-processor desktop computer. According to the mathematics of the spline (Bookstein, 1991), the warping altered only the medial-lateral (i) coordinate of points, leaving the ventral-dorsal and posterior-anterior coordinates unchanged. In effect, it was a nonlinear transformation of every line j = constant, k = constant taken perpendicular to the midplane of the original MRI image. The warping was realized in the form of a new volume on the same voxel boundaries (21.5um cubes) as the original volume. The program that computed the warp is described in Bookstein and Green (2002). Operating on Linux (Debian or Ubunto) platforms, it is distributed at no charge from: ftp://brainmap.stat.washington.edu/edgewarp3/edgewarp3.31_3_i386.deb
2.2.8 Check adequacy of first warp
To check the adequacy of the warp we inspected 37 planes. These included the 19 that supplied landmarks for the flattening (Sec. 2.2.4) and 18 planes halfway between consecutive pairs of those. We found only one plane in which the midline had not been warped adequately to the flat sagittal midplane (Fig. 1, left panel, thick arrow). A 75th midplane point was recorded to enable the warp to bring that region into alignment. The total number of registration landmarks recorded was thus 75, plus the two lateral fiducials, totaling 77 reference points.
2.2.9 Final warp
The warp was repeated as described in Sec. 2.2.7 to produce the final image with flat sagittal midplane.
2.2.10 Evaluation of deviation of the biological midplane from mathematically flat
The degree and regionalization of bending of the midsagittal ‘plane’ in the biological specimen before it was flattened are illustrated in Figure 2. The maximal deviations, ranging from 6 voxels (0.13mm) up to 15 voxels (0.34mm) were at the rostral and caudal ends of the specimen. The brain in the cranium was bent such that the olfactory bulbs and brainstem were to the right of the mean i-coordinate and the center of the brain in the posterior-anterior dimension slightly to the left. The brain curved gradually left from the olfactory bulbs, then was virtually flat to where the brainstem again deviated sharply to the right.
Figure 2.

Irregular shape of biological midsagittal plane of the Waxholm canonical mouse brain. The left-right (I) axis is scaled at 15-times that of the J- axis and about 4 times that of the K-axis to emphasize the pattern of deformation in different regions before flattening to the midsagittal plane of Waxholm space.
2.3 Creation of Mirrored MRI
A symmetric 3D MR image was produced from the image with flat midline by arbitrarily deleting the hemisphere on the left of the midsagittal plane and reflecting the right hemisphere to produce a mirror image. Using custom tools derived from the NIFTI library of MindSeer (Moore et al., 2007) we generated the hemispheric and symmetric files with appropriate headers. The midline was identified with the JK plane through the centers of voxels at the center of the anterior commissure as determined by inspection in MRIcro (Rorden, 2010). Voxels to the left of this plane were discarded and voxels to the right were reflected and assigned i-coordinates from 0 to 255 such that the midline voxels were at i = 256. The symmetrical volume was created by reflecting the space, including the hemisphere, and assigning every voxel in the range 256 to 511 to the reflection (ireflect = 511 – i). The (i,j,k) coordinates were transformed into the millimeter coordinates (x,y,z) of the NeuroMaps stereotaxic space by Method 2 of the NIFTI-1 header format (Cox, 2007). The appropriate header file was created by using metadata available from the original headers and submitting the voxel index to millimeter (mm) transform such that the voxel for the center of the anterior commissure, NeuroMaps origin (x,y,z) = (0mm, 0mm, 0mm), appeared at NIFTI coordinates (i,j,k) = (256, 561, 252). The axes in NeuroMaps are scaled to the nearest 0.01mm.
The warp developed to flatten the midline of the T2* image of the canonical brain was applied to four other image volumes provided by the CIVM to produce symmetric versions of the standard T2-weighted MRI, the T1-weighted MRI, the Labels volume and the Nissl volume. The final files were labeled respectively: SYMCT1.nii.gz, SYMCT2.nii.gz, SYMCNissl.nii.gz, and SYMCLabel.nii.gz. They were submitted together with the NeuroMaps SYMCT2star.nii.gz volume to the Duke Center for In-Vivo Microscopy (CIVM, 2010) for inclusion in the repository of canonical mouse brain volumes in Waxholm space.
2.4 Test of utility of the symmetric canonical model in NeuroMaps
NeuroMaps is a web-based application that supports interactive mapping of data from digital images of histological slides, diagrams and other sources into canonical atlases of the macaque brain and, with the conclusion of this project, the mouse brain. The symmetric T2* MRI (SYMCT2star.nii.gz) was loaded into NeuroMaps (2009) and used to compare cortical areas as illustrated in three commonly used atlases of the mouse brain (Fig. 4). The page of each atlas showing the coronal section nearest the center of the anterior commissure was scanned in .jpg format and loaded into NeuroMaps. Each section was matched to the most nearly matching plane of NeuroMaps. In the Hof and AIBS atlases this section passed through the center of the anterior commissure (Fig. 4A and 4B); in the Paxinos & Franklin atlas it was caudal to the center of the commissure (Fig. 4C).
Figure 4.

Cortical areas from three mouse brain atlases mapped to the symmetric Waxholm brain. Areas from Atlases A and B were mapped to the true coronal plane 0.02 mm rostral to the origin of the stereotaxic space, i.e., center of the anterior commissure (ac +0.02mm). The nearest comparable page of Atlas C was mapped to the NeuroMaps plane ac −0.17mm, top tipped forward 6°.
Each section was warped separately to its corresponding plane in NeuroMaps by identifying pairs of equivalent landmarks in the published images and in the NeuroMaps Atlas. The boundary of each cortical area was traced in NeuroMaps as a separate overlay to the NeuroMaps image. The overlays were labeled and colored to aid matching of equivalent structures in the different atlases by inspection.
As is evident from Figure 4, some areas, such as the superior and inferior parts of the anterior cingulate gyrus, yellow and light green respectively, are quite similar in the different atlases. Other areas, such as the primary motor area, dark blue, and secondary sensorimotor area, pink, are twice as large in one atlas as in another. Some regions, such as the primary sensorimotor area, red, are segmented to a much greater degree by one author than by another. Comparisons of this kind are very difficult to carry out by any method other than mapping to a common template. NeuroMaps is designed to facilitate mapping of structures and data from multiple sources to the common Waxholm template for sharing over the Web.
3. Discussion
3.1 Rationale for a symmetric version of the canonical brain
Combining or statistically comparing the distributions of morphometric data from the two sides of the brain requires that all data be referenced to numeric coordinates in a common template. If some data are mapped to a template based on one side and some to another, the data mapped to one must be remapped to the other, or data from both must be remapped to a third template. Either of those operations is time consuming and introduces unnecessary error into the estimates of location. The issue does not arise if all data are mapped directly to a common template.
Another reason for mapping data to a symmetrical template is to accommodate data from sources where laterality is unknown without degrading the dataset for analyses of differences based on laterality. Many studies do not require recording of the side of origin of the data. In many histological studies sections are mounted on glass slides with reasonable disregard for side of origin. Many reports of gene expression, recording sites, stimulation sites, and other kinds of data combine findings from the two hemispheres in a single table or illustration of one hemisphere. Some reports show a coronal template that could be either right or left depending on whether the illustrator’s viewpoint, unspecified, was from the back or the front of the brain. To avoid error due to such ambiguity a person mapping data from such sources needs to be able to specify laterality as ‘unknown’ independently of the side of the brain to which the data are mapped. An atlas of shared findings must allow ambiguous laterality to be flagged so that other users can decide whether to include or exclude data from their analyses.
3.2 Why center stereotaxic space on the anterior commissure and scale axes in metric units
NeuroMaps is intended for use with stereotaxic procedures in multiple species. This is best achieved if the origin of stereotaxic spaces of the various species is standardly assigned to an easily recognizable landmark near the center of the brain. With the advent of ventriculography and MRI as methods for registering individual brains to standard atlases, neuroscientists working with most vertebrate species have adopted the anterior commissure as the origin of the stereotaxic space and scale the axes in millimeters (Bowden, 2000b; Harwylycz, 2009). Thus, the center of the decussation of the anterior commissure has been adopted as the origin of the stereotaxic space for atlases of all species in NeuroMaps.
3.3 Rationale for using Edgewarp to flatten the biological midline
Edgewarp is the first and, still to our knowledge, only open-source freeware package for generalized 3D warping of images driven by discrete point, curve, or surface data. Note that the procedure, which we refer to as a ‘warp’ in this report is technically an ‘unwarp’ and is so referenced in Edgewarp literature (Bookstein and Green, 2002).
Edgewarp and a newly released version thereof (EVAN, 2010), is a general-purpose 2D and 3D warping application. Its advantage over most warping and morphing applications is that it is a biometric, not a graphical procedure. In addition to providing visual images, its mathematical results support analyses of both, 1) intersample variation, such as the instability of the flattening geometry over multiple specimens, and 2) intrasample variation, because the coefficients of the warp can be used to generate a measure of uncertainty for every point in the unwarped image. A further advantage is the efficiency of the warping function. The function is a composite of ordinary 3D distances and weights that are functions of matrix operations of order NM, where N is the number of fiducials and M is the number of image voxels. The weights are of order N-cubed in computational complexity; typically this is far less than NM. So the software computes warps very rapidly compared to corresponding finite-element analyses. The limitations of the Edgewarp approach correspond to its advantages. Since Edgewarp is not a finite-element procedure it cannot simulate material under strain or stress, and it does not take into account differential responses of internal components to strain and stress, such as liquid vs. tissue compartments. Neither of those factors was at issue in this use of the application.
Earlier versions of Edgewarp were applied to 2D data to identify significant differences in brain structure between, for example, schizophrenic and normal individuals (DeQuardo et al., 1996). The present 3D version has been used to localize distinctive features of the corpus callosum and cerebellum in adolescents and adults with fetal alcohol damage (Bookstein et al., 2002) and to describe many features of the human skull through recent evolution (Mitteroecker et al., 2004). The specific task here, to flatten an originally unflat midplane, is not programmed into Edgewarp as an independent routine but was readily achieved using general features of the application for warping one landmark configuration onto another. The number of 75 coplanar landmark points was determined not algebraically or geometrically but empirically as sufficient to bring all deviations identified by inspection to the midsagittal plane. The application of a warp computed on one image to a different image in the same coordinate system, as was performed on four independent images of the canonical brain (Sec. 2.3), is a routine command in Edgewarp.
3.4 Anticipated uses of the NeuroMaps Atlas
The NeuroMaps atlas is immediately useful as an image processor to create figures showing data mapped to standard templates for publication, research presentations and archival purposes (Fig. 4). It is also scaled for stereotaxic use. In the future investigators will be able to map data to the NeuroMaps Atlas and obtain a list of all other datasets mapped to the Atlas that overlap their data. This will be valuable for generating hypotheses as to the relations between one’s own findings and the findings of investigators working in entirely different areas of neuroscience.
Figure 3. Symmetrical canonical brain.
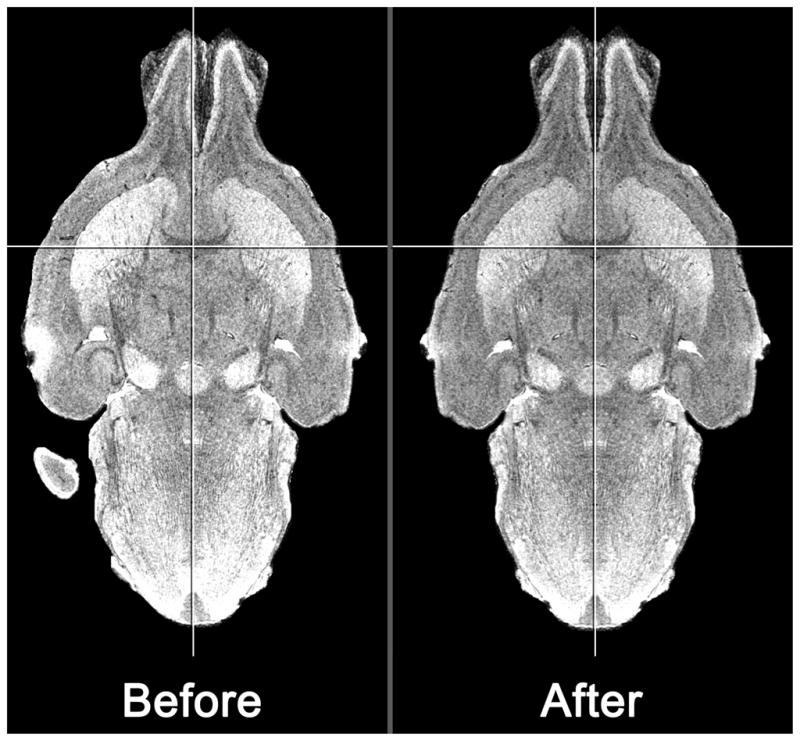
The result of flattening the midline and reflecting the right hemisphere to create a symmetrical canonical brain. Pictured are horizontal sections through the midpoint of the anterior commissure, vertical level j = 253 in the canonical Waxholm space using MRIcro (Rorden, 2010).
Acknowledgments
The authors wish to thank Erik McArthur for expert assistance in the production of figures for this report and James Cook for posting the symmetric volumes on the CIVM website. The work was supported by the International Neuroinformatics Coordinating Facility (INCF) and by grants from the US National Institutes of Health, MH-069259 and RR-000166 to the University of Washington and RR-005959 and CA-092656 to Duke University.
Contributor Information
Douglas M. Bowden, Email: dmbowden@uw.edu.
G. Allan Johnson, Email: gjohnson@duke.edu.
Laszlo Zaborsky, Email: laszloz@andromeda.rutgers.edu.
William D.K. Green, Email: wdkg@wdkg.org.
Eider Moore, Email: i.am.eider@gmail.com.
Alexandra Badea, Email: alexandra.badea@duke.edu.
Mark F. Dubach, Email: Mdubach@wanprc.org.
Fred L. Bookstein, Email: flb@stat.washington.edu.
References
- AIBS. Allen Reference Atlas. Allen Institute for Brain Science; Seattle: http://mouse.brain-map.org/viewImage.do?imageId=130958(5 August, 2010) [Google Scholar]
- Bookstein FL. Morphometric Tools for Landmark Data: Geometry and Biology. Cambridge University Press; Cambridge (UK): 1991. [Google Scholar]
- Bookstein FL, Green WDK. Edgewarp Users Manual, EWSH3.19. Seattle: 2002. ftp://brainmap.stat.washington.edu/edgewarp3(15 August 2010) [Google Scholar]
- Bookstein FL, Sampson PD, Connor PD, Streissguth AP. The midline corpus callosum is a neuroanatomical focus of fetal alcohol damage. The Anatomical Record - The New Anatomist. 2002;269:162–174. doi: 10.1002/ar.10110. [DOI] [PubMed] [Google Scholar]
- Bowden DM. History of brain atlases for nonhuman primates. In: Martin RF, Bowden DM, editors. Primate Brain Maps. Amsterdam. Elsevier; Amsterdam: 2000a. pp. 1–12. [Google Scholar]
- Bowden DM. Atlases for informatics and quantitative neuroanatomy. In: Martin RF, Bowden DM, editors. Primate Brain Maps. Amsterdam. Elsevier; Amsterdam: 2000b. pp. 13–22. [Google Scholar]
- BrainInfo. A portal to neuroanatomical information on the Web. University of California at San Diego (UCSD) and International Neuroinformatics Coordinating Facility (INCF); San Diego: 2009. http://braininfo.org (25 May, 2010) [Google Scholar]
- CIVM. Website of Center for In-Vivo Microscopy. Duke University; Durham: 2010. http://www.civm.duhs.duke.edu/WHS (15 August 2010) [Google Scholar]
- Cox RW. Brief official definition of the nifti1 header. US National Institutes of Health; Bethesda: 2007. http://nifti.nimh.nih.gov/pub/dist/src/niftilib/nifti1.h (3 August, 2010) [Google Scholar]
- DeQuardo JR, Bookstein FL, Green WDK, Brumberg JA, Tandon R. Spatial relationships of neuroanatomic landmarks in schizophrenia. Psychiatry Research: Neuroimaging. 2006;67:81–95. [PubMed] [Google Scholar]
- EVAN. EVAN toolbox. Website of the European Virtual Anthropology Network - Society e.V. 2010 http://www.evan-society.org/node/23 (10 November, 2010)
- Harwylycz M. The INCF Digital Atlasing Program: Report on Digital Atlasing Standards in the Rodent Brain. INCF Secretariat. Karolinska Institutet; Stockholm: 2009. http://www.incf.org/documents/WHS-Report-Web.pdf. [Google Scholar]
- Hof PR, Young WG, Bloom FE, Belichenko PV, Celio MR. Comparative Cytoarchitectonic Atlas of the C57BL/6 and 129/Sv Mouse Brains. Elsevier; Amsterdam: 2000. p. 47. [Google Scholar]
- Johnson GA, Ali-Sharief A, Badea A, Brandenburg J, Cofer G, Fubara B, Gewalt S, Hedlund LW, Upchurch L. High-throughput morphologic phenotyping of the mouse brain with magnetic resonance histology. Neuroimage. 2007;37(1):82–89. doi: 10.1016/j.neuroimage.2007.05.013. [DOI] [PMC free article] [PubMed] [Google Scholar]
- Johnson GA, Badea A, Brandenburg J, Cofer G, Fubara B, Liu S, Nissanov J. Waxholm Space: an image-based reference for coordinating mouse brain research. Neuroimage. 2010;53(2):365–372. doi: 10.1016/j.neuroimage.2010.06.067. [DOI] [PMC free article] [PubMed] [Google Scholar]
- Ma Y, Hof PR, Grant SC, Blackband SJ, Bennett R, Slatest L, McGuigan MD, Benveniste H. A three-dimensional digital atlas database of the adult C57BL/6J mouse brain by magnetic resonance microscopy. Neuroscience. 2005;135:1203–15. doi: 10.1016/j.neuroscience.2005.07.014. [DOI] [PubMed] [Google Scholar]
- Mitteroecker P, Gunz P, Bernhard M, Schaefer K, Bookstein FL. Comparison of cranial ontogenetic trajectories among hominoids. Journal of Human Evolution. 2004;46:679–698. doi: 10.1016/j.jhevol.2004.03.006. [DOI] [PubMed] [Google Scholar]
- Moore EB, Poliakov AV, Lincoln P, Brinkley JF. MindSeer: a portable and extensible tool for visualization of structural and functional neuroimaging data. BMC Bioinformatics. 2007;8:389. doi: 10.1186/1471-2105-8-389. [DOI] [PMC free article] [PubMed] [Google Scholar]
- NeuroMaps. BrainInfo. Website of the University of California at San Diego (UCSD) International Neuroinformatics Coordinating Facility (INCF); San Diego: http://braininfo.rprc.washington.edu/MapViewData.aspx. [Google Scholar]
- Paxinos G, Franklin GA. The Mouse Brain in Stereotaxic Coordinates. 2. Academic Press; New York: 2001. [Google Scholar]
- Rorden C. MRIcro Freeware Image Processing Program. 2010 http://cnl.web.arizona.edu/mricro.htm(14 August 2010)
- Sharief AA, Badea A, Dale AM, Johnson GA. Automated segmentation of the actively stained mouse brain using multi-spectral MR microscopy. Neuroimage. 2008;39:136–45. doi: 10.1016/j.neuroimage.2007.08.028. [DOI] [PMC free article] [PubMed] [Google Scholar]
- Sharief AA, Johnson GA. Enhanced T2 contrast for MR histology of the mouse brain. Magnetic Resonance in Medicine. 2006;56(4):717–725. doi: 10.1002/mrm.21026. [DOI] [PubMed] [Google Scholar]
- Toga AW. Brain Warping. Academic Press; San Diego: 1999. p. 311. [Google Scholar]