

Hyperpolarized gas MRI has introduced new means to visualize pulmonary function regionally, non-invasively and with high resolution. This technology has seen wide-ranging application in clinical research1–8, but only modest application in animal studies9–12. This is partly because hyperpolarized gas MRI is more straight-forward to conduct in human subjects, who can inhale and hold their breath, than in uncooperative animals which must be anesthetized and ventilated. Nonetheless, many applications are emerging for hyperpolarized gas MRI in small animals, but this has been limited to a few centers that have the expertise needed to precisely deliver hyperpolarized gases to small animals. While the majority of small animal hyperpolarized gas MRI to date has been conducted in rabbits13–15, guinea pigs16, and rats17–22, there is also a compelling need to image mice given their prominent role in biomedical research. This presents even greater challenges for using hyperpolarized gas MRI because compared to rats, mouse lung volumes are 10-fold smaller, breathing rate is 2-fold faster, and higher resolution is required to visualize their airways.
Delivery of hyperpolarized gases for small animal imaging requires a dedicated ventilator that can be used in proximity to an MR magnet. MR-compatible ventilators have been available since the mid 80’s to facilitate small-animal proton imaging of the lung and integrate the capability to administer gaseous anesthesia, control breathing and trigger imaging in synchrony with the respiratory and cardiac cycles23–27. Specifically, it was recognized that high-resolution imaging of the small animal lung required accumulating image data over multiple breaths, which in turn required repeatedly delivering the same tidal volume and repositioning the lung with high precision during each cycle. However, these ventilators were not designed to deliver hyperpolarized gases, which must be handled using only specific materials that preserve nuclear spin polarization28–29. To this end, Hedlund et al. pioneered the first ventilators that could deliver hyperpolarized gases in a well-controlled fashion, while using components that avoided depolarization. These ventilators enabled the first in vivo 3He images of guinea pig lungs16, and subsequent improvements enabled the delivery of a smaller tidal volume in rats30. These ventilators relied on a pneumatically-controlled valve positioned close to the animal31–34. However, the intricate design and rigorous fabrication requirements of these valves limited their adoption at other centers.
Recently, Chen et al. introduced a different hyperpolarized gas ventilator22 that eliminated the need for a custom delivery valve. This change significantly simplified the design, and with the reduction of dead volumes, permitted hyperpolarized gas MRI to become possible in mice35. This ventilator design has been used by our laboratory to conduct studies using 3He and 129Xe, in both rats and mice36,37. Our recent studies using bronchoconstrictive challenge to study airways hyperresponsiveness in mice38 have led us to introduce several new design elements that make the constant volume delivery of hyperpolarized 3He more robust and permit quantitative analysis39. Furthermore, the paucity and cost of 3He and the frequent use of expensive isotopically enriched 129Xe create a strong incentive to recapture the exhaled gases after imaging. Hence, it is the objective of this manuscript to clearly describe the key design aspects of this robust ventilator and recapture system, to provide an experimental validation of its performance, and to include a comprehensive list of parts to enable duplication by others wishing to conduct preclinical hyperpolarized gas MR imaging.
Conceptual Overview
The ventilator is designed to deliver a mixture of nitrogen and oxygen during normal breathing (usually 80% N2 and 20% O2) and to substitute hyperpolarized gas in place of nitrogen during hyperpolarized gas MRI40. As shown in figure 1, the delivery of nitrogen and oxygen is controlled by fast-switching solenoid valves that reside in the ~0.1T fringe field of the 2 Tesla magnet. After passing through these valves, the breathing gases are delivered through a long, but low-dead volume polymer tube to the animal in the magnet bore. A similar tube directs expired gas to the exhale valve, also residing in the fringe field. As with most hyperpolarized gas ventilator designs, the hyperpolarized gas is delivered from a Tedlar bag, which is housed inside a rigid, pressurized cylinder.
Figure 1.

a) Schematic of the ventilator. From the upper right corner of the schematic: oxygen flows through a regulator, a pressure gauge, then a flow restrictor. Its delivery to the animal is controlled by the oxygen valve. The nitrogen line operates similarly. Hyperpolarized gas is delivered from a Tedlar bag which resides in a rigid chamber that is pressurized by N2. The valve, restrictor, and tubing that handle HP gas are built from polarization-preserving materials, as indicated by the bold line. All gases are combined at the valve outputs and directed through the inhale line to the endotracheal tube. After inspiration and a brief breath-hold for imaging, gases are expelled by opening the venting valve (normal breathing) or capture valve (HP gas breathing). Note: tubing represented by a triple line indicates that the dead volume must be minimized. b) the ventilator and all the valves are positioned in the ~0.1 T fringe field of the 2 Tesla magnet during imaging. One-meter-long lines direct the breathing mixture towards the animal at the center of the magnet, or recollect the exhale mixture
A key design requirement for the ventilator is to repeatedly deliver all necessary gases in precise volumes, without needing a mixing valve that operates close to the animal’s trachea. This requirement is met by flowing the gases from a pressure much higher than physiologic lung pressure (typically between 2 psi and 5 psi), through a precision high-impedance flow constrictor to achieve a well-defined flow rate. The tidal volume of each gas is nominally determined by the product of this flow rate and the duration for which the delivery valve is opened. This design ensures that the gas flow, and thus the tidal volume, are dominated by the impedance of the flow restrictor and are largely unaffected by the impedance of the connecting tubing or any changes in lung impedance during imaging.
The inspiration phase ends when the valves controlling the flow of oxygen, nitrogen or hyperpolarized gas are closed, initiating a brief breath-hold during which imaging data is typically acquired. After this, the solenoid valve controlling expiration is opened to initiate passive exhalation of the lungs back to functional residual capacity. For mice, typical timing of the ventilatory cycle is a breathing rate of 100 breaths per minute, with 150 ms for inspiration, a 150 ms breath-hold, and 300 ms for expiration. For rats, 60 breaths per minute, 250 ms inspiration, 250 ms breath-hold, and 500 ms expiration are typically used.
The operation of the hyperpolarized gas line is slightly different from the oxygen and nitrogen lines because the hyperpolarized gas cannot pass through a typical metallic solenoid valve without substantial depolarization. Hence, the delivery of the hyperpolarized gas is controlled using a rapidly switching pneumatic valve constructed entirely from Teflon. This pneumatic valve is opened and closed by pressure changes controlled by a solenoid valve identical to those that control the N2 and O2 lines. Additionally, the flow restrictor used on the hyperpolarized gas line is made of sapphire embedded in nylon; both materials are non-depolarizing. In figure 1, the parts of the ventilator that must be constructed from non-depolarizing materials are indicated by a bold line. They include the hyperpolarized gas valve and restrictor, as well as the inhale tubing.
Physical Implementation
The ventilator is constructed using inexpensive, off-the-shelf, fast-switching solenoid-actuated valves (model EC-2-12-H, Clippard, Cincinnati, OH), which control the flow of oxygen, nitrogen, exhalation, and the actuation of the pneumatic valve delivering hyperpolarized gas. For each gas line, the pressure is controlled using compact pneumatic regulators (model R7010, AirLogic, Racine, WI). Oxygen and nitrogen flow through brass flow restrictors (model MLP-1-BR to MLP-5-BR, and L-6-BRto L-30-BR, O’Keefe Controls, Trumbull, CT). Hyperpolarized gas flows through a fast-switching, pneumatically actuated valve with all-Teflon construction (model PV-1-1134, Partek Division, Parker Hannifin, Tucson, AZ) and a non-depolarizing sapphire constrictor (model F-3-NYto F-30-NY, O’Keefe Controls, Trumbull, CT). The size of the restrictor depends on the tidal volume required by the animal and the type of gas administered (Table 1). As is discussed later, it is important to minimize the mechanical volume between the restrictors and the valves, which is done by integrating the constrictor directly into the hose barb, as shown in figure 2.
TABLE 1.
Size of restrictors, supply pressure and ventilation parameters for mice and rats. The restrictors are chosen so that the desired tidal volume is delivered when the supply pressure exceeds a few psig. The inner-diameter of the inhale and exhale lines is 1/32 in for mice, and 1/16 in for rats.
| Mouse | Rat | |||||||||
|---|---|---|---|---|---|---|---|---|---|---|
| Orifice Diameter (mm) | Supply Pressure (psig) | Inhalation Duration (ms) | breathing rate (min−1) | Tidal Volume (ml) | Orifice Diameter (mm) | Supply Pressure (psig) | Inhalation Duration (ms) | breathing rate (min−1) | Tidal Volume (ml) | |
| O2 | 0.02 | 2.0 | 150 | 100 | 0.05 | 0.13 | 6.0 | 250 | 60 | 1.0 |
| N2 | 0.04 | 3.0 | 0.20 | 0.24 | 5.0 | 3.0 | ||||
| 3He | 0.04 | 3.5 | 0.20 | 0.22 | 4.0 | 3.0 | ||||
| 129Xe | 0.07 | 4.5 | 0.20 | 0.26 | 3.5 | 3.0 | ||||
Figure 2.
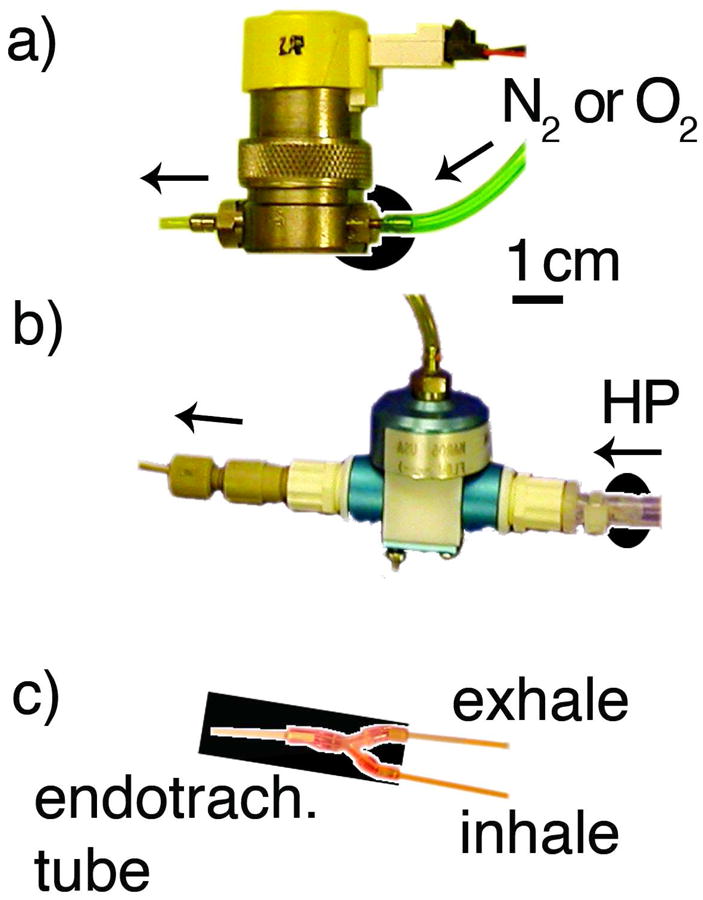
a) To minimize the mechanical volume between the flow constrictor and the valve, the solenoid-actuated valves of the oxygen and nitrogen lines use a constrictor integrated into the brass hose barb, highlighted by the black oval background. b) Similarly, the flow constrictor for hyperpolarized gas (emphasized by the black oval background) is located as close as possible to the Teflon-constructed, pneumatically-actuated valve. c) The volume from the tip of the endotracheal tube (left) to the junction tee of the inhale and exhale line is limited to 0.02ml as indicated by the black background
The nitrogen, oxygen, and hyperpolarized gas lines are combined immediately upon exiting their respective control valve into a single 1-m-long, polyether ether ketone (PEEK) inhale line (model TPK130, Vici Valco instruments, Houston, TX), which links the ventilator to the animal in the center of the MRI magnet. Because this line carries hyperpolarized gas, it must be constructed from non-depolarizing materials, in this case, PEEK. Furthermore, hyperpolarized gas and oxygen travel together through the inhale line, and oxygen is a potent source of depolarization: it is critical to limit their interaction time by minimizing the dead-volume. In our system, the dead volume of the inhale line is 0.4 ml (inner-diameter 1/32 in). During the administration of hyperpolarized gas to a mouse, the usual tidal volume of 0.25 ml results in an interaction between oxygen and hyperpolarized gas lasting 1.6 breaths (960 ms), which results in less than 10% polarization loss during transit.
Exhalation proceeds through PEEK tubing with the same inner-diameter (1/32 in) that provides sufficiently low impedance to ensure that full exhalation occurs after each breath. Throughout the breathing cycle, the airway pressure is monitored using a compact pressure transducer (model XFGM-6065KPGSR, Fujikura America Inc., Santa Clara, CA) mounted at the junction of the inhale and exhale lines. This solid-state transducer was selected because it provides accurate pressure readings up to a field strength of 7 Tesla, which is important because it resides in the bore of the MRI magnet during imaging.
All solenoid valves in the system are actuated by solid-state relays, which are computer-controlled by a data input/output board (model PCI-6602, National Instruments, Austin, TX) driven by real-time instrumentation software (Labview 8.0, National Instruments, Austin, TX). This software is used to set the duration of the inspiration, breath-hold, and expiration, as well as the breathing rate. It also provides a 5V trigger signal that can be positioned anywhere in the respiratory cycle (usually at end-inspiration) to initiate MR acquisition. This software also controls the animal’s body temperature and monitors heart rate. Although it is not discussed in detail in this manuscript, the software is available as an on-line supplement to this manuscript, along with detailed plumbing and wiring diagrams, schematics of the power distribution electronics and an extensive list of components and suppliers, at http://www.civm.duhs.duke.edu/VentilatorMouseRat.
As shown in figure 1b, the ventilator assembly is compact and resides on a portable cart. During imaging, the ventilator cart is positioned at the edge of the magnet bore, connected to the animal by the inspiration and expiration lines. The ventilator cart facilitates shuttling the animal between the animal preparation area and the magnet, and can be used with other imaging systems. It is connected to an external supply of nitrogen and oxygen by extensible pneumatic lines, and to the computer and power-distribution electronics controlling valve actuation by a 25-pin cable (D-subminiature DB-25).
Gas Recapture
During hyperpolarized gas imaging, exhalation is controlled by a different expiration valve from the one used during normal nitrogen/oxygen breathing. From this valve, the exhaled 3He or 129Xe mixture is directed to a capture balloon made out of metalized mylar. By using this separate exhale valve, the balloon fills only with exhaled 3He or 129Xe (plus residual breathing gases), and minimizes dilution with air that would occur if capture also continued during normal breathing. After the imaging session, the mylar balloon is attached to a separate station that first withdraws the gas from the balloon and then compresses it into a gas cylinder for storage (figure 3). This is accomplished using a pneumatically-actuated piston (part number 6498k424, McMaster, Aurora, OH). Once the storage cylinder has reached capacity, it can be sent to a reprocessing facility so that 3He or 129Xe is separated from nitrogen, oxygen, carbon dioxide and other gases and rendered suitable for reuse in subsequent pre-clinical hyperpolarized gas studies.
Figure 3.

Apparatus for transferring the exhaled mixture contained in the recapture balloon to a pressurized cylinder. a) After the balloon is connected to the recapture system, the piston is moved up, withdrawing the content of the balloon through a check valve into the chamber of the piston. When the piston is pushed in, another check valve forces the contents of the piston to flow toward the cylinder where the recaptured gas is stored. The gas also contains air and carbon dioxide. b) Mechanical model where the casing is transparent to show the main components, and c) the device in use at our lab
Performance Metrics and Considerations
A reasonable rule of thumb for small animal ventilation is to use an approximate tidal volume of air of 1ml per minute, per gram of body mass41. A typical 25 g mouse can be ventilated at 100 breaths per minute, with a tidal volume of 0.25 ml. We use this example to further discuss the performance metrics and limitations of the ventilator design.
For any of the gas lines, the flow rate Q is given by:
| (1) |
where ΔP is the pressure drop across the entire flow path, and the relevant resistances R are those of the flow restrictor, the tubing, and the lungs. By design, we set Rrestrict≫Rtubing+Rlung, to make the approximation valid. For reference, we commonly employ flow restrictors with an impedance of 1250 cmH2O·s/ml, whereas the tubing impedance was measured to be 85 cmH2O·s/ml. The lung impedance ranges from 0.5 cmH2O·s/ml normally to 2 cmH2O·s/ml during bronchoconstriction42.
Using the oxygen line as an example, and assuming ventilation of a 25 g mouse, the inhalation and exhalation proceeds as follows. The oxygen pressure is maintained at 2 psig at the entrance of a flow restrictor with an impedance of 0.26 psi·min/ml (1092 cmH2O·s/ml), resulting in a flow rate of 7.7 ml/min when the valve is open. During the 150-ms-long inspiration, 0.019 ml is dispensed towards the mouse. At the end of inspiration, the valve closes and oxygen no longer flows through the valve. However, oxygen continues flowing through the restrictor: the pressure in the mechanical volume between the restrictor and the closed valve rises until it equilibrates with the driving pressure of 2 psig. At the beginning of the next inspiration cycle, the valve opens and this volume of compressed gas is immediately released and adds to flow occurring during next inspiration. Specifically, the mechanical volume was measured to be 0.030 ml. That volume of oxygen, originally compressed to 2 psig, expands when the oxygen valve opens to a volume of 0.034 ml at atmospheric pressure. Hence, the total volume flowing through the oxygen valve, per inspiration, is 0.019+0.034=0.053 ml. This illustrates that to mitigate the potential injury caused by the instantaneous release of compressed gas to the lungs and avoid barotrauma, the mechanical volume in which this compressed gas accumulates must be minimized, as shown for key components in figure 2. Throughout the manuscript, we use “mechanical volume” to refer to a volume that increases tidal volume. Conversely, “dead volume” corresponds to a space that decreases tidal volume.
The tidal volume of oxygen that actually reaches the lung is smaller than calculated above:
| (2) |
where TVlung is the tidal volume of oxygen delivered to the lungs, TVsupplied is the tidal volume flowing through the oxygen valve, and Vdead is the dead volume between the animal’s trachea and the junction tee of the inhale and exhale line. This dead volume must be minimized to ensure sufficient oxygenation of the animal, as illustrated in figure 1 and 2c. In general, we also employ a mixture slightly richer in oxygen, consisting of 25% O2 rather than 20%.
The operation of the nitrogen line is similar to that described for oxygen; for a 25 g mouse, it delivers 0.2 ml of nitrogen per inspiration. Since both gases emerge from high-impedance flow restrictors, their volumes simply add linearly to provide the total tidal volume delivered of 0.25 ml of breathing mixture per inspiration. As is apparent from the discussion above, the approximate tidal volume of a given gas can be delivered by identifying an adequate flow restrictor, and then making small adjustments in the driving pressure to set the volume exactly. Because of this operating principle, the ventilator can be simply changed to ventilate mice and rats, or administer different types of gas, by swapping the restrictors as outlined in table 1.
Measurement of Tidal Volume
The tidal volume emerging from the end of the endotracheal tube was determined by feeding its output into an inverted graduated cylinder in a water bath, and measuring the displaced water volume during a known number of inspirations, as illustrated in figure 4a. This method was used to show the linear increases in tidal volumes of oxygen, nitrogen, xenon and helium that are achieved by increasing the driving pressure. In addition, an important consideration is the robustness of tidal volume against increasing lung resistance. This effect was simulated by placing the output of the endotracheal tube successively deeper underwater, thereby increasing the back-pressure against which the ventilator was working. As shown in figure 4d, the tidal volume delivered remains constant over a physiologically relevant range of pressures.
Figure 4.

Measurement of tidal volume. a) A small graduated cylinder is filled with water and placed upside down in a water bath. The output of the endotracheal tube displaces water from the graduated cylinder and allows the tidal volume to be determined over a fixed number of breaths. To test robustness against impedance changes, the gas output can be placed increasingly deeper in the water bath to increase the back pressure. b) Nitrogen and oxygen tidal volumes increase in linear proportion to the driving pressure. The vertical bar within each marker shows the standard deviation of the data fitted linearly. In this example, the tidal volume of nitrogen increases with a slope of 44.0 ± 1.3 μl/psi, indicating the precision with which the tidal volume can be adjusted. c) The tidal volume dispensed remains largely constant regardless of back pressure. The vertical bar within each marker shows the standard deviation of the data fitted to a straight line. The decrease in tidal volume versus back pressure is negligible, at 0.70 ± 0.17 μl/cm H2O.
Animal Preparation and In Vivo Imaging
All procedures were approved by the Institutional Animal Care and Use Committee at Duke University. Three 6-to-8 week-old male, 20-to-25 g mice (two BALB/c mice and one C57BL/6 mouse) were anesthetized and an endotracheal tube was inserted by tracheotomy as described by Thomas et al38. Also from the same reference, the mice received tail-vein injections of methacholine for bronchoconstrictor challenge.
The animal’s endotracheal tube was connected to the ventilator providing a 150 ms inspiration, a 150 ms breath hold, and a 300 ms expiration, at a breathing rate of 100 breaths per minute. The tidal volume was composed of 0.05 ml oxygen, and 0.18 ml nitrogen replaced by helium or xenon during hyperpolarized gas imaging. Heart rate and airway pressure were monitored in real-time.
The mouse was placed into a dual-frequency quadrature birdcage coil, providing both 1H and 3He, or 1H and 129Xe signals (m2m imaging corp., Cleveland, OH). The coil containing the mouse, linked to the ventilator on a rolling cart, was moved from the animal preparation table to the magnet, and the coil was inserted into the bore. The rodent’s body temperature was measured by a rectal thermistor and fed back into a system circulating warm air in the magnet bore, maintaining the body temperature between 35 and 37 °C.
During hyperpolarized helium imaging of the first mouse, one three-dimensional image was acquired in five minutes (respiratory gated radial acquisition, FOV 20×20×32 mm, TE 0.9 ms, TR 5 ms, BW 31.25 kHz, 10,001 projections, matrix 128×128×128, resolution 156×156×250 μm3). Then, a series of two-dimensional 3He images were acquired consecutively, before, during and after methacholine challenge. These data were acquired one image every 12 seconds, for a total of four minutes (respiratory gated radial acquisition, FOV 20 × 20 mm, TE 0.9 ms, TR 5 ms, BW 31.25 kHz, 400 projections, matrix 128×128, resolution 156×156 μm2). Specifically, after acquiring two reference images, a 250 μg/kg bolus of methacholine was injected to induce severe broncho-constriction and imaging continued for 18 more images to capture the response. Throughout the imaging the peak inspiration pressure was recorded. After completion of the 3He imaging a 3D 1H image was acquired to provide an anatomical reference. This acquisition took 10 min (respiratory gated radial acquisition, FOV 40×40×40 mm, TE 0.9 ms, TR 5 ms, BW 31.25 kHz, 20,001 projections, matrix 128×128×128, resolution 313×313×313 μm3).
Hyperpolarized 129Xe images of the second mouse were acquired over 20 min (respiratory gated radial acquisition, FOV 30×30×32 mm, TE 0.9 ms, TR 5 ms, BW 31.25 kHz, 10,001 projections, matrix 128×128×32, resolution 234×234×1000 μm3). This was again followed by a 1H image of the anatomy as described above.
Discussion of Ventilator Performance
The ventilator described here is used routinely at our laboratory to ventilate mice and rats, sometimes for periods of time up to 6 hrs, depending on the complexity of the experiment. In addition, it enables the acquisition of HP gas images accumulated over hundreds of breaths, which require a highly-reproducible tidal volume and positioning of the diaphragm. Its performance for imaging 1H, 3He and 129Xe in a mouse is illustrated by figure 5. Note the good airway delineation in both the 3He and 129Xe maximum intensity projections. Similarly, the sharp lower lung border on the central slice from 3D 1H images indicates reproducible positioning of the lungs over the 4000 breath-holds required to acquire the image.
Figure 5.
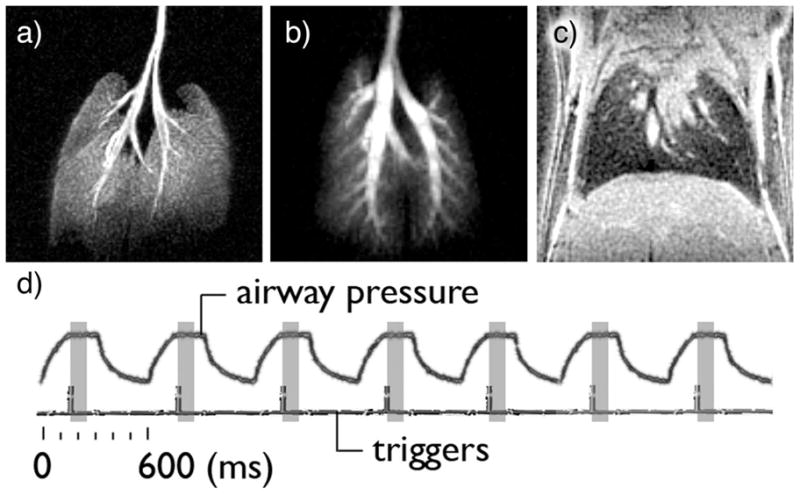
a) maximum intensity projection (MIP) of a volume image set acquired on a BALB/c mouse ventilated with oxygen and hyperpolarized 3He. b) MIP from a different Balb/C mouse, ventilated with oxygen and hyperpolarized 129Xe. c) 313-micrometer thick 1H slice through the lungs. The sharp edge at the base of the lungs suggests that the ventilator accurately delivered the same tidal volume —and repositionned the diaphragm at the same location— 4000 consecutive times, the number of breathing cycles required to acquire the image. d) The recorded airway pressure increases during the 150-ms inhalation, followed by a 150 ms-long plateau, indicating breath hold. The airway pressure decreases during the 300 ms expiration. Each breathing cycle is identical and lasts 600 ms. The imaging triggers, located 160-ms into the breathing cycle, indicate the start of the partial acquisition of the image, which lasts 100ms (shaded rectangle).
Figure 6 illustrates the importance of constant tidal volume delivery over the entire duration of the image acquisition. The left-hand-side image was acquired with a low driving pressure and large diameter restrictor. This caused the tidal volume to decrease over the course of the image acquisition because the bag holding hyperpolarized gas became less and less compliant as it emptied. Consequently, the tidal volume and the position of the lungs were not consistent during the study and the image was degraded. Conversely, the right-hand-side image was acquired with a high driving pressure and a small constrictor diameter as outlined in this paper. The driving pressure was sufficient to overcome the changes in compliance of the bag. Therefore the tidal volume remained constant and the resulting image was devoid of motion artifacts.
Figure 6.
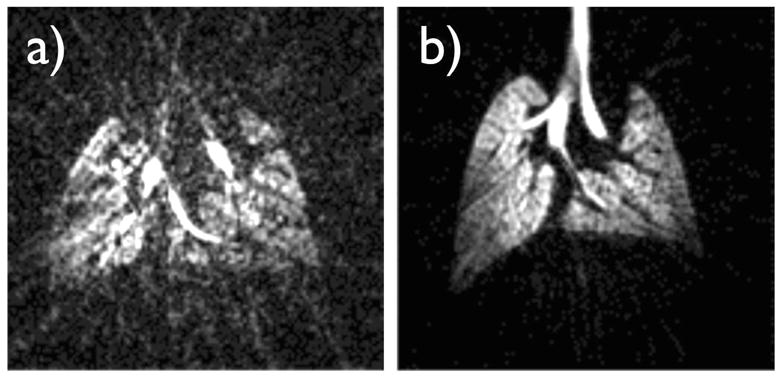
Effect of a variable tidal volume on image quality. a) A three-dimensional 3He image array of C57BL/6 mouse lungs was acquired using a respiratory gated radial acquisition over 500 breaths; the center-slice is depicted. A low driving pressure of 8.5 cm H2O was used to move hyperpolarized gas through a large diameter constrictor, which had a resistance comparable to that of the lungs. This caused the tidal volume to vary and gradually diminish over the course of 500 breaths, as the 3He supply bag depleted and became less compliant. As a consequence, the image is degraded, likely because the repositioning of the lungs was inconsistent. b) A standard high-impedance constrictor and a driving pressure of 4.5 psig were used, allowing the tidal volume to remain constant, therefore repeatedly positioning the lungs at the same location, and giving rise to a high-quality image.
A more stringent test of the ventilator is the ability to deliver a constant tidal volume when the lung impedance changes, as is the case during severe broncho-constriction. The consistency of 3He tidal volume can be assessed from the magnitude of the first data point of each radial view of k-space during imaging. This exploits an advantage of radial imaging: the center of k-space is acquired on each view and its magnitude is directly proportional to the amount of magnetization inhaled. A plot of this signal intensity is shown in Figure 7 for all the views acquired during methacholine challenge, along with the corresponding peak inspiration pressure. Note that the peak inspiration pressure increased during methacholine challenge because the lung volume was reduced while the amount of gas delivered remained fixed. The 3He signal exhibited a slow exponential decay over time, which was attributable to 3He relaxation within the bag holding hyperpolarized gas. It showed only a slight decrease (10%) during broncho-constriction, indicating the maximum fluctuation in tidal volume occurring during severe broncho-constriction.
Figure 7.

a) During a 4-minute-long challenge induced by 250 μg/kg dose of the broncho-constrictor methacholine in a mouse, a series of 20 two-dimensional images were acquired consecutively, one image every 12 second. The magnitude of the 3He signal (k=0) remains largely constant (full line), although an exponential decay is apparent due to relaxation within the Tedlar bag. The dashed line shows the peak inspiration pressure, revealing a clear increase in airway resistance after the injection of methacholine, 24 s after the start of the experiment. An image of the mouse lungs is shown before methacholine injection (left), during broncho-constriction (middle) where the larger airways have decreased in diameter (arrows), and after recovery (right).
Conclusion and Future Development
We present a constant-volume ventilator that is easy to replicate and implement. Its simplicity stems from combining oxygen, nitrogen and hyperpolarized gas distally from the animal. Long lines deliver gas to the animal’s lungs. By selecting a sufficient driving pressure and minimizing dead volume, the ventilator delivers a constant tidal volume of gas. Only off-the-shelf, inexpensive components are required, allowing robust operation and an easy scaling of the ventilator to deliver other tidal volumes. The combination of this ventilator with a simple gas recapture system should improve the cost and sustainability of preclinical hyperpolarized gas MRI.
We demonstrate that the ventilator achieves constant volume delivery, even during different stages of broncho-constriction and enables quantitative hyperpolarized gas quantitative MRI of mice and rats. Future technical developments include the addition of gaseous anesthesia and a nebulizer for aerosol delivery of drugs.
Acknowledgments
The authors gratefully acknowledge Boma Fubara and Yi Qi for animal support, Michael Foster and Erin Potts for useful discussions. Work performed at the Center for In Vivo Microscopy, a NIH/NCRR National Biomedical Technology Research (P41 RR005959) and supported in part by R01-CA-142842.
References
- 1.MacFall JR, Charles HC, Black RD, Middleton H, Swartz JC, Saam B, Driehuys B, Erickson C, Happer W, Cates GD, et al. Human lung air spaces: Potential for MR imaging with hyperpolarized He-3. Radiology. 1996;200(2):553–558. doi: 10.1148/radiology.200.2.8685356. [DOI] [PubMed] [Google Scholar]
- 2.Kauczor HU, Hofmann D, Kreitner KF, Nilgens H, Surkau R, Heil W, Potthast A, Knopp MV, Otten EW, Thelen M. Normal and abnormal pulmonary ventilation: Visualization at hyperpolarized He-3 MR imaging. Radiology. 1996;201(2):564–568. doi: 10.1148/radiology.201.2.8888259. [DOI] [PubMed] [Google Scholar]
- 3.Mugler JP, Driehuys B, Brookeman JR, Cates GD, Berr SS, Bryant RG, Daniel TM, de Lange EE, Downs JH, Erickson CJ, et al. MR imaging and spectroscopy using hyperpolarized Xe-129 gas: Preliminary human results. Magnetic Resonance in Medicine. 1997;37(6):809–815. doi: 10.1002/mrm.1910370602. [DOI] [PubMed] [Google Scholar]
- 4.de Lange EE, Mugler JP, Brookeman JR, Knight-Scott J, Truwit JD, Teates CD, Daniel TM, Bogorad PL, Cates GD. Lung air spaces: MR imaging evaluation with hyperpolarized He-3 gas. Radiology. 1999;210(3):851–857. doi: 10.1148/radiology.210.3.r99fe08851. [DOI] [PubMed] [Google Scholar]
- 5.Fain SB, Panth SR, Evans MD, Wentland AL, Holmes JH, Korosec FR, O’Brien MJ, Fountaine H, Grist TM. Early Emphysematous Changes in Asymptomatic Smokers: Detection with 3He MR Imaging. Radiology. 2006;239(3):875–883. doi: 10.1148/radiol.2393050111. [DOI] [PubMed] [Google Scholar]
- 6.Patz S, Muradian I, Hrovat MI, Ruset IC, Topulos G, Covrig SD, Frederick E, Hatabu H, Hersman FW, Butler JP. Human pulmonary imaging and spectroscopy with hyperpolarized Xe-129 at 0.2T. Academic Radiology. 2008;15(6):713–727. doi: 10.1016/j.acra.2008.01.008. [DOI] [PMC free article] [PubMed] [Google Scholar]
- 7.Cleveland ZI, Cofer GP, Metz G, Beaver D, Nouls J, Kaushik SS, Kraft M, Wolber J, Kelly KT, McAdams HP, et al. Hyperpolarized Xe-129 MR Imaging of Alveolar Gas Uptake in Humans. Plos One. 2010;5(8) doi: 10.1371/journal.pone.0012192. [DOI] [PMC free article] [PubMed] [Google Scholar]
- 8.Yablonskiy DA, Sukstanskii AL, Leawoods JC, Gierada DS, Bretthorst GL, Lefrak SS, Cooper JD, Conradi MS. Quantitative in vivo assessment of lung microstructure at the alveolar level with hyperpolarized He-3 diffusion MRI. Proceedings of the National Academy of Sciences of the United States of America. 2002;99(5):3111–3116. doi: 10.1073/pnas.052594699. [DOI] [PMC free article] [PubMed] [Google Scholar]
- 9.Viallon M, Cofer GP, Suddarth SA, Moller HE, Chen XJ, Chawla MS, Hedlund LW, Cremillieux Y, Johnson GA. Functional MR microscopy of the lung using hyperpolarized He-3. Magnetic Resonance in Medicine. 1999;41(4):787–792. doi: 10.1002/(sici)1522-2594(199904)41:4<787::aid-mrm18>3.0.co;2-4. [DOI] [PubMed] [Google Scholar]
- 10.Jalali A, Ishii M, Edvinsson JM, Guan L, Itkin M, Lipson DA, Baumgardner JE, Rizi RR. Detection of simulated pulmonary embolism in a porcine model using hyperpolarized He-3 MRI. Magnetic Resonance in Medicine. 2004;51(2):291–298. doi: 10.1002/mrm.10698. [DOI] [PubMed] [Google Scholar]
- 11.Ruppert K, Mata JF, Brookeman JR, Hagspiel KD, Mugler JP. Exploring lung function with hyperpolarized Xe-129 nuclear magnetic resonance. Magnetic Resonance in Medicine. 2004;51(4):676–687. doi: 10.1002/mrm.10736. [DOI] [PubMed] [Google Scholar]
- 12.Salito C, Aliverti A, Gierada DS, Deslee G, Pierce RA, Macklem PT, Woods JC. Quantification of Trapped Gas with CT and He-3 MR Imaging in a Porcine Model of Isolated Airway Obstruction. Radiology. 2009;253(2):380–389. doi: 10.1148/radiol.2532081941. [DOI] [PMC free article] [PubMed] [Google Scholar]
- 13.Mata JF, Altes TA, Cai J, Ruppert K, Mitzner W, Hagspiel KD, Patel B, Salerno M, Brookeman JR, de Lange EE, et al. Evaluation of emphysema severity and progression in a rabbit model: comparison of hyperpolarized He-3 and Xe-129 diffusion MRI with lung morphometry. Journal of Applied Physiology. 2007;102(3):1273–1280. doi: 10.1152/japplphysiol.00418.2006. [DOI] [PubMed] [Google Scholar]
- 14.Ruppert K, Mata JF, Brookeman JR, Hagspiel KD, Mugler JP. Exploring lung function with hyperpolarized Xe-129 nuclear magnetic resonance. Magn Reson Med. 2004;51(4):676–687. doi: 10.1002/mrm.10736. [DOI] [PubMed] [Google Scholar]
- 15.Bannier E, Nqran B, Cieslar K, Rivoire J, Heideniann RM, Gaillard S, Sulaiman AR, Canet-Soulas E, Cremillieux Y. Free Breathing Hyperpolarized He-3 Lung Ventilation Spiral MR Imaging. Investigative Radiology. 2009;44(4):185–191. doi: 10.1097/RLI.0b013e3181965d52. [DOI] [PubMed] [Google Scholar]
- 16.Black RD, Middleton HL, Cates GD, Cofer GP, Driehuys B, Happer W, Hedlund LW, Johnson GA, Shattuck MD, Swartz JC. In vivo He-3 MR images of guinea pig lungs. Radiology. 1996;199(3):867–70. doi: 10.1148/radiology.199.3.8638019. [DOI] [PubMed] [Google Scholar]
- 17.Cremillieux Y, Berthezene Y, Humblot H, Viallon M, Canet E, Bourgeois M, Albert T, Heil W, Briguet A. A combined 1H perfusion/3He ventilation NMR study in rat lungs. Magn Reson Med. 1999;41(4):645–8. doi: 10.1002/(sici)1522-2594(199904)41:4<645::aid-mrm1>3.0.co;2-v. [DOI] [PubMed] [Google Scholar]
- 18.Mitchell HW, Turner DJ, Gray PR, McFawn PK. Compliance and stability of the bronchial wall in a model of allergen-induced lung inflammation. J Appl Physiol. 1999;86(3):932–7. doi: 10.1152/jappl.1999.86.3.932. [DOI] [PubMed] [Google Scholar]
- 19.Chen XJ, Hedlund LW, Moller HE, Chawla MS, Maronpot RR, Johnson GA. Detection of emphysema in rat lungs by using magnetic resonance measurements of 3He diffusion. Proc Natl Acad Sci U S A. 2000;97(21):11478–81. doi: 10.1073/pnas.97.21.11478. [DOI] [PMC free article] [PubMed] [Google Scholar]
- 20.Spector ZZ, Emami K, Fischer MC, Zhu J, Ishii M, Yu J, Kadlecek S, Driehuys B, Panettieri RA, Lipson DA, et al. A small animal model of regional alveolar ventilation using (HPHe)-He-3 MRI. Academic Radiology. 2004;11(10):1171–1179. doi: 10.1016/j.acra.2004.08.001. [DOI] [PubMed] [Google Scholar]
- 21.Mansson S, Deninger AJ, Magnusson P, Pettersson G, Olsson LE, Hansson G, Wollmer P, Golman K. 3He MRI-based assessment of posture-dependent regional ventilation gradients in rats. J Appl Physiol. 2005;98(6):2259–2267. doi: 10.1152/japplphysiol.00245.2004. [DOI] [PubMed] [Google Scholar]
- 22.Chen BT, Brau AC, Johnson GA. Measurement of regional lung function in rats using hyperpolarized 3helium dynamic MRI. Magn Reson Med. 2003;49(1):78–88. doi: 10.1002/mrm.10336. [DOI] [PubMed] [Google Scholar]
- 23.Hedlund L, Deitz J, Nassar R, Herfkens R, Dahlke J, Vock P, Kubek R, Charles C, Effmann E, Putman C. OPTIMIZING QUALITY OF MAGNETIC-RESONANCE IMAGES BY SCAN SYNCHRONOUS VENTILATION. Investigative Radiology. 1985;20(6):S47–S47. [Google Scholar]
- 24.Hedlund LW, Deitz J, Nassar R, Herfkens R, Vock P, Dahlke J, Kubek R, Effmann EL, Putman CE. A VENTILATOR FOR MAGNETIC-RESONANCE-IMAGING. Investigative Radiology. 1986;21(1):18–23. doi: 10.1097/00004424-198601000-00003. [DOI] [PubMed] [Google Scholar]
- 25.Hedlund LW, Johnson GA, Karis JP, Effmann EL. Mr Microscopy Of The Rat Thorax. Journal of Computer Assisted Tomography. 1986;10(6):948–952. doi: 10.1097/00004728-198611000-00010. [DOI] [PubMed] [Google Scholar]
- 26.Gewalt SL, Glover GH, Hedlund LW, Cofer GP, MacFall JR, Johnson GA. MR microscopy of the rat lung using projection reconstruction. Magn Reson Med. 1993;29(1):99–106. doi: 10.1002/mrm.1910290117. [DOI] [PubMed] [Google Scholar]
- 27.Shattuck MD, Gewalt SL, Glover GH, Hedlund LW, Johnson GA. MR microimaging of the lung using volume projection encoding. Magn Reson Med. 1997;38(6):938–42. doi: 10.1002/mrm.1910380613. [DOI] [PubMed] [Google Scholar]
- 28.Schmiedeskamp J, Elmers HJ, Heil W, Otten EW, Sobolev Y, Kilian W, Rinneberg H, Sander-Thommes T, Seifert F, Zimmer J. Relaxation of spin polarized He-3 by magnetized ferromagnetic contaminants Part III. European Physical Journal D. 2006;38(3):445–454. [Google Scholar]
- 29.Fitzsimmons W, Tankersl Ll, Walters GK. Nature Of Surface-Induced Nuclear-Spin Relaxation Of Gaseous He3. Physical Review. 1969;179(1):156. [Google Scholar]
- 30.Chen XJ, Chawla MS, Hedlund LW, Moller HE, MacFall JR, Johnson GA. MR microscopy of lung airways with hyperpolarized He-3. Magnetic Resonance in Medicine. 1998;39(1):79–84. doi: 10.1002/mrm.1910390113. [DOI] [PubMed] [Google Scholar]
- 31.Hedlund LW, Cofer GP, Owen SJ, Johnson GA. MR-compatible ventilator for small animals: computer-controlled ventilation for proton and noble gas imaging. Magnetic Resonance Imaging. 2000;18(6):753–759. doi: 10.1016/s0730-725x(00)00154-5. [DOI] [PubMed] [Google Scholar]
- 32.Model MRI-1. CWE Inc; Ardmore, PA: [Google Scholar]
- 33.Dugas JP, Garbow JR, Kobayashi DK, Conradi MS. Hyperpolarized He-3 MRI of mouse lung. Magnetic Resonance in Medicine. 2004;52(6):1310–1317. doi: 10.1002/mrm.20300. [DOI] [PubMed] [Google Scholar]
- 34.de Alejo RP, Ruiz-Cabello J, Villa P, Rodriguez I, Perez-Sanchez JM, Peces-Barba G, Cortijo M. A fully MRI-compatible animal ventilator for special-gas mixing applications. Concepts in Magnetic Resonance Part B-Magnetic Resonance Engineering. 2005;26B(1):93–103. [Google Scholar]
- 35.Chen BT, Yordanov AT, Johnson GA. Ventilation-synchronous magnetic resonance microscopy of pulmonary structure and ventilation in mice. Magn Reson Med. 2005;53(1):69–75. doi: 10.1002/mrm.20307. [DOI] [PubMed] [Google Scholar]
- 36.Driehuys B, Cofer GP, Pollaro J, Mackel JB, Hedlund LW, Johnson GA. Imaging alveolar-capillary gas transfer using hyperpolarized 129Xe MRI. Proc Natl Acad Sci. 2006;103(48):18278–18283. doi: 10.1073/pnas.0608458103. [DOI] [PMC free article] [PubMed] [Google Scholar]
- 37.Thomas A, Nouls J, Driehuys B, Voltz J, Fubara B, Foley J, Bradbury A, Zeldin D. Ventilation Defects Observed with Hyperpolarized 3He Magnetic Resonance Imaging in a Mouse Model of Acute Lung Injury. American Journal of Respiratory Cell and Molecular Biology. 2010 doi: 10.1165/rcmb.2009-0287OC. [DOI] [PMC free article] [PubMed] [Google Scholar]
- 38.Thomas AC, Potts EN, Chen BT, Slipetz DM, Foster WM, Driehuys B. A robust protocol for regional evaluation of methacholine challenge in mouse models of allergic asthma using hyperpolarized He-3 MRI. Nmr in Biomedicine. 2009;22(5):502–515. doi: 10.1002/nbm.1362. [DOI] [PMC free article] [PubMed] [Google Scholar] [Research Misconduct Found]
- 39.Mistry NN, Thomas A, Kaushik SS, Johnson GA, Driehuys B. Quantitative Analysis of Hyperpolarized He-3 Ventilation Changes in Mice Challenged With Methacholine. Magnetic Resonance in Medicine. 2010;63(3):658–666. doi: 10.1002/mrm.22311. [DOI] [PMC free article] [PubMed] [Google Scholar]
- 40.Hedlund LW, Moller HE, Chen XJ, Chawla MS, Cofer GP, Johnson GA. Mixing oxygen with hyperpolarized He-3 for small-animal lung studies. Nmr in Biomedicine. 2000;13(4):202–206. doi: 10.1002/1099-1492(200006)13:4<202::aid-nbm645>3.0.co;2-j. [DOI] [PubMed] [Google Scholar]
- 41.Lindstedt SL. Pulmonary Transit-Time And Diffusing-Capacity In Mammals. American Journal of Physiology. 1984;246(3):R384–R388. doi: 10.1152/ajpregu.1984.246.3.R384. [DOI] [PubMed] [Google Scholar]
- 42.Wagers S, Lundblad L, Moriya HT, Bates JHT, Irvin CG. Nonlinearity of respiratory mechanics during bronchoconstriction in mice with airway inflammation. Journal of Applied Physiology. 2002;92(5):1802–1807. doi: 10.1152/japplphysiol.00883.2001. [DOI] [PubMed] [Google Scholar]