

Abstract
The fgui R package is designed for developers of R packages, to help rapidly, and sometimes fully automatically, create a graphical user interface for a command line R package. The interface is built upon the Tcl/Tk graphical interface included in R. The package further facilitates the developer by loading in the help files from the command line functions to provide context sensitive help to the user with no additional effort from the developer. Passing a function as the argument to the routines in the fgui package creates a graphical interface for the function, and further options are available to tweak this interface for those who want more flexibility.
Keywords: GUI, interface, fgui
1. Introduction
There have been many efforts to create packages to make graphical interfaces for R (R Development Core Team 2008) that make R appeal to a broader audience. These are typically built on low level packages that provide interfaces to widget libraries. The Tcl/Tk implementation with the tcltk package (Dalgaard 2001) is included with Microsoft Windows and Linux versions of R by default, and is only slightly more difficult to install on a Mac. Thus there is no extra configuration or installation necessary by the user, and so it is our widget library of choice. Other packages include the gWidgets package that aims to provide a standard programmatic interface with different widget libraries (Verzani 2007). These have been used to build feature-rich interfaces that expose some of the functionality of R to users that do not want to use the command line for everything. Such menu-driven graphical interfaces include R Commander (Rcmdr, Fox 2005) and pmg (Verzani and Noel 2008).
Rather than provide a universal graphical user interface (GUI), we created an R package that eases the creation of a basic interface by automating the repetitive tasks in creating such an interface. There are several packages that aim to make this easier for the developer. The package rpanel (Bowman, Crawford, Alexander, and Bowman 2007) provides one such graphical toolkit aimed at interactive plots. The aim of the fgui package is to make it as simple as possible for a developer to create a basic graphical interface to a command-line function. The main graphical routine in the fgui package behaves similarly to the ggenericwidget routine in gWidgets, using the names of function arguments to create widgets. The fgui is tailored towards creating a slightly different interface than the ggenericwidget routine, as the examples below will illustrate. The fgui package is built on the tcltk package (Dalgaard 2001), and so allows for further customization later using routines in the tcltk package for those who want more complicated interfaces, but wish to use some of the more automated creation routines. The package also provides a menu interface “launchpad” to link together graphical interfaces for multiple functions with no additional effort. It is available from the Comprehensive R Archive Network at http://CRAN.R-project.org/.
It is also tedious after writing help documentation to include context sensitive help into a GUI, and keep it synced properly with the written documentation. We avoid this situation by parsing the written help documentation and using it to provide context sensitive help for each argument. Thus developers need to write and maintain only one set of documentation.
2. Using the main fgui routines
The best way to learn how to use the fgui R package is to look at the examples included in the package's documentation. The R package fbati (Hoffmann et al. 2009) uses this package to create several graphical interfaces, one of which is shown in Figure 1. Here we describe how to turn a command-line function into a graphical interface with a simple command.
Figure 1.

A more advanced graphical interface from the fbati R package (Hoffmann et al. 2009) built using fgui. Shown in Linux.
2.1. A simple example
Suppose that we have a command line function that does something; for example, suppose we want to do a simple sample size calculation. The command line function might look something like the following
R> ss <- function(alpha = 0.05, beta = 0.8, sigma = 2, effect_size = 0.5) + ceiling((qnorm(1 - alpha / 2) + qnorm(1 - beta)) ˆ 2 * sigma ˆ 2 / + effect_size ˆ 2)
Each argument to the function (i.e., alpha, beta) will be translated into a widget in our graphical interface, and the value returned from the function will become the output in our graphical interface. The simplest power interface could be generated simply by the command
R> guiv(ss)
shown in Figure 2. By pressing the OK button, the user invokes the ss function that we have provided. The user can also press the cancel button to close the interface without running the code.
Figure 2.

Default, basic graphical interface for the sample size function. Shown in Microsoft Windows XP.
A modal dialogue is chosen by default. With a modal dialogue, the R session will pause until the user is done interacting with the graphical interface, and the return value can be stored in an object of the users choosing. With a non-modal dialogue, the return value cannot be stored, but can be accessed later by guiv. A modal dialogue is useful when one wants to force the user to interact with your graphical interface before continuing. However, it prevents the user from using R until the graphical interface is terminated, so the user would not be able to do any intermediate calculations they might want to input into your graphical interface using the R command line. Additionally, a modal dialogue can be confusing to the user, as the command line becomes inactive until the window is closed. Hence a message is printed out to the user describing how to proceed. When desired, the window can be set to be non-modal by setting the argument modal = FALSE. In that case, functionality will return to the command prompt.
This provides a usable interface, but we can improve on it. The type of widget is by default a text entry for each argument, and this can be changed by passing arguments to the function. For instance, to create a slider interface with ranges for the parameter, we can run the command
R> gui(ss,
+ argSlider = list(alpha = c(0, 0.1, 0.001), beta = c(0, 1, 0.01),
+ sigma = c(0, 10), effect_size = c(0, 10), output = c(0, 10000, 1)),
+ exec = NULL,
+ argText = list(output = “sample size”),
+ cancelButton = FALSE,
+ title = “Sample size calculator”,
+ callback = guiExec)
The first thing to note in this second example is that here we use the function gui instead of guiv, just to show the difference of the two functions. This returns the values in the GUI of the arguments of the function ss as a list, rather than the output. Thus the values for a necessary sample size would be returned, rather than the sample size as was done before. The default in this case is to create an output control that will present the output of the developers function. Thus gui is designed with default values for when the output of the function is to be presented in the GUI, whereas guiv is designed with default arguments to return output to the user. The functions gui and guiv take identical arguments, but differ on their return value, and a few default argument values. A default setting of the gui routine is to create an output text entry, where the output of the function will be displayed as the user executes the function. The default is not to close when the OK button is pressed for gui, unlike guiv where the value is immediately returned. However, here we disable the execute button altogether by setting exec = NULL. We then specify that the output should instead be the form of a slider, by referring to it with output. This is specified along with the function arguments in the argSlider parameter. This parameter should be set to a list consisting of elements with the same name as the function arguments, having a vector of the minimum, maximum and step size for each as in the code above. Finally, we set the callback to guiExec, a function in the fgui R package. We will discuss the callback further in a moment; it forces the execution of the function ss, and displays the results. So instead of pressing the OK button, the function is executed whenever any of the slider values change. Lastly, the argText parameter controls the text shown in the label next to the component, i.e., the output component is labeled by sample size, as shown in Figure 3.
Figure 3.
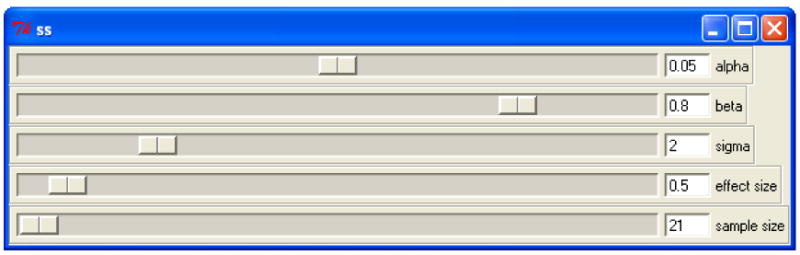
A better sample size interface, created with mgui to also provide a menu interface for multiple command-line functions. Shown in Microsoft Windows XP.
The usage of sliders, as in this example, is particularly well suited for power and sample size interfaces. Besides text entries and sliders, the package also supports an edit box, a widget for a small set of options, a widget for a large set of options (i.e., list) that can be modified, and a widget for choosing files. These are all created in a similar fashion, and are detailed in the package documentation.
2.2. Further tweaking
While this may suit many users, a user may find that they need more control over the package. For example, setting list values for a user to choose from when a certain option is pressed. This can be accomplished with the callback function, a function that takes one argument, which is the argument that was modified by the user. Argument values can be accessed and changed via the guiGetValue(s) and guiSetValue(s,value) functions, respectively, where s is the name of the parameter in the original function (i.e., alpha in the example above). Alternatively, the function guiGetAllValues() returns a list of the current values of all of the widgets. For example, setting the callback argument to gui to be the function function(s) print(guiGetValue(s)) would print out the value of the argument when modified. In the example above, guiExec causes the passed function to be evaluated at the argument values. A useful example in this case would be handling when the sample size changes (the output argument in the callback function) to solve for one of the other parameters, i.e., beta. A further detailed example of how one might want to use the callback function is provided in Section 2.4.
If we want to customize the output further or change the default values, then we could write another function, such as
R> ssPretty <- function(alpha = 0.05, beta = 0.9, sigma = 2,
+ effect_size = 0.5) paste(“The sample size needed is”,
+ ss(alpha, beta, sigma, effect_size))
Then we could create the GUI with the following
R> gui(ssPretty, helpsFunc = “ss”)
This allows us to use the help documentation from the ss function, had this been a real R package.
Further customization is described in the package documentation, such as setting the griding order for more complicated interfaces. GUI interfaces can also be nested, i.e., a function called from gui can recurse into calling a separate gui call. This is described in detail in the documentation. Fine-grained customization can also be done via routines in the tcltk package. The highest level of customization of the R package could be done by including and modifying pieces of the source code of the fgui package in one's own R package.
2.3. A “launchpad” graphical interface for multiple functions
Now suppose that we have a full R package with multiple functions, and we would like to present the user with a menu-driven interface to choose several of our functions. This is done by simply using the command mgui instead of gui. The arguments are exactly the same, with the exception that now the title argument takes a vector of strings corresponding to the menu, as in the following code. First we create a menu with some random number generators.
R> mgui(rgeom, title = c(“Random”, “Geometric”))
R> mgui(rbinom, title = c(“Random”, “Binomial”))
The corresponding graphical interfaces would have been created with
R> gui(rgeom, title = “Geometric”)
R> gui(rbinom, title = “Binomial”)
Then we can add a separator
R> fguiNewMenu(c(“Random”,“SEPARATOR”))
Then we can add in some continuous random number generators.
R> mgui(rnorm, title = c(“Random”, “Normal”))
R> mgui(runif, title = c(“Random”, “Uniform”))
Finally, we can add the function that we have created.
R> mgui(ss,
+ argSlider = list(alpha = c(0, 0.1, 0.001), beta = c(0, 1, 0.01),
+ sigma = c(0, 10), effect_size = c(0, 10), output = c(0, 10000, 1)),
+ exec = NULL, argText = list(output = “sample size”),
+ cancelButton = FALSE,
+ title = c(“Misc”, “Sample Size”),
+ callback = guiExec)
In this last piece of code, the only parameter changed from before is the title argument. This creates the interface shown in Figure 3.
The file menu seen in the figure is generated by default, and allows the output in the console to be saved in a text file. This console can be written to, for example, with the command fguiWindowPrint(“Hello world!”). Thus creating a menu driven interface to launch graphical interfaces for multiple functions in fgui is really no harder than creating each interface.
2.4. An advanced example with callback
We provide one more example of how to use the R package to create a somewhat more advanced and customized graphical interface. Here we are focused more on creating the interface, rather than just running a function. Ultimately, we want a user to be able to fit a linear regression with the lm routine, and give them the result. But we want to do more than just that. We want the user to be able to simulate a dataset with the press of a button in case they want to just test out our routine. We additionally want to create some scatter plots, and allow the user to get some summary output, if they do not want to further use R. We would probably want to add even more things, such as fit diagnostics, etc., but we wish to keep the example sufficiently short. Since we want the graphical interface to do more than just one function alone, we add arguments to the function passed to the guiv routine that are used only to create the graphical interface, and not to be passed into the lm routine. The final interface that we are aiming for is give in Figure 4. We have the following code that we will pass to the guiv function.
Figure 4.
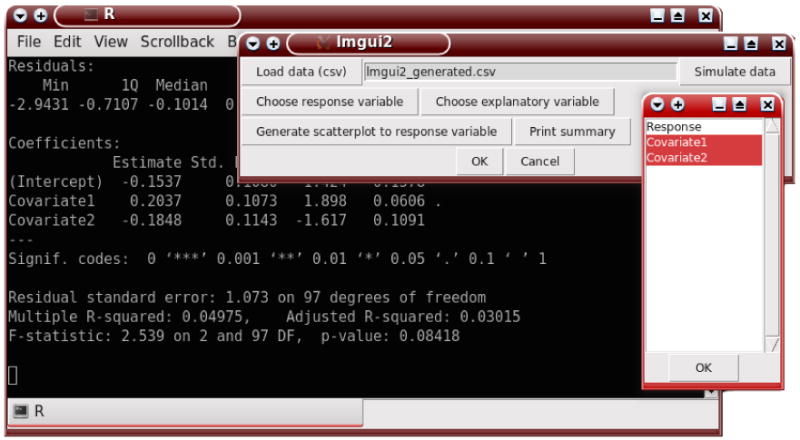
The GUI for the advanced example interface for a linear regression. Shown in Linux.
R> lmgui2 <- function(csvFilename, simData, response, explanatory,
+ scatter, summary)
+ {
+ data <- guiGetSafe(“PERSONAL_dataset”)
+ if(class(data)[1] != “data.frame”) stop(“Data must be loaded.”)
+ if(length(response) == 0) stop(“Must specify a response.”)
+ if(length(explanatory) == 0) stop(“Explanatory variable expected.”)
+ modelStr <- paste(response, “∼”, paste(explanatory, collapse = “+”))
+ return(lm(formula = modelStr, data = data))
+ }
In this function we will make extensive use of the callback function. The simData, scatter, and summary parameters will only be used as place holders for construction of the GUI. They will not be evaluated, and will only be used in the callback function. The body of the functions code first loads the data from what can be thought of as a global variable. This globably variable will be set by the callback function. Then some error checking is done, and the lm routine is run. Note the use of the stop function in the code above. Whenever an error is produced, a message box with the error will be presented to the user. We can enter the following code to handle the callback routine.
R> lmgui2Callback <- function(arg) {
+ if(arg == “csvFilename”) {
+ csvFilename_press()
+ } else if(arg == “simData”) {
+ simData_press()
+ } else if(arg == “scatter”) {
+ scatter_press()
+ } else if(arg == “summary”) {
+ summary_press()
+ }
+ }
In the callback function given below, the arg value represents what function argument was interacted with corresponding to the widget created for it, e.g., csvFilename. When the Load data (csv) button is pressed, and a dataset is chosen, then the lmgui2Callback routine is executed with arg set to “csvFilename”, the name of the argument in the original lmgui2 function. Then the following function is executed
R> csvFilename_press <- function()
+ {
+ data <- read.csv(guiGetValue(“csvFilename”))
+ guiSet(“PERSONAL_dataset”, data)
+ setListElements(“response”, names(data))
+ setListElements(“explanatory”, names(data))
+ }
Our code reads in the dataset into PERSONAL_dataset, which can be thought of as a global variable. Then we set the possible response and explanatory variables. The setListElements takes two arguments, the first being the argument in the lmgui2 function that we are using that will be in the argList parameter to fgui. The second argument is the possible values that it might take; here we set this to be the names of the dataset. Alternatively, we want the user to be able to have a simulated dataset, which is handled with the next callback.
R> simData_press <- function() {
+ set.seed(13)
+ library(“MASS”)
+ data <- data.frame(mvrnorm(n = 100, mu = c(0, 0, 0),
+ Sigma = matrix(c(1, 0.3, 0, 0.3, 1, 0.3, 0, 0.3, 1), nrow = 3)))
+ names(data) <- c(“Response”, “Covariate1”, “Covariate2”)
+ write.csv(data, “lmgui2_generated.csv”, row.names = FALSE)
+ guiSetValue(“csvFilename”, “lmgui2_generated.csv”)
+ lmgui2Callback(“csvFilename”)
+ }
This routine generates a random set of data, and then writes this dataset to disk. The value of csvFilename is then set to the filename that was written out to disk. The data is loaded by rerunning the callback routine as if the csvFilename button had been pressed.
Thirdly, the scatter argument is run when the scatter button has been pressed.
R> scatter_press <- function() {
+ data <- guiGetSafe(“PERSONAL_dataset”)
+ response <- guiGetValue(“response”)
+ wh.response <- which(names(data) == response)
+ if(length(wh.response) != 1)
+ stop(“One and only one response must be chosen.”)
+ if(class(data)[1] != “data.frame”)
+ stop(“Data must be loaded.”)
+ par(mfrow = rep(ceiling(sqrt(ncol(data) - 1)), 2))
+ for(i in setdiff(1:ncol(data), wh.response))
+ plot(data[[i]], data[[wh.response]],
+ xlab = names(data)[i], ylab = names(data)[wh.response])
+ }
This function first gets the dataset that has been loaded in previously and stored in the object PERSONAL_dataset. Behind the scenes, when the response widget was pressed, it was set by the user to some value. Here, this can be only one value, but in general, a user could select multiple values if desired. Then we just generate multiple scatterplots with this value as the response, and all others as a covariate.
R> summary_press <- function()
+ print(summary(guiExec()))
Lastly, the summary argument is run when the corresponding button is pressed. The guiExec() function returns the value of the function at the current arguments, so it returns the result of the lm routine at the current arguments. Then we use the S3 generic function summary to print a summary of the current fit.
All that is left is to link the lmgui2 and lmgui2Callback functions together in a call to guiv.
R> fit <- guiv(lmgui2,
+ argFilename = list(csvFilename = NULL),
+ argList = list(response = NULL, explanatory = NULL),
+ argCommand = list(simData = NULL, scatter = NULL, summary = NULL),
+ callback = lmgui2Callback,
+ argGridOrder = c(1, 1, 2, 2, 3, 3),
+ argText = c(csvFilename = “Load data (csv)”,
+ simData = “Simulate data”,
+ response = “Choose response variable”,
+ explanatory = “Choose explanatory variable”,
+ scatter = “Generate scatterplot to response variable”,
+ summary = “Print summary”))
In the argCommand parameter, each is set to NULL. These could instead be set to functions, which would be executed when pressed. We instead handle everything in the callback routine. The last thing special to note from this is the argGridOrder parameter. This corresponds to the arguments in the lmgui2 function, and handles how they are gridded. For instance, the widget to load the dataset and that to simulate it will be placed on the same line because they both correspond to 1, rather than the default of the first being set to 1 and the second to 2. This continues with the next two widgets being on the same line, and the last 2 being put on an additional line.
Although it makes no sense here, if we had wanted to provide a list values for the response, say c(“r1”, “r2”, “r3”) to choose from, we would alter the fourth line in the code above to be
+ argList = list(response = c(“r1”, “r2”, “r3”), explanatory = NULL),
2.5. A note on S3 generic functions
The gui function does not generally work on S3 generic functions, but there is generally a simple workaround. For example, suppose we wish to create a graphical interface for the mean function. One should avoid the S3 generic function and instead call the function specific to that class. For example, instead of running gui(mean), one should instead run it with gui(mean.default), assuming that is what is wanted. A prettier interface could be created with
R> gui(mean.default,
+ argText = list(output = “mean”),
+ argOption = list(trim = c(“FALSE”, “TRUE”), na.rm = c(“TRUE”, “FALSE”)))
and is shown in Figure 5. The interface supports built in datasets, so, for example, one could enter rivers in the resulting text entry, and that dataset included in R would be used.
Figure 5.

A GUI for the mean function. Shown in Mac OS X.
3. Lower level Tcl/Tk routines in fgui
We open up some of the more internal functions for advanced users, but do not generally recommend them unless the user has previous experience with the tcltk package. However, for users that just want to use the routines in fgui to facilitate the creation and handling of Tcl/Tk widgets, we provide a lower level interface to the tcltk R package. For example, the default text entry option created by the gui routine could be created by a call to guiTextEntry. Essentially all of the graphical widgets we have shown before have corresponding low-level routines that were used to create them. These can be created, and then gridded. We have the following simple example of creating a database GUI, as shown in Figure 6. In this example we are still creating objects with the fgui package, but we take much more control of how they are placed and displayed to the user.
Figure 6.

A GUI built on lower level functions. Shown in Mac OS X.
We can create and title a Tcl/Tk form via
R> library(“tcltk”)
R> fr <- tktoplevel()
R> tkwm.title(fr, “Database App”)
which will show a window to the user. That is, it creates an empty main window in which we will create and place all of our graphical widgets. Most widgets are not placed on the form automatically, so that the user can place them anywhere, which will be done later. The exception is the guiTextEntry, which must be gridded due to how it is created. Most of the time you will want to put each in a separate containing frame, but for some multi-column alignments you may not want to do this. We begin by putting on a load button on, similar to specifying things as a file loading widget before. Then we place a slider for the record number.
R> fname <- guiFilename(sframe = fr, text = “Load database…”)
R> tkgrid(fname$guiObject)
R> tkgrid.configure(fname$guiObject, sticky = “nws”)
R> rec <- guiSlider(sframe = fr, text = “Database Record”, + default = 1, min = 1, max = 100, step = 1)
R> tkgrid(rec$guiObject)
R> tkgrid.configure(rec$guiObject, sticky = “nws”)
A frame can hold any type of widgets, even other frames. Thus very complicated griding is possible, as we will demonstrate. The sframe argument either takes the result of the tktoplevel() function, i.e., fr created above, or the result of any guiFrame call (example below). The argument text is always the label of the widget, and default the default value. The second, third, fifth, and sixth lines in the code above are routines from the tcltk that handle griding and displaying the objects. Next, to make this routine look nicer, we will want the next components to be narrower than they would be usually. We can change the default widths or heights of the guiEdit widgets and guiTextEntry widgets with
R> guiSet(“EDIT_WIDTH”, 40)
R> guiSet(“EDIT_HEIGHT”, 3)
R> guiSet(“ENTRY_WIDTH”, 30)
These routines also work with the gui and fgui routines above; however, here the values set only affect controls created after they are set. For the next part, we want to create two columns. This is achieved by first creating one frame, and then placing two frames inside of that frame.
R> fr1 <- guiFrame(sframe = fr)
R> tkgrid(fr1)
R> fr1.1 <- guiFrame(sframe = fr1)
R> fr1.2 <- guiFrame(sframe = fr1)
R> tkgrid(fr1.1, fr1.2)
R> tkgrid.configure(fr1.1, sticky = “n”)
For the left hand frame, we'll first put in two text entries. Remember that text entries are already gridded.
R> teName1 <- guiTextEntry(sframe = fr1.1, text = “First Name”, + default = “John”)
R> teName2 <- guiTextEntry(sframe = fr1.1, text = “Last Name”, + default = “Doe”)
R> tkgrid.configure(teName1$guiObject, sticky = “nes”)
R> tkgrid.configure(teName2$guiObject, sticky = “nes”)
Next, we will put in two options, right next to each other. We first put in a frame, and then we put in both options in the frame
R> fr1.1.1 <- guiFrame(sframe = fr1.1)
R> tkgrid(fr1.1.1)
R> tkgrid.configure(fr1.1.1, sticky = “news”)
R> opGender <- guiOption(sframe = fr1.1.1, text = “Gender”, + choices = c(“Female”, “Male”) )
R> opGlasses <- guiOption(sframe = fr1.1.1, text = “Glasses”, + choices = c(“No”, “Yes”) )
R> tkgrid(opGender$guiObject, opGlasses$guiObject)
R> tkgrid.configure(opGender$guiObject, sticky = “nws”)
R> tkgrid.configure(opGlasses$guiObject, sticky = “nes”)
Lastly, we want to put an edit box on the right hand side.
R> ed <- guiEdit(sframe = fr1.2, text = “Notes”)
R> tkgrid(ed$guiObject)
4. Discussion
This package simplifies the creation of graphical interfaces for R packages. This R package was written after recognizing that many routines have a lot of repetitive code and context-sensitive help information, e.g., pbatR (Hoffmann and Lange 2006); many of the routines in that package were modified for usage in this package. When creating the graphical interface for the R package fbati (Hoffmann et al. 2009) as shown in Figure 1, we found fgui added a graphical interface in a fraction of the time than it took to create the graphical interface for the R package pbatR.
Acknowledgments
Funding was provided in part by grants MH17119, ES007142, and R01-MH059532. We would also like to thank the reviewers for their comments and suggestions.
Contributor Information
Thomas J. Hoffmann, Email: tjhoffm@gmail.com.
Nan M. Laird, Email: laird@hsph.harvard.edu.
References
- Bowman A, Crawford E, Alexander G, Bowman R. rpanel: Simple Interactive Controls for R Functions Using the tcltk package. Journal of Statistical Software. 2007;17(9):1–18. URL http://www.jstatsoft.org/v17/i09/
- Dalgaard P. A Primer on the R-Tcl/Tk Package. R News. 2001;1(3):27–31. URL http://CRAN.R-project.org/doc/Rnews/
- Fox J. The R Commander: A Basic Statistics Graphical User Interface to R. Journal of Statistical Software. 2005;14(9):1–42. URL http://www.jstatsoft.org/v14/i09/
- Hoffmann T, Lange C. P2BAT: A Massive Parallel Implementation of PBAT for Genome-Wide Association Studies in R. Bioinformatics. 2006;22(24):3103–3105. doi: 10.1093/bioinformatics/btl507. [DOI] [PubMed] [Google Scholar]
- Hoffmann TJ, Lange C, Vansteelandt S, Laird NM. Gene-Environment Interaction Tests for Dichotomous Traits in Trios and Sibships. Genetic Epidemiology. 2009 doi: 10.1002/gepi.20421. Forthcoming. [DOI] [PMC free article] [PubMed] [Google Scholar]
- R Development Core Team. R: A Language and Environment for Statistical Computing. R Foundation for Statistical Computing; Vienna, Austria: 2008. URL http://www.R-project.org/ [Google Scholar]
- Verzani J. An Introduction to gWidgets. R News. 2007;3(3):26–33. URL http://CRAN.R-project.org/doc/Rnews/
- Verzani J, Noel Y. pmg : Poor Man's GUI. R package version 0.9-38. 2008 URL http://CRAN.R-project.org/package=pmg.