Abstract
It is becoming increasingly clear that characterization of the protein ensemble – the collection of all conformations of which the protein is capable – will be a critical step in developing a full understanding of the linkage between structure, dynamics and function. X-ray solution scattering in the small angle (SAXS) and wide-angle (WAXS) regimes represents an important new window to exploring the behavior of ensembles. The characteristics of the ensemble express themselves in x-ray solution scattering data in predictable ways. Here we present an overview of the effect that structural diversity intrinsic to protein ensembles has on scattering data. We then demonstrate the observation of these effects in scattering from four molecular systems; myoglobin; ubiquitin; alcohol dehydrogenase; and HIV protease; and demonstrate the modulation of these ensembles by ligand binding; mutation and environmental factors. The observations are analyzed quantitatively in terms of the average spatial extent of structural fluctuations occurring within these proteins under different experimental conditions. The insights which these analyses support are discussed in terms of the function of the various proteins.
Introduction
The Protein Ensemble
It is becoming increasingly clear that characterization of the protein ensemble – the collection of all conformations which the protein is capable of exhibiting in its native environment – will be a critical step in developing a full understanding of the linkage between structure, dynamics and function. In solution, proteins explore low energy pathways that have evolved to provide linkages among functional conformations1 thereby ensuring the ensemble has a high abundance of functionally relevant states. Molecular recognition is now often thought of in terms of 'conformational selection' 2,3 in which the ligand selects the most favored conformation from the ensemble and, upon binding, induces a redistribution of the relative abundances of conformations within the ensemble.
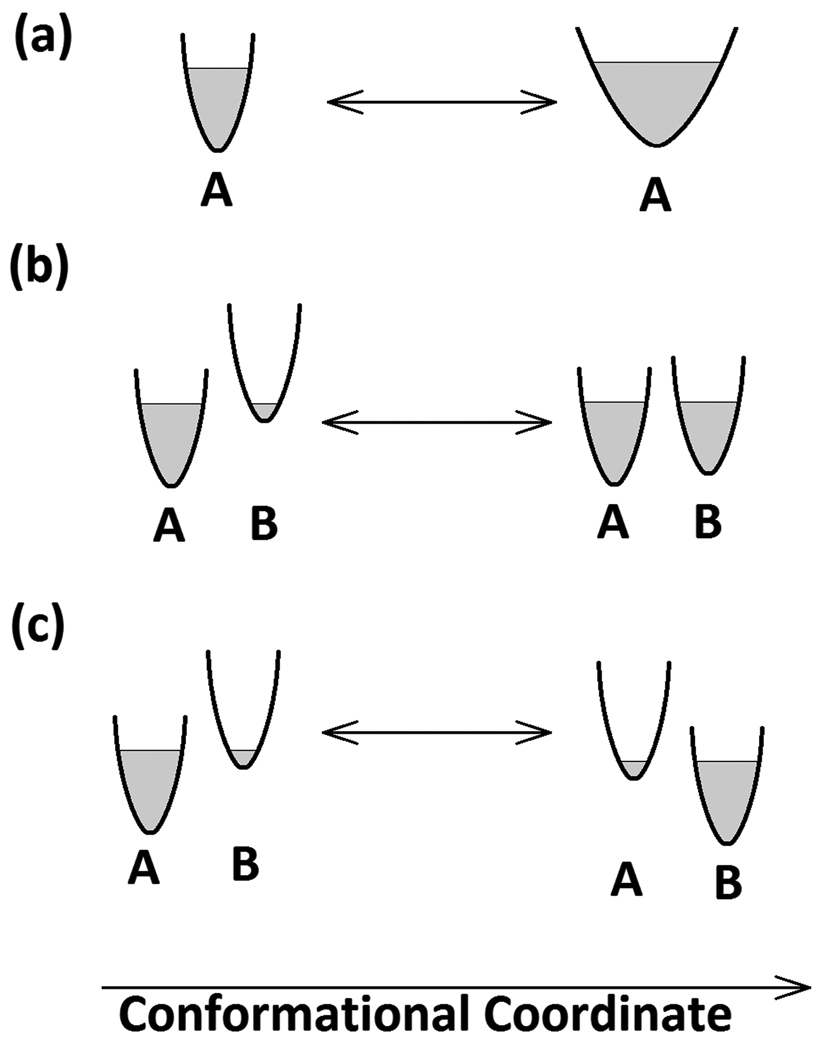
The relative abundances of each conformation of the ensemble are dictated by the form of the energy landscape within which they exist4, the landscape implicitly defining the breadth and form of the ensemble. The simplest ensembles might, for instance, be dominated by a single highly abundant conformation and include only those closely related conformations readily achieved through thermal fluctuations about the dominant conformation. But many proteins appear to have complex ensembles encompassing multiple distinct conformations with relative abundances that are responsive to many different environmental factors5. Ensembles can be modulated through ligand binding; the effect of mutations; changes in environmental factors such as temperature, pH, protein concentration and ionic strength. The result of ligand binding to a protein is often described as a conformational change, but it may be more accurately depicted as a change in the relative abundances of conformations within the ensemble. Figure 1 includes simple diagrams illustrating three kinds of changes in the apparent 'breadth' of an ensemble that may occur.
Figure 1.
Diagrams depicting protein ensembles and transitions between ensemble configurations. The horizontal axis, 'conformation coordinate' is a single dimension in a hypothetical energy landscape; the vertical axis is free energy, and the shaded areas represent regions of the landscape energetically accessible to the protein within the ensemble. (a) depicts a transition from a relatively narrow ensemble of structures about a dominant conformation, A, to a broader ensemble about the same conformation - a transition that might be triggered, for instance, by a decrease in protein concentration. (b) depicts a transition from a state dominated by conformation 'A', to a state in which two conformations, A and B are nearly equal in abundance. The apparent breadth of the ensemble increases in this transition. (c) depicts a change in state from one dominated by conformation 'A' to one dominated by conformation 'B'. Although the structure/conformation of the protein has changed, the apparent 'breadth' of the ensemble remains essentially unchanged.
Characterizing the Ensemble
Characterization of an ensemble represents a considerable challenge. Whereas protein crystallography has become exceedingly proficient at solving the structure of a crystallized protein, a crystallographic structure represents a single 'snap shot' of the protein's conformational repertoire, selected from the ensemble by the intermolecular forces of the crystal lattice. Atomic resolution structures of crystalline proteins and NMR structures of proteins in solution have been uniquely valuable for hypothesizing the structural basis of protein function and for generating hypotheses about protein motions that support function. But experimental and computational tests of these hypotheses remain critically needed in order to guide the utilization of this information.
Computationally, the complete characterization of a protein ensemble is a massively multi-dimensional problem in molecular dynamics6. Full molecular dynamics calculations of all possible conformations and their relative abundances is beyond current computational capabilities, motivating simplified representations and approaches. Intelligent sampling of the energy landscape can be used to identify clusters of relatively abundant structures and to provide information about the relationships among them and the low energy pathways linking them5,7. Normal mode analysis may provide information on the structural variations about a specific conformation8.
Experimental approaches to characterizing protein ensembles are equally challenging. NMR is often used to generate an experimental 'ensemble' of structures designed to be representative of all structures consistent with available experimental data – but this should not be confused with the 'ensemble' of all structures a protein can exhibit under specific experimental conditions. NMR is also capable of generating some information about this 'ensemble' of structures, usually in the form of information about individual residues or groups.
X-ray solution scattering, both small angle (SAXS) and wide angle (WAXS), has proven to be an effective probe of the breadth and nature of a structural ensemble9,10. As will be detailed here, the range of protein conformations within an ensemble corresponds to a structural polymorphism that has predictable consequences for scattering data collected from a sample containing the ensemble. Although scattering data is a relatively blunt probe of polymorphism, incapable of a complete characterization of an ensemble, when combined with additional structural information, it can provide important information on changes in the relative abundances of distinct conformations10–15 and the spatial extent of fluctuations about a dominant conformation9.
In equilibrium or steady state conditions, proteins are undergoing thermal motions, dynamically exploring the conformational space defined by the energy landscape. Scattering data from these samples can provide considerable insight into the range of motion being explored, but contain no information about the time course of that motion (we will not consider time-resolved studies here). Because a scattering pattern is generated by interaction of x-rays with many billions of molecules over a period of seconds, it corresponds to that accumulated from a statistically significant sampling of the ensemble. In principle, the scattering data would be unchanged if every protein in the scattering volume were completely rigid with a distribution of structures representative of the ensemble. In practice, the scattering provides a window into the ensemble each protein is exploring and the underlying energy landscape that determines the relative abundances of conformations within the ensemble.
The effect of structural polymorphism on scattering data
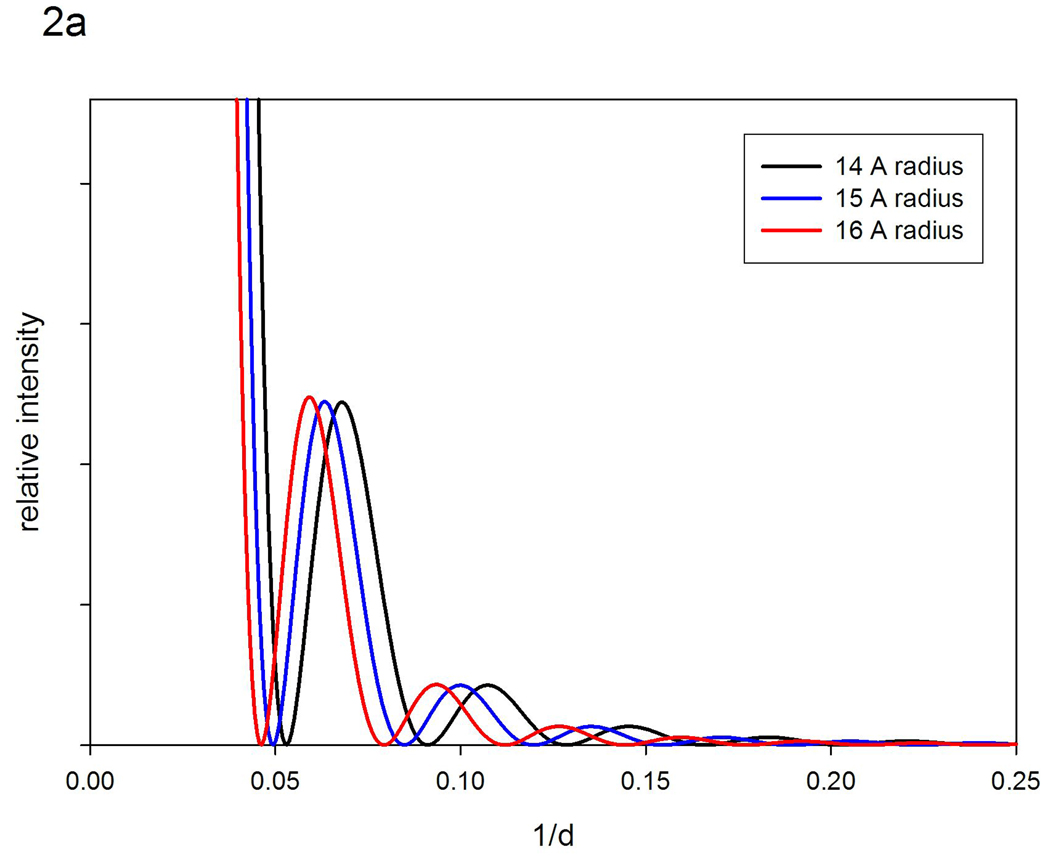
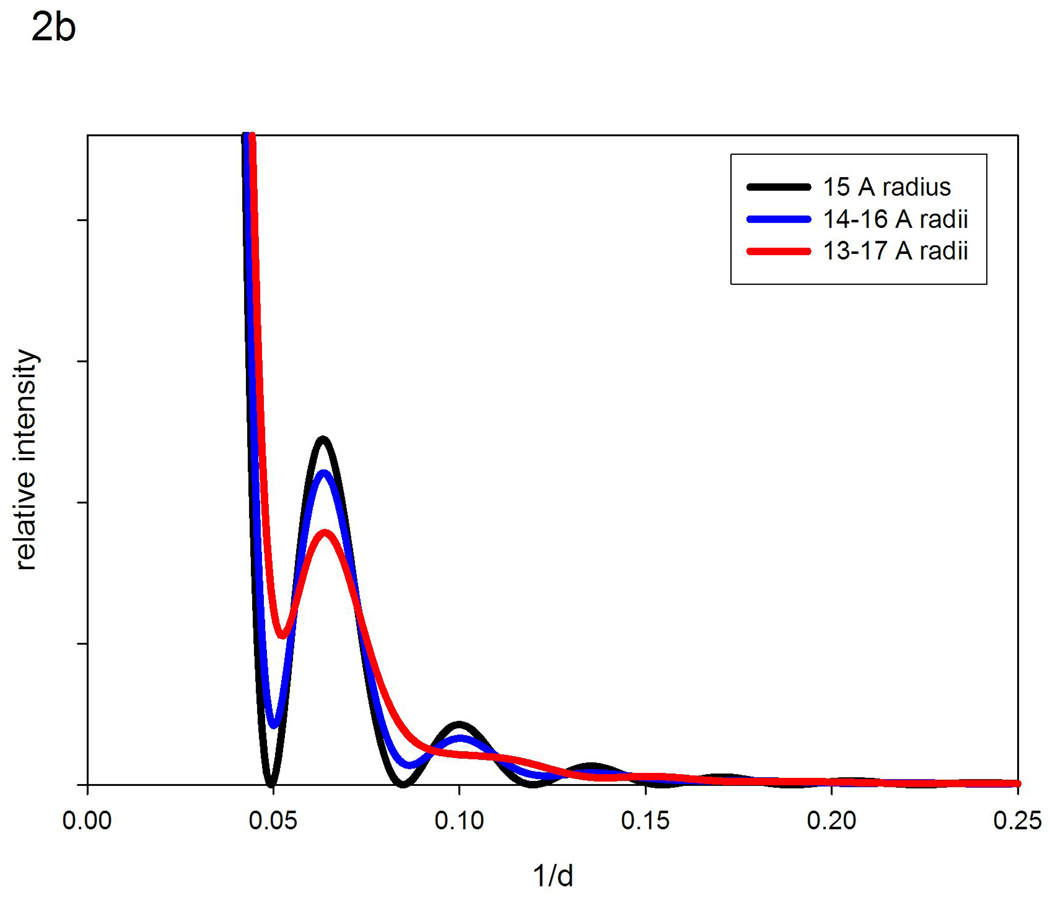
Structural polymorphism, intrinsic to a protein ensemble has readily predictable effects on solution scattering data. Figure 2a is a diagram of the x-ray scattering intensities expected from homogeneous populations of 14, 15 and 16 Å radius spheres. The patterns from the three hypothetical populations are identical except for a shift in the positions of the peaks and troughs. Figure 2b compares the pattern expected from a homogeneous population of 15 Å radius spheres with a population made up of equal masses of 14, 15 and 16 Å radius spheres; and a third population made up of equal masses of spheres ranging from 13 to 17 Å in radius. Increasing polymorphism leads to a filling in of the troughs and a depression of intensity at the peaks. As the degree of polymorphism increases, the extent of these effects becomes greater. For moderate degrees of polymorphism, the positions of peaks and troughs may remain unchanged (although note some change in the most polymorphic case in Figure 2b). By analogy with the curves in Figure 1, if we were to collect data from the two ensembles depicted in Figure 1a, as we transition from that on the left to that on the right, we would expect the intensities in any troughs to fill in and the intensity at peaks to decrease; the magnitude of the effect depending on the change in breadth of the ensemble.
Figure 2.
Calculated diffraction patterns from hypothetical populations of spheres. (a) Comparison of scattering from homogeneous populations composed of 14, 15 or 16 Å radius spheres. (b) Calculated diffraction patterns from a homogeneous population of 15 Å radius spheres compared to hypothetical populations composed of equal masses of 14, 15 and 16 Å radius spheres; and 13–17 Å radius spheres.
Distinguishing a conformational change from a change in breadth of the ensemble may not be straightforward using scattering data alone. But it is important to understand what this distinction actually means. Figure 1a depicts a change in ensemble with no change in the nature of the most abundant species of the ensemble. Figure 1b illustrates a situation in which both the apparent breadth of the ensemble and the relative abundances of members of the ensemble appear to change. Figure 1c shows a situation in which the apparent breadth of the ensemble does not change, but the identity of the most abundant species does. Scattering data may be useful in distinguishing the situation in Figure 1a from those in Figures 1b and 1c. In most cases, transitions like that in Figure 1a do not lead to changes in the positions of the peaks or troughs of a scattering pattern. More detailed interpretations must rely on bringing other data or, perhaps, molecular dynamics simulations into the analysis in order to construct a self-consistent picture. For instance, Yang et al10 constructed a computational ensemble of structures of Hck tyrosine kinase using coarse grained molecular dynamics to sample conformations within the protein ensemble and from those simulations selected representative structures through a clustering analysis. The relative abundances of representative structures were then estimated using experimental SAXS data collected on Hck under different experimental conditions and in complex with binding peptides.
Modeling polymorphism: Vector-length convolution
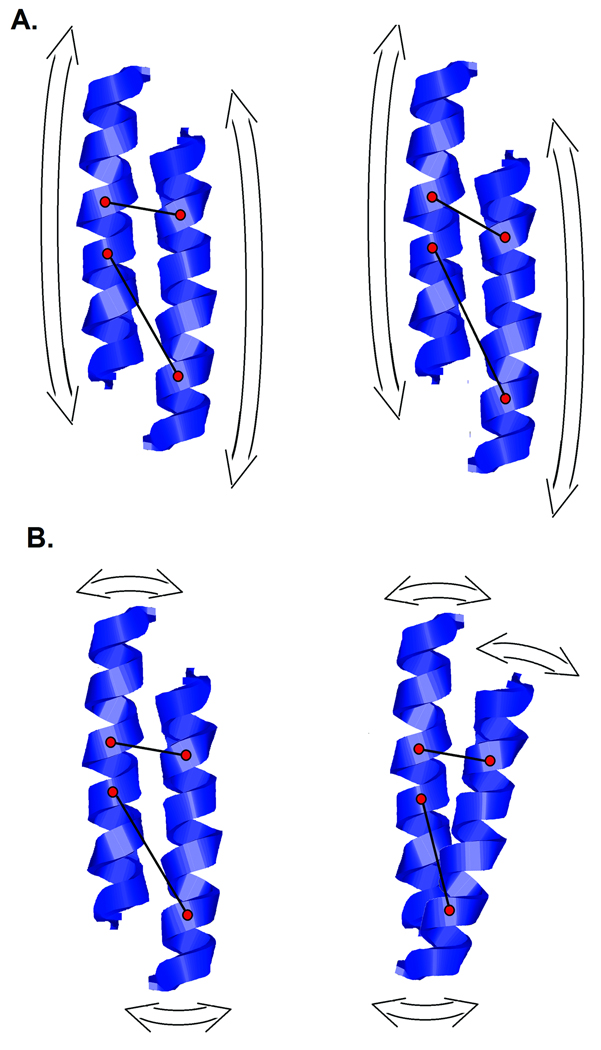
Structural fluctuations express themselves in a diffraction pattern through changes in the distribution of interatomic vector lengths in the protein. Very large fluctuations are associated with a complete redistribution of interatomic vector lengths and partial or complete unfolding of the protein, leading to dramatic changes in the diffraction pattern. Smaller fluctuations, those that occur without unfolding, usually involve little or no disruption of secondary structures and are expressed as subtle changes in scattering. When a pair of adjacent α-helices move relative to one another, the lengths of all interatomic vectors between them will change. The degree to which different interatomic vectors change length during this motion will depend on the form of the relative motion and the flexibility of the α-helix. Rotations (Figure 3a) and translations (Figure 3b) will affect the distribution of vector lengths in different ways. Two adjacent secondary structures can move up to about 1.5 Å relative to one another without the need to re-structure their contact surface16, rotations of bonds being adequate to take up relative motion of that magnitude. Relative motions larger than 1.5 Å may require breakage and re-formation of bonds at the contact surface. Consequently, relative motion of adjacent secondary structures exceeding ~1.5 Å may be associated with significant structural disruption of the protein.
Figure 3.
Ribbon diagrams illustrating the effect of the relative motion of two α-helices on the distribution of inter-atomic vector lengths between them. (a) Translational motion will impact interatomic vectors of different lengths in different ways. Short vectors may not be greatly affected if they are nearly orthogonal to the direction motion. Longer vectors, more nearly parallel to the motion will experience greater length change. (b) Rotational motion will change the lengths of interatomic vectors with a magnitude strongly dependent on the orientation of the axis of rotation, the distance the two atoms are from that axis, and the angle between the axis and the interatomic vector.
In order to explain protein concentration-dependent intensity changes in WAXS data, Makowski et al.9 modeled increases in the breadth of the protein ensemble by replacing each inter-atomic distance in a protein by a Gaussian distribution of distances, a method we will refer to here as 'vector-length convolution'. In this way they were able to start with the scattered intensity from a reference structure exhibiting a relatively narrow ensemble of conformations and from that reference and an appropriate model for disorder, estimate what the intensity would look like if the ensemble increased in breadth. By comparing calculated and observed WAXS patterns, they were able to quantitatively estimate the spatial extent of fluctuations associated with scattering patterns taken under different experimental conditions.
Distinctions were made among three types of models which differed in the way the breadth of the Gaussian distribution varied with vector length. In the 'uniform disorder' model, the half-width, σ, of the distribution was a constant with vector length. This is what would be expected if each atom were fluctuating within a stationary harmonic well. It is a good approximation for many crystalline proteins, but does not generally reflect the behavior of proteins in solution. In the 'nearest neighbor' model, the half-width of the distribution increases as the square-root of vector length, σ ~ r0.5. This is a model frequently used to represent disorder in one-dimensional systems where next-nearest neighbor distances are distributed as the convolution of two nearest neighbor distances. In the 'rigid body' model, σ ~ r, short interatomic vectors vary much less than long interatomic vectors as would be the case in a protein if all fluctuations occurred as movements of rigid subunits or secondary structures relative to one another. Proteins have been found that behave according to each of these three models9.
Since α-helices usually pack with a center-to-center distance of about 10 Å, and β-sheets also pack about 10 Å apart, interatomic vectors of about 10 Å are very common in proteins and represent a good reference distance. In this paper, when comparing the apparent breadth of ensembles, we will discuss the spatial extent of motion implied by WAXS data in terms of the variation of interatomic vectors of 10 Å length. This provides us with a common metric from which to evaluate the nature of the fluctuations underlying the apparent breadth of the ensemble.
There are intrinsic limitations to modeling structural fluctuations (ensemble breadth) on the basis of one or two global parameters. Nevertheless, as we will demonstrate here, the approach can be used to identify and characterize a surprisingly large diversity of behaviors including changes in ensembles triggered by ligand binding; mutations; and changes in environmental parameters (such as protein concentration). Here we apply the approach to four proteins that behave in distinct ways, and illustrate the insights that this approach can provide.
Results
Myoglobin
Myoglobin dynamics have been studied extensively, both computationally and experimentally. Early MD simulations of myoglobin17 showed that the α-helices remain intact throughout a trajectory of several hundred picoseconds and that adjacent helices undergo relative motions with r.m.s values of 0.3–0.7 Å during that time. We observed changes in scattering intensity from myoglobin that indicated protein concentration had a significant impact on the range of structural fluctuations9, a behavior not anticipated by earlier experimental or computational studies. Using vector-length convolution and the WAXS pattern predicted for a rigid protein using the program XS18, we estimate here the absolute magnitude of fluctuations occurring within the protein ensemble as a function of protein concentration.
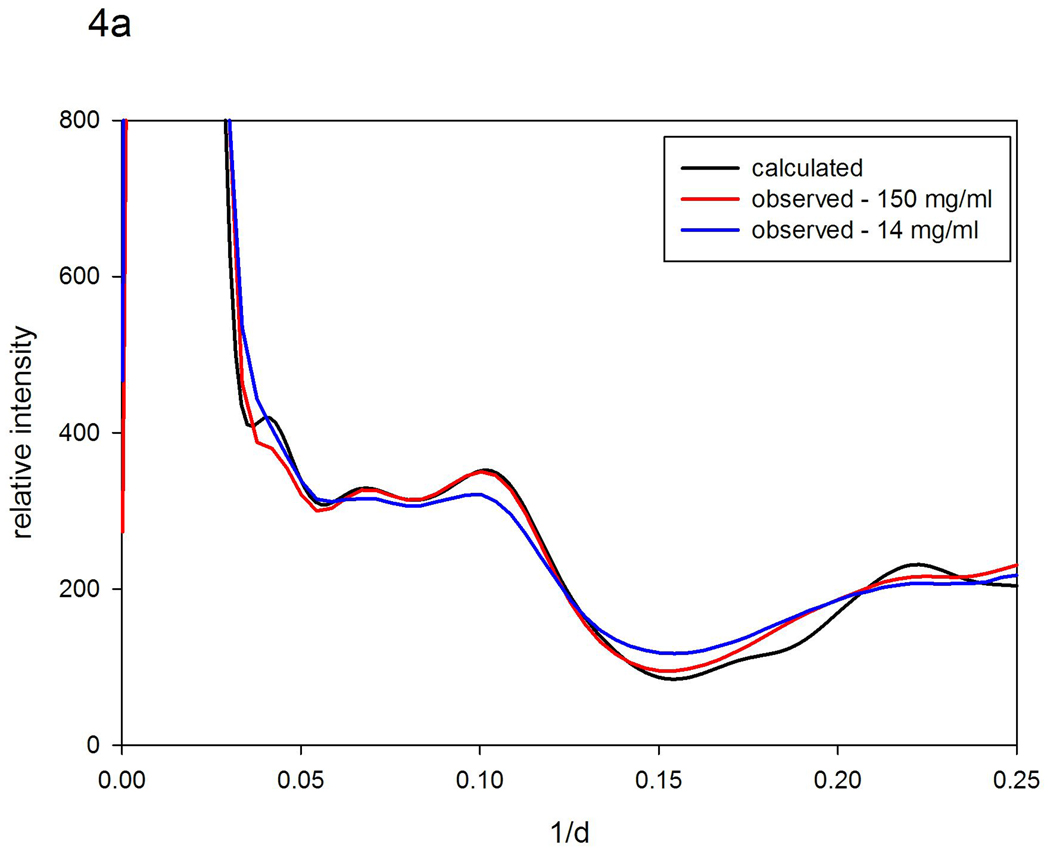
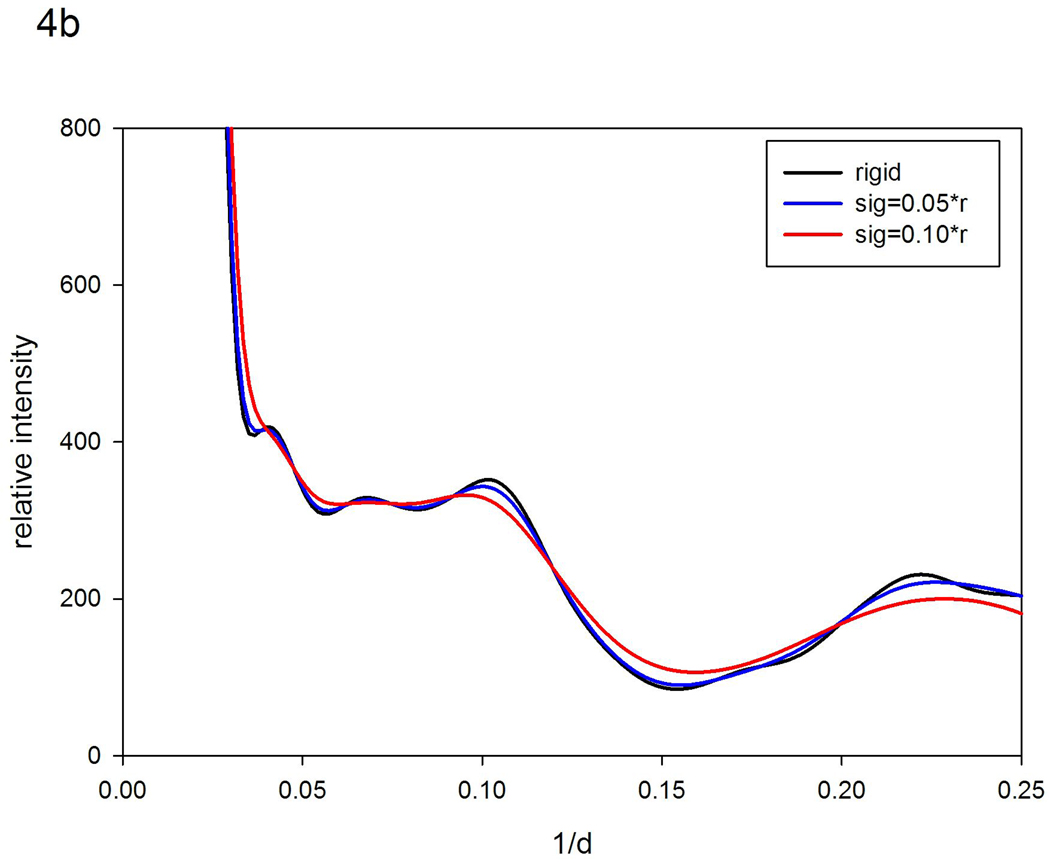
The scattered intensity predicted for myoglobin using XS closely corresponds to intensities observed from a 150 mg/ml myoglobin solution as shown in Figure 4a. The correspondence for 15 mg/ml myoglobin is not nearly as good. Starting with the calculated intensities, models for disorder in myoglobin were generated and compared with observed for both protein concentrations. For the higher protein concentration, the spatial extent of fluctuations is very low making it difficult to distinguish among similar models. For instance, σ = 0.05 r fits about as well as σ = 0.3 r0.5. In both cases, for r=10 Å, the observed distribution corresponded to fluctuations given by σ ~ 0.5 Å. This indicates that the α-helices in myoglobin, with center-to-center distances of about 10 Å, fluctuate not more than about half an angstrom relative to one another when the protein concentration is relatively high (150 mg/ml). This is consistent with the results of MD simulations of myoglobin dynamics17. For more dilute solutions (15 mg/ml), the 'rigid body' model, in which σ ~ r, fits substantially better than the 'nearest neighbor' model, and is consistent with 10 Å interatomic vectors fluctuating +/− 1.0 Å, about twice what is observed at higher protein concentrations. Figures 4b and 4c show the results of the relevant calculations.
Figure 4.
Scattering patterns from myoglobin. (a) Comparison of the scattering pattern calculated from atomic coordinates using XS with those observed from solutions of myoglobin at 150 mg/ml and 15 mg/ml protein concentrations. (b) Comparison of the pattern calculated from atomic coordinates with those calculated by vector-length convolution using 'rigid body' models (σ=0.05r; and σ =0.10r). (c) Comparison of the pattern calculated from atomic coordinates with those calculated using 'nearest neighbor' models (σ = 0.2r0.5; and σ = 0.4r0.5).
The model is consistent with the view that, in solution, the α-helices in myoglobin fluctuate relative to one another by an amount that can be readily accommodated by bond rotations. Restructuring of interfaces among α-helices is not required to make possible these motions even in the most dilute solutions studied. Furthermore, these results demonstrate that the range of motion is a strong function of protein concentration and indicate that any study of dynamics in myoglobin should take into account the concentration at which the studies are carried out.
Ubiquitin
Ubiquitin is a compact, 76 amino acid protein with 5 β-strands and an α-helix. Its folding has been studied extensively with folding behavior often interpreted in terms of two-state kinetics19. A barrier to the study of protein folding is the formation of folding intermediates with sufficiently long life times that they can be well characterized. One strategy for stabilizing intermediates involves replacement of a buried aliphatic residue with a charged residue to destabilize and unfold a specific region of the protein20. Here, we compare WAXS patterns from WT ubiquitin with those from a variant harboring a mutation L50E in the hydrophobic core designed to destabilize the protein.
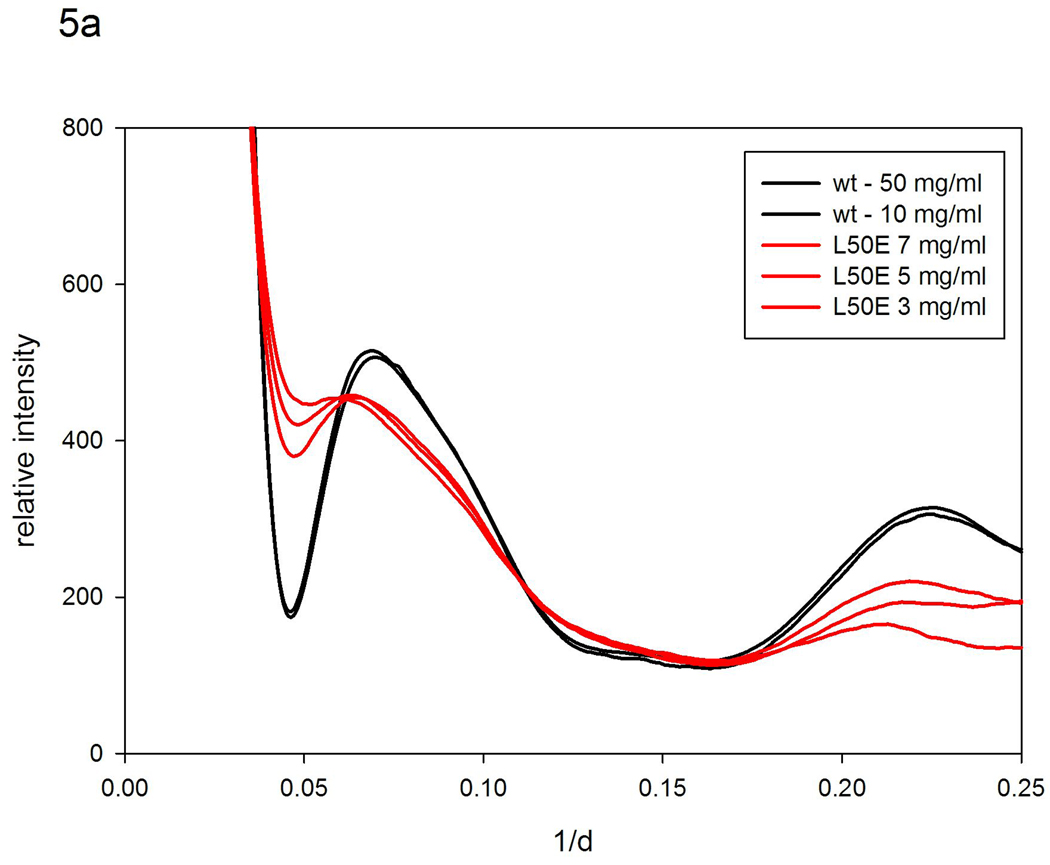
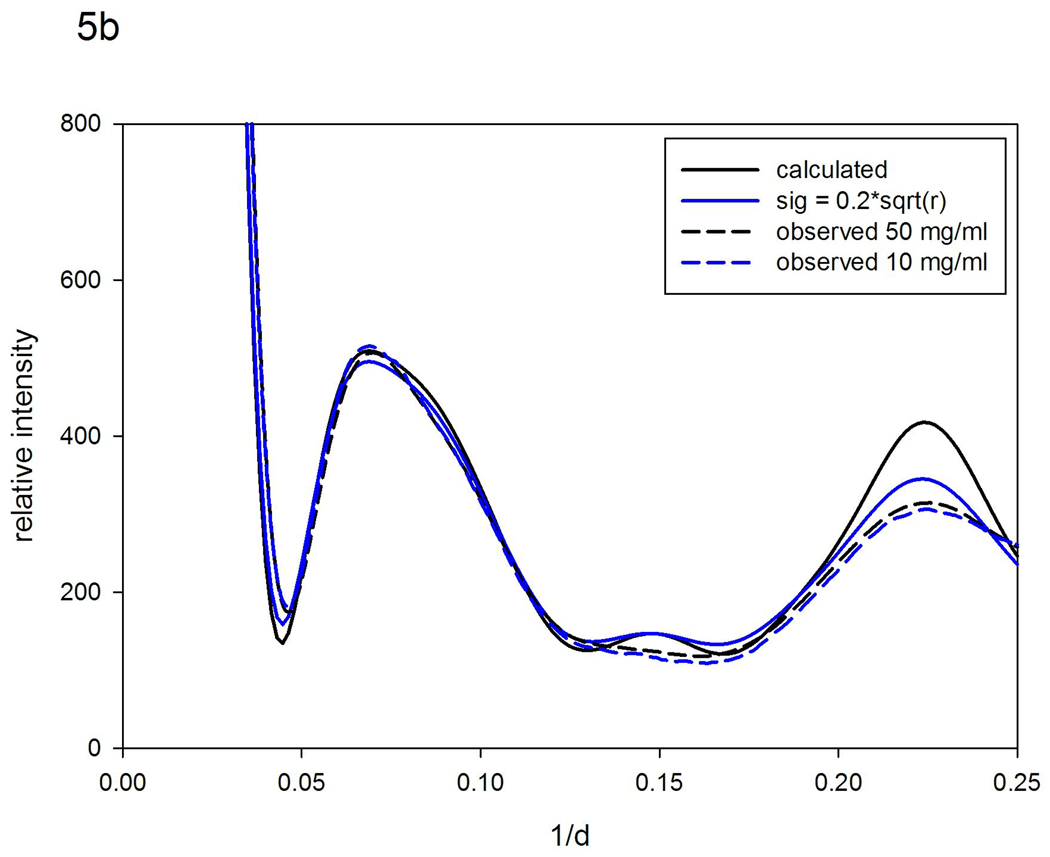
WAXS patterns were collected on solutions of WT ubiquitin and the mutant, L50E. Figure 5a includes the observed patterns from both WT and mutant. Figure 5b compares (i) patterns observed from WT with (ii) that calculated with the program XS assuming a completely rigid protein and (iii) those generated from the XS results by vector-length convolution that represent predictions for different ranges of motion. WT ubiquitin gives rise to WAXS patterns that are almost identical to those calculated from atomic coordinates, and shows little concentration dependence, indicating that it undergoes only very small structural fluctuations in solution. These data suggest fluctuations of 10 Å vectors are less than ~0.5 Å. The largest discrepancy between calculated and observed patterns is in the vicinity of the peak at ~0.22 Å −1 which corresponds to the 4.7 Å spacing between β-strands in a β-sheet – a peak found in most proteins containing a large proportion of β-sheets. Vector-length convolution generates a much better fit than that obtained for a completely rigid protein, indicating that the β-strands in WT ubiquitin are fluctuating relative to one another by a few tenths of an angstrom.
Figure 5.
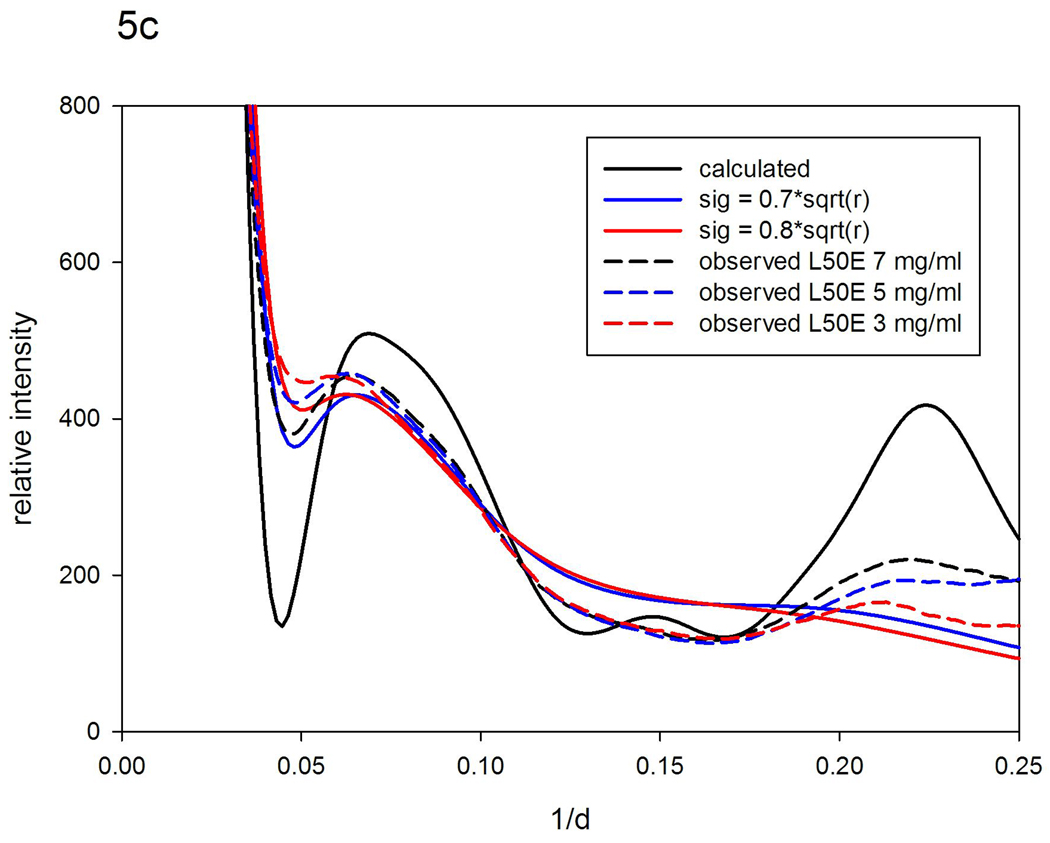
Scattering patterns from ubiquitin. (a) Observed patterns from WT at 50 mg/ml and 10 mg/ml; and L50E at 7, 5, and 3 mg/ml. (b) Patterns calculated from atomic coordinates using XS; and using a 'nearest-neighbor' model (σ =0.2r0.5) compared to patterns observed from WT ubiquitin. (c) Pattern calculated from atomic coordinates; and using 'nearest-neighbor' models (σ =0.7r0.5; σ =0.8r0.5) compared to patterns observed from L50R at 7; 5; and 3 mg/ml.
Extensive studies have been carried out on the ubiquitin mutant L50E20. Leucine 50 is a buried residue in ubiquitin. Replacing it with glutamate, a nearly isosteric amino acid with charge dependent on pH, provides a pH-sensitive approach to the study of folding and unfolding. WAXS studies were carried out on L50E at the transition pH, 6.0, in the presence of 200 mM urea. The patterns from the L50E mutant, as seen in Figure 5a, exhibit very different characteristics from those of WT, and have a substantial concentration dependence. The patterns are barely recognizable as arising from ubiquitin and the intensity of the 4.7 Å (1/d = 0.22 Å −1) peak is greatly reduced suggesting that the mutation has resulted in a disruption of the β-sheet that comprises the majority of the protein. Nevertheless, hydrogen exchange measurements indicate that 4 of the 5 β-strands remain intact under these conditions and only a small strand and a loop unfold20. NMR studies indicate a simultaneous increase in dynamics of the adjacent regions20. These comparisons suggest that the intensity of the peak at 0.22 Å −1 is very sensitive to the degree of order in the packing of the strands within the β-sheet and that the remaining strands of the β-sheet fluctuate relative to one another while maintaining the integrity of the structure.
Comparing the WAXS patterns from L50E at 7, 5 and 3 mg/ml with those of the WT ubiquitin suggests that although the mutant may have a similar average structure to WT under these conditions, it exhibits very substantial structural polymorphism. This impression is supported by vector-length convolution calculations that required using σ = 0.7–0.8 r0.5 to generate model patterns that reproduce most of the characteristics of the observed patterns (Figure 5c). The degree of structural variation implied by this model (>2 Å for 10 Å interatomic vectors) is larger than what can normally be accommodated by bond rotations. These results indicate that although the average structure of L50E is not substantially different from WT, there must be some bond breakage and re-structuring of internal interfaces occurring as the protein fluctuates in solution; the mutant is almost certainly unfolded to some extent. Consistent with this conclusion, the radius of gyration (Rg) of WT ubiquitin estimated from our data was ~ 13.1 Å, nearly constant over the range of concentrations studied (10–50 mg/ml), whereas that for the L50E mutant was ~14.1 Å, increasing slightly as concentration decreased from 7.5 to 3 mg/ml. Estimates of Rg from our data usually have errors larger than those obtained from SAXS data since we do not collect data to very low scattering angles. We have found our estimates are within a few tenths of an Å of estimates from SAXS taken under identical solution conditions.
Alcohol dehydrogenase
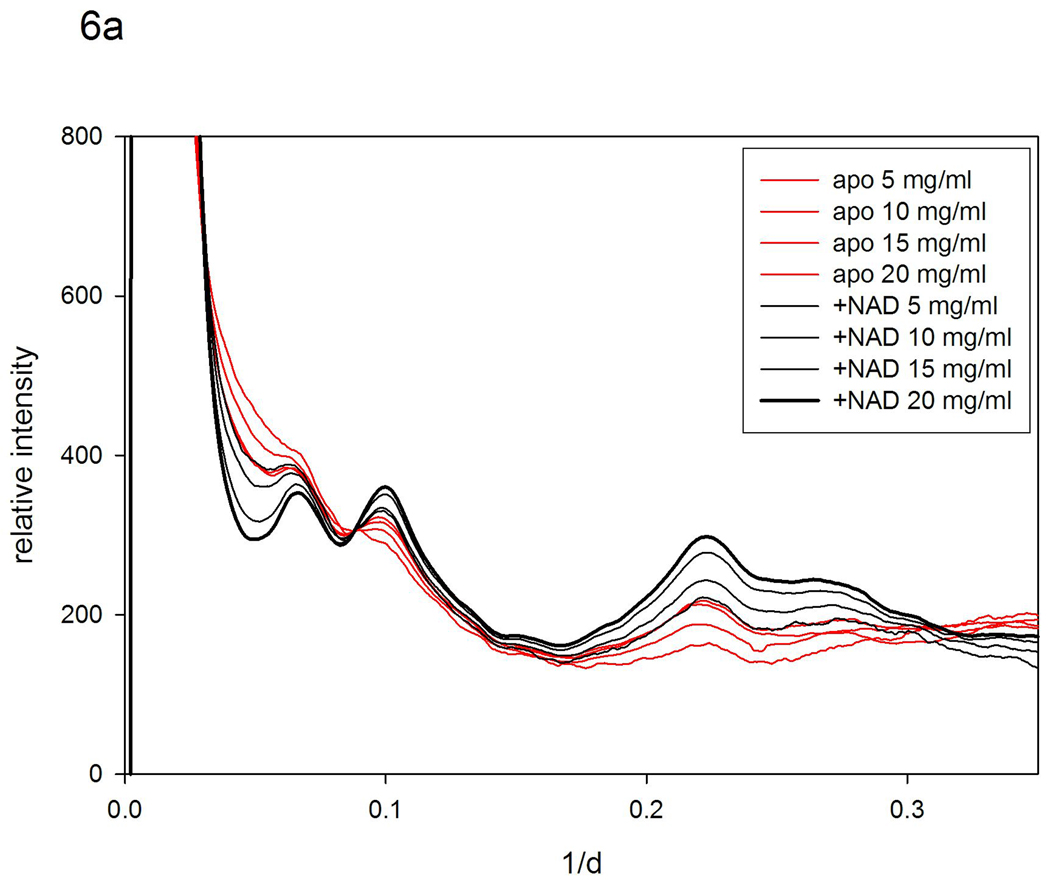
Alcohol dehydrogenase (ADH) oxidizes alcohols into aldehydes or ketones, requiring the coenzyme NAD+. The enzyme is a tetramer, each protein possessing two domains - an NAD+ binding domain and a catalytic domain. The interdomain interface forms a cleft that contains the catalytic site. When NAD+ binds the apo enzyme there is a rotation of about 7.5° around a hinge axis passing through the contact point of the α-helices connecting the two domains. Earlier WAXS studies of this structural change21 utilized ADH that was not entirely stripped of NAD+, but demonstrated intensity changes consistent with those expected from crystallographic analyses. Using completely stripped ADH, we recollected WAXS data as a function of protein concentration in the presence and absence of NAD+. The intensity differences were greater than those previously reported and exhibited an unexpected pattern as shown in Figure 6a. These differences cannot be accounted for on the basis of a change in the protein structure alone. As protein concentration decreases, the pattern of intensity changes follows that which would be expected for increasing magnitude of protein fluctuations. Surprisingly, the addition of NAD+ decreases the apparent magnitude of fluctuations – the scattering data from ADH at 5 mg/ml with NAD+ bound appears almost indistinguishable from the data collected from apo ADH at 20 mg/ml.
Figure 6.
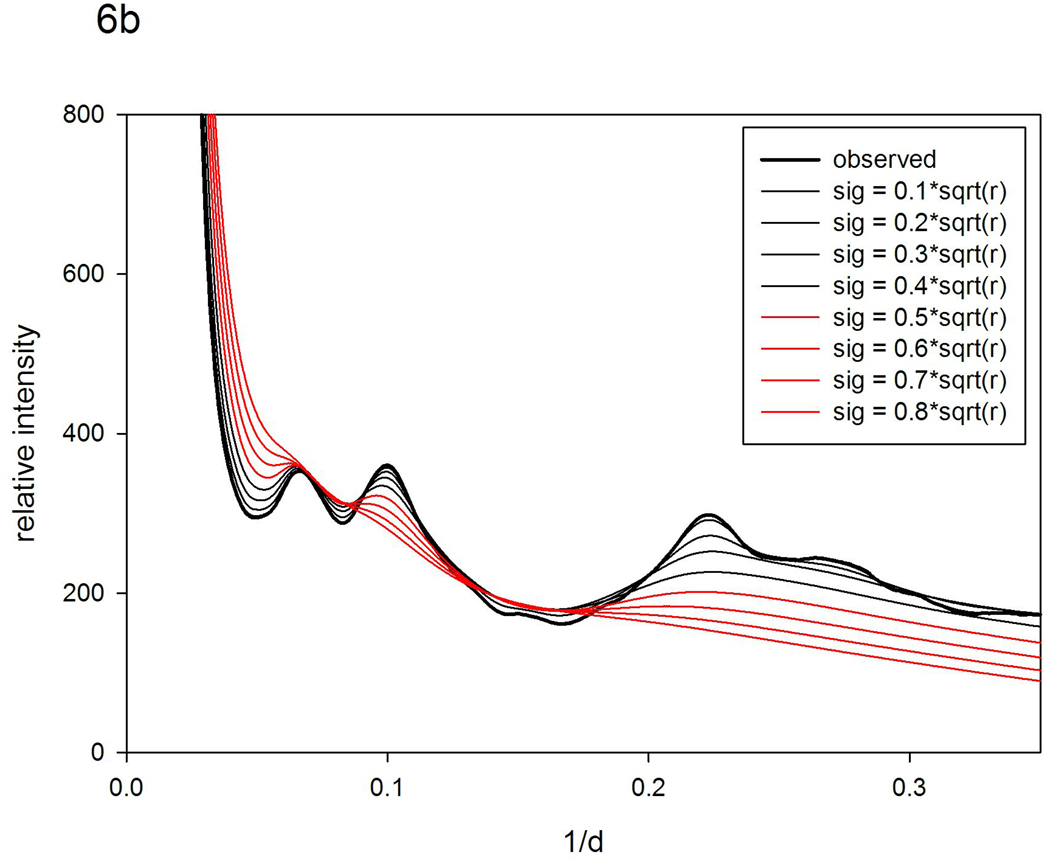
Scattering patterns from alcohol dehydrogenase. (a) Observed patterns from apo ADH and in the presence of NAD+ at concentrations of 5; 10; 15 and 20 mg/ml. (b) Patterns calculated using the pattern from ADH with NAD+ at 20 mg/ml as a reference and using 'nearest-neighbor' models (σ =0.1r0.5 to 0.8r0.5).
The WAXS pattern from ADH with NAD+ at 20 mg/ml was used as a reference pattern to generate a set of patterns corresponding to increasing degrees of structural fluctuations using vector-length convolution. The 'nearest neighbor' model in which σ ~ r0.5 exhibited behavior very close to that observed as shown in Figure 6b, whereas the 'rigid body' model (σ ~ r) exhibited poor correspondence to that observed (results not shown). The greatest discrepancy between patterns calculated with the 'nearest-neighbor' model and those observed is in the region of the peak at 0.22 Å−1. This peak, which corresponds to the 4.7 Å spacing between β-strands, remains visible even in patterns from the most dilute apo ADH samples. This peak is not well preserved in the model of disorder used for these calculations, reflecting the limitations of a model utilizing only two global parameters to characterize the full diversity of structural fluctuations.
These results indicate that ADH exhibits substantial fluctuations in dilute solutions. WAXS patterns from apo ADH at 5 mg/ml are best predicted by a model in which adjacent secondary structures (interatomic vector lengths of 10 Å) undergo fluctuations of over 2 Å relative to one another. This is significantly more than what can be accommodated by bond rotations alone. It is unclear how the tetramer accommodates these fluctuations. The magnitude observed is suggestive of partial unfolding of the apo protein. In many proteins, residues in the vicinity of a binding site exhibit substantial disorder prior to binding. It is possible that ADH exhibits a very high degree of disorder in the apo form and that binding of NAD+ results in a substantial ordering of some portions of the protein. Our observations indicate that binding of NAD+ decreases the relative motion of adjacent secondary structures by an average of roughly 1.5 Å, independent of protein concentration.
HIV protease
Access to the active site of HIV protease is controlled by the conformation and dynamics of a pair of flaps that, on binding of substrate or inhibitors, fold across the active site. The obligate motion of these flaps represents an attractive target for the design of novel drugs that could be active against drug resistant mutants22–24. Extensive studies of the dynamics of the protein have been carried out in support of this goal. Many residues outside the region of the active site and flap region have been associated with drug resistance23,25. The mode by which they confer drug resistance is unclear, but recent studies support the idea that changes in residues in the core of the protein modulate flexibility that provides freedom of movement of the flaps and consequent accessibility of substrate to the active site25. The flexibility of the entire protein is thereby involved in modulation of activity.
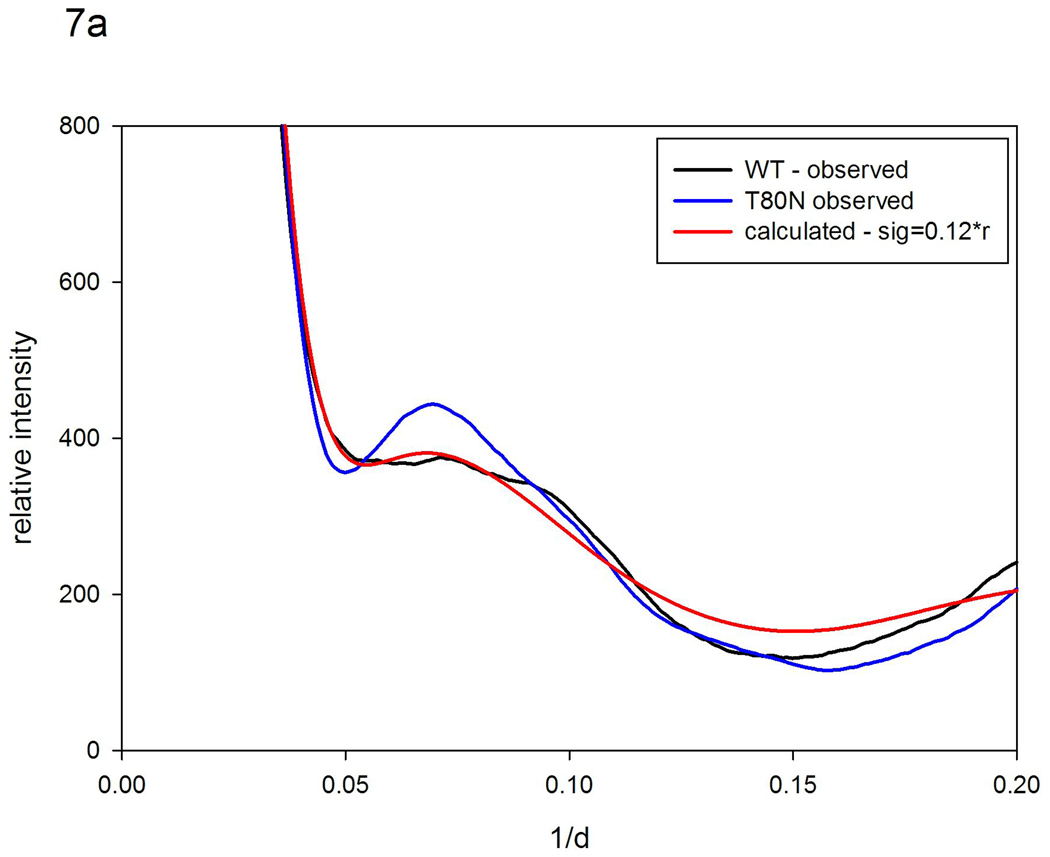
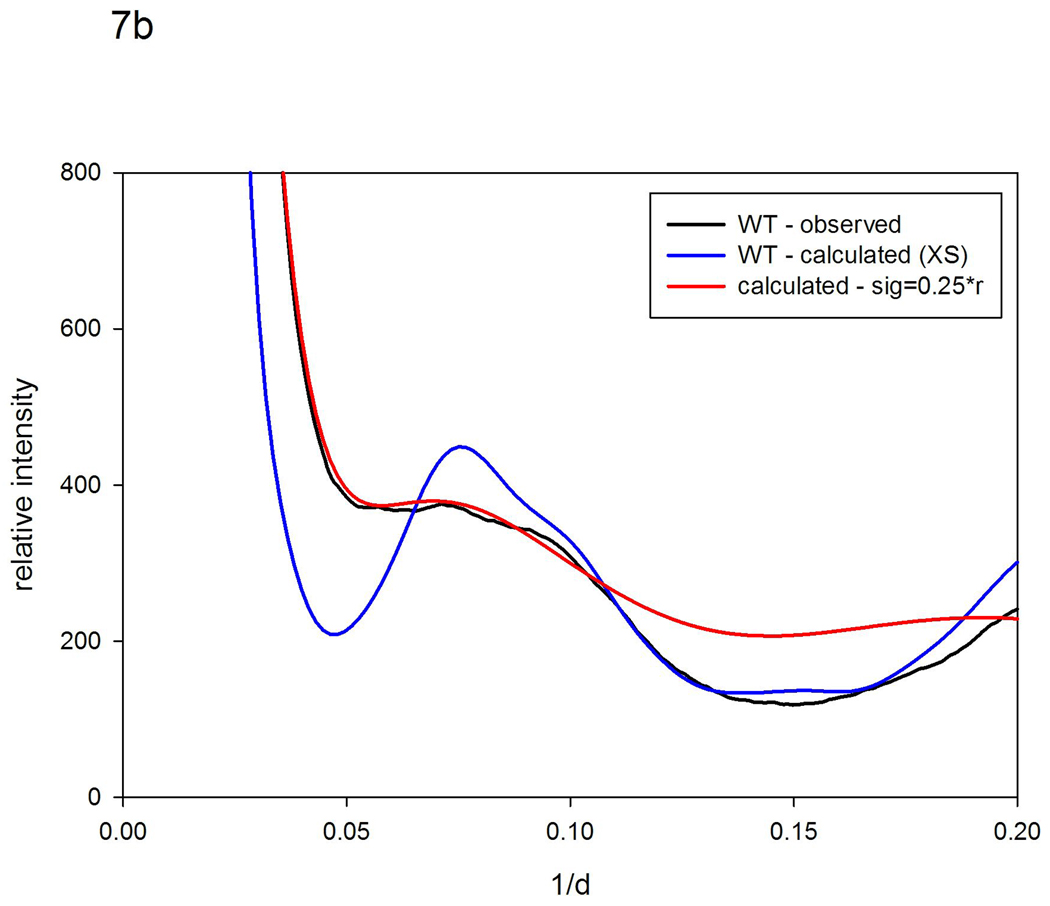
The highly conserved residue T80 in the hinge region of the protein has been identified as critical for maintaining flexibility26. Molecular dynamics simulations suggest that motions of the flaps in the mutant T80N are highly constrained when compared to wild type26. To test this hypothesis, we collected WAXS patterns from WT (actually a variant, Q7K designed to prevent self-digestion) and T80N (also carrying the substitution Q7K), in the presence and absence of an inhibitor. WAXS patterns from WT exhibited statistically significant differences when inhibitor was added, whereas T80N did not (data not shown), consistent with its well characterized lack of functionality. Although the crystal structures of T80N and WT are virtually indistinguishable26, as shown in Figure 7a, there are substantial differences in their WAXS patterns. We used the scattering pattern from T80N as a reference pattern and generated models for what the pattern would look like in the presence of increased magnitude fluctuations. Using a model in which σ = 0.12 r, we predict a pattern very similar to that from WT as seen in Figure 7a. This result strongly suggests that WT protease has a structure very similar to that of T80N, but with substantially larger structural fluctuations. The estimate of σ obtained by this quantitative comparison is, however, an estimate of the difference between two structures, both of which may be fluctuating. In order to make an estimate of the absolute magnitude of fluctuations occurring in WT, we started with a rigid, atomic coordinate set model, generated a model scattering pattern using the program XS18, and applied vector length convolution to that pattern. Figure 7b compares the best model generated in that fashion with observed scattering from WT. As shown in the figure, this calculation generates a distribution of intensities that closely resembles those from WT out to beyond 10 Å spacing. At higher resolutions, the calculated deviates from the observed, reflecting the fact that complex motions of loops and residues cannot be encompassed in a 2 parameter model. Nevertheless, the correspondence at lower resolution suggests that the model parameters used provide an estimate of the average magnitude of fluctuations occurring. This model corresponds to σ = 0.25 r, suggesting that in the WT protein adjacent secondary structures may, on average, be moving by ~ 2.5 Å relative to one another. This indicates that at least some of the structural fluctuations occurring in WT protease cannot be accommodated without bond breakages or restructuring of contact surfaces - as might occur when the flaps open or close. These results provide experimental support for the results of MD calculations26 that indicate T80N has a structure virtually identical to WT but exhibits structural fluctuations of substantially smaller magnitude.
Figure 7.
Scattering patterns from HIV protease (a) WT (black) and T80N (blue) compared to a pattern calculated using the T80N pattern as a reference and a model for the disorder in which σ =0.12 r (red). (b) WT (black), a pattern calculated from the atomic coordinate set 1F7A (with substrate removed) using the program XS18 and assuming a rigid structure for the protease (blue) compared to that from a model pattern calculated using the XS pattern from the rigid protein as a reference and a model for disorder in which σ =0.25 r (red).
Discussion
The structural fluctuations of a protein occur within an energy landscape that has evolved to support functional conformations and to maintain low energy pathways among them27. The relative abundances of conformations within a protein ensemble will be determined by this landscape. Computational and experimental characterization of protein ensembles seems an obligate step in developing a complete picture of protein function. As demonstrated here, x-ray solution scattering can provide an experimental approach to monitoring changes in the spatial extent of fluctuations and to rapidly determine the effect of ligands, mutations and environmental changes on the form and breadth of the ensemble.
Protein concentration appears to be a potent variable with great potential for modulating the spatial extent of protein fluctuations. The origin of this effect appears to be molecular crowding9. As protein concentration grows there is a greater energetic penalty applied to any conformation that increases the volume from which other macromolecules are excluded. Many experimental approaches to the study of protein dynamics utilize a protein concentration convenient to the biophysical technique applied. Our results, as exemplified here, indicate that protein concentration should not be ignored, and in fact may be an experimentally convenient means by which to modulate dynamics.
A protein undergoing an increased magnitude of structural fluctuations may exhibit an increase in its apparent Rg. This can be seen, for instance, in comparing SAXS from WT ubiquitin with that from L50E at very nearly the same concentration. However, when protein concentration is changed, a second effect influences the apparent Rg, complicating any structural interpretation. As concentration changes, the contrast between the average electron density within the protein and the average electron density of the sample is altered. As pointed out by Svergun and others28, this may lead to changes in the radius of gyration that are dependent on the details of the internal structure of the protein. Consequently, changes in Rg as a function of protein concentration need to be interpreted with caution. They may be due to changes in contrast, changes in fluctuations, or both.
The amount of information on protein ensembles that is embedded in a WAXS pattern is intrinsically limited. Nevertheless, the effect of changes in the breadth of an ensemble on WAXS patterns are readily predictable, and scattering appears to be a highly sensitive tool for detecting these changes. Qualitative evaluation of the effect of a mutation; ligand binding; or environmental change can be made quickly. Quantitative measurement may be limited to the determination of one or two global parameters that characterize the average behavior of the entire protein. Vector-length convolution provides a quick, intuitive approach to tracking changes in the overall breadth of the ensemble.
There are relatively few experimental tools that provide insight into the spatial extent of slow correlated motions that occur in proteins in solution. We have demonstrated here that x-ray solution scattering represents an effective approach for characterization of average fluctuations of a protein system. The power of x-ray solution scattering as a tool may be substantially enhanced through the coordinated use of molecular dynamics. Computationally generated sets of structures, representative of the entire ensemble can represent a basis set for use in evaluating shifts in populations driven by changes in environment or binding of ligands10.
Methods
Data Collection
All data were collected at the BioCAT undulator beamline (18ID) at the Advanced Photon Source29 using methods described in detail previously9. Data were collected using a sample cell consisting of a thin-walled quartz capillary held at an ambient temperature of 4°C. To minimize radiation damage, protein samples were made to flow through the x-ray beam at rate that limited x-ray exposure of any one protein to ~100 msec. At these exposure levels, the effect of radiation damage on radio-sensitive test proteins is undetectable. Typically, a data-set consisted of a series of 2-second exposures with five from buffer, fifteen to twenty from protein solution and five from the empty capillary. The two dimensional scattering patterns were circularly averaged with Fit2D30,31, and the resulting one-dimensional intensity distribution was plotted as a function of spacing 1/d. Standard deviations of the observed data were calculated, with error propagation formulae used to calculate their effect on the final estimate of scattering from protein.
Calculation of WAXS patterns from atomic coordinate sets
The program XS was used to predict scattering patterns from sets of atomic coordinates18. This program uses an explicit atom representation of water to overcome limitations in the use of continuum models of the hydration layer and the modeling of excluded volume32. NAMD33 was used to generate a 20 psec equilibration followed by a 100 psec molecular dynamics simulation during which 100 snapshots of the water of hydration were captured. During the MD simulation the protein was held rigid. The scattering due to the solvated protein was then calculated and the corresponding scatter from a comparable 'droplet' of water was subtracted. With no empirical adjustments, this method has produced scattering patterns of unprecedented accuracy in the length scale between 5 and 100 Å.
Vector-length Convolution
The intensity calculated using XS corresponds to that expected for a population of completely rigid proteins. We used the vector-length convolution9 to predict the effect of structural fluctuations on the computed intensities. Starting with a reference scattering pattern – either calculated or experimental, an indirect Fourier transform34 was used to compute the pair correlation function (also called pair distribution function – it is equal to 4πr2 times the autocorrelation function) which is essentially a histogram of the interatomic vector lengths within a protein.
Predicted patterns for model ensembles were computed by replacing each interatomic vector in the pair correlation function of the reference structure by a Gaussian distribution of vector lengths. The calculations were carried out as described previously9. Model ensembles with distinctly different properties can be generated by varying the way in which the Gaussian distribution varies with interatomic vector length. The pair correlation function corresponding to the model structural ensemble, pm(r), is computed from the convolution of the pair correlation function of the reference structure, pr(r), and a Gaussian of half width σ(r) which may be a function of the interatomic vector length r according to
The '*' in the equation denotes convolution. The form of this construction is sufficiently general to be useful for a broad range of model types.
The simplest model - the 'Uniform Disorder' model - is one in which each atom undergoes uniform uncorrelated fluctuations about an equilibrium position as might be observed in a crystal. The effect of this type of fluctuation can be modeled by convolution of the pair correlation function of the reference structure with a Gaussian of width, σ, that is independent of the length of the interatomic vector. According to the convolution theorem this operation corresponds to multiplying the WAXS pattern by a Gaussian with half-width inversely proportional to σ. Disorder of this kind would result in a progressive reduction of scattered intensity as scattering angle increases. In the 'Nearest Neighbor' model', σ(r) was chosen to increase proportional to ~r0.5. This type of model is often used to model disorder in one-dimensional systems where next-nearest neighbor distances are distributed as the convolution of two nearest neighbor distributions. In the third model, the 'Rigid Body' model, fluctuations are modeled as proportional to interatomic vector length (σ(r) ∝ r). In this model smaller structural elements of the protein move only slightly, resulting in small changes of the intensity patterns at high scattering angles. However, larger structural elements such as domains or secondary structures shift relatively more, affecting intensities at smaller scattering angles.
Acknowledgements
We thank Celia Schiffer for the gift of HIV protease, both WT and T80N; and Tobin Sosnick for the ubiquitin WT and mutants. This work is supported by a research grant from the NIH (R01GM-085648 to L. Makowski). BioCAT is a National Institutes of Health-supported Research Center RR-08630. Use of the Advanced Photon Source, an Office of Science User Facility operated for the U.S. Department of Energy (DOE) Office of Science by Argonne National Laboratory, was supported by the U.S. DOE under Contract No. DE-AC02-06CH11357
References
- 1.Henzler-Wildman KA, Thai V, Lei M, Ott M, Wolf-Watz M, Fenn T, Pozharski E, Wilson MA, Petsko GA, Karplus M, Hubner CG, Kern D. Nature. 2007;450:838–844. doi: 10.1038/nature06410. [DOI] [PubMed] [Google Scholar]
- 2.Boehr DD, Nussinov R, Wright PE. Nature Chemical Biology. 2009;5:789–796. doi: 10.1038/nchembio.232. [DOI] [PMC free article] [PubMed] [Google Scholar]
- 3.Daily MD, Phillips GN, Cui Q. J. Mol. Biol. 2010;400:618–631. doi: 10.1016/j.jmb.2010.05.015. [DOI] [PMC free article] [PubMed] [Google Scholar]
- 4.Frauenfelder H, Sligar SG, Wolynes PG. Science. 1991;254:1598–1603. doi: 10.1126/science.1749933. [DOI] [PubMed] [Google Scholar]
- 5.Yang S, Roux B. PLoS Computational Biology. 2008;4:e1000047. doi: 10.1371/journal.pcbi.1000047. [DOI] [PMC free article] [PubMed] [Google Scholar]
- 6.Rother D, Sapiro G, Pande V. IEEE/ACM Trasactions on Computational Biology and Bioinformatics. 2008;5:1–14. doi: 10.1109/TCBB.2007.1061. [DOI] [PubMed] [Google Scholar]
- 7.Lau AY, Roux B. Structure. 2007;15:1203–1214. doi: 10.1016/j.str.2007.07.015. [DOI] [PMC free article] [PubMed] [Google Scholar]
- 8.Ma J. Structure. 2005;13:373–380. doi: 10.1016/j.str.2005.02.002. [DOI] [PubMed] [Google Scholar]
- 9.Makowski L, Rodi DJ, Mandava S, Minh D, Gore D, Fischetti RF. J. Mol. Biol. 2008;375:529–546. doi: 10.1016/j.jmb.2007.07.075. [DOI] [PMC free article] [PubMed] [Google Scholar]
- 10.Yang S, Blachowicz L, Makowski L, Roux B. Proc. Natl. Acad. Sci. 2010;107:15757–15762. doi: 10.1073/pnas.1004569107. [DOI] [PMC free article] [PubMed] [Google Scholar]
- 11.von Ossowski I, Eaton JT, Czjzek M, Perkins SJ, Frandsen TP, Schulein M, Panine P, Henrissat B, Receveur-Brechot V. Biop. J. 2005;88:2823–2832. doi: 10.1529/biophysj.104.050146. [DOI] [PMC free article] [PubMed] [Google Scholar]
- 12.Bernado P, Mylonas E, Petoukhov MV, Blackledge M, Svergun DI. J. Am. Chem. Soc. 2007;129:5656–5664. doi: 10.1021/ja069124n. [DOI] [PubMed] [Google Scholar]
- 13.Pelikan M, Hura GL, Hammel M. Gen. Physiol. Biophys. 2009;28:174–189. doi: 10.4149/gpb_2009_02_174. [DOI] [PMC free article] [PubMed] [Google Scholar]
- 14.Bertini I, Giachetti A, Luchinat C, Parigi G, Petoukhov MV, Pierattelli R, Ravera E, Svergun DI. J Am Chem Soc. 2010;132:13553–13558. doi: 10.1021/ja1063923. [DOI] [PubMed] [Google Scholar]
- 15.Tsutakawa SE, Hura GL, Frankel KA, Cooper PK, Tainer JA. J. Struct. Biol. 2006;158:214–223. doi: 10.1016/j.jsb.2006.09.008. [DOI] [PubMed] [Google Scholar]
- 16.Chothia C, Lesk AM, Dodson GG, Hodgkin DC. Nature. 1983;302:500–505. doi: 10.1038/302500a0. [DOI] [PubMed] [Google Scholar]
- 17.Elber R, Karplus M. Science. 1987;235:318–321. doi: 10.1126/science.3798113. [DOI] [PubMed] [Google Scholar]
- 18.Park S, Bardhan JP, Roux B, Makowski L. J. Chem. Phys. 2009;130:134114. doi: 10.1063/1.3099611. [DOI] [PMC free article] [PubMed] [Google Scholar]
- 19.Chung HS, Shandiz A, Sosnick TR, Tokmakoff A. Biochemistry. 2008;47:13870–13877. doi: 10.1021/bi801603e. [DOI] [PMC free article] [PubMed] [Google Scholar]
- 20.Zheng Z, Sosnick TR. J. Mol. Biol. 2010;397:777–788. doi: 10.1016/j.jmb.2010.01.056. [DOI] [PMC free article] [PubMed] [Google Scholar]
- 21.Fischetti RF, Rodi DJ, Gore DB, Makowski L. Chemistry and Biology. 2004;11:1431–1443. doi: 10.1016/j.chembiol.2004.08.013. [DOI] [PubMed] [Google Scholar]
- 22.Freedberg DI, Ishima R, Jacob J, Wang YX, Kustanovich I, Louis JM, Torchia DA. Protein Sci. 2002;11:221–232. doi: 10.1110/ps.33202. [DOI] [PMC free article] [PubMed] [Google Scholar]
- 23.Ali A, Bandaranayake RM, Cai Y, King NM, Kolli M, Mittal S, Murzycki JF, Nalam MNL, Nalivaika EA, Özen A, Prabu-Jeyabalan MM, Thayer K, Schiffer CA. Viruses. 2010;2:2509–2535. doi: 10.3390/v2112509. [DOI] [PMC free article] [PubMed] [Google Scholar]
- 24.Hornak V, Simmerling C. Drug Discovery Today. 2007;12:132–138. doi: 10.1016/j.drudis.2006.12.011. [DOI] [PMC free article] [PubMed] [Google Scholar]
- 25.Foulkes-Murzycki JE, Scott WRP, Schiffer CA. Structure. 2007;15:225–233. doi: 10.1016/j.str.2007.01.006. [DOI] [PMC free article] [PubMed] [Google Scholar]
- 26.Foulkes JE, Prabu-Jeyabalan M, Cooper D, Henderson GJ, Harris J, Swanstrom R, Schiffer CA. J. Virology. 2006;80:6906–6916. doi: 10.1128/JVI.01900-05. [DOI] [PMC free article] [PubMed] [Google Scholar]
- 27.Vendruscolo M, Dobson CM. Science. 2006;313:1586–1587. doi: 10.1126/science.1132851. [DOI] [PubMed] [Google Scholar]
- 28.Svergun DI. Solution Scattering from Biopolymers: Advanced Contrast-Variation Data Analysis. Acta Cryst. 1994;AS0:391–402. (1994). [Google Scholar]
- 29.Fischetti R, Stepanov S, Rosenbaum G, Barrea R, Black E, Gore D, Heurich R, Kondrashkina E, Kropf AJ, Wang S, Zhang K, Irving TC, Bunker GB. J Synchrotron Radiat. 2004;11:399–405. doi: 10.1107/S0909049504016760. [DOI] [PubMed] [Google Scholar]
- 30.Hammersley AP. ESRF Internal Report, ESRF97HA02T. 1997. [Google Scholar]
- 31.Hammersley AP. ESRF Internal Report, ESRF98HA01T. 1998. [Google Scholar]
- 32.Bardhan JP, Park S, Makowski L. J. Appl. Cryst. 2009;42:932–943. doi: 10.1107/S0021889809032919. [DOI] [PMC free article] [PubMed] [Google Scholar]
- 33.Phillips JC, Braun R, Wang W, Gumbart J, Tajkhorshid E, Villa E, Chipot C, Skeel RD, Kale L, Schulten K. J. Comput. Chem. 2005;26:1781. doi: 10.1002/jcc.20289. [DOI] [PMC free article] [PubMed] [Google Scholar]
- 34.Svergun DI. Determination of the regularization parameter in indirect-transform methods using perceptual criteria. J. Appl. Crystallogr. 1992;25:495–503. [Google Scholar]


