

Abstract
The identification of tumor antigens remains a major objective in tumor immunology, especially in pediatric malignancies where solid tumors often do not express a single dominant antigen. Methods such as the Serological Screening of Recombinant cDNA Expression Libraries (SEREX) have been used in the discovery of tumor‐expressed proteins by virtue of their ability to induce an antibody response. To focus and accelerate this approach, we first identified candidate antigens by gene expression profiling data from clinical neuroblastoma specimens and then used an animal model to generate an antibody response to an engineered cell‐based vaccine. Candidate tumor antigens were expressed as recombinant proteins in a mammalian system and screened for antibody recognition using serum from mice vaccinated with a neuroblastoma cell‐based vaccine engineered to express CD80 and CD86, with or without Treg depletion. Through this procedure, the never in mitosis A (NIMA)‐related kinase NEK2 was identified as a tumor‐associated antigen. Direct testing of serum from patients newly diagnosed with neuroblastoma showed specific serological responses in two of 20 patients. Although NEK2 was not universally recognized, it may serve as a tumor antigen for some patients. (Cancer Sci 2010; 101: 2316–2324)
Serological Screening of Recombinant cDNA Expression Libraries (SEREX) has been a successful strategy for tumor antigen identification, utilizing a prokaryotic expression system and serum from a tumor‐bearing host to screen a cDNA library created from that tumor.( 1 , 2 , 3 ) SEREX has identified over 2100 tumor antigens, the majority of which are over‐expressed non‐mutated self‐proteins.( 3 , 4 ) Microarray technology, which allows the expression levels of all known transcripts in a tissue sample to be measured, may identify tumor antigens based on this criteria.( 5 , 6 )
To use expression‐profiling data for the discovery of new tumor antigens, we developed a methodology that incorporates both serological immune responses and gene expression analysis, focusing on a small set of tumor‐expressed candidate genes, and the immune response to them. Our use of a mammalian gene expression system is more likely to preserve epitopes requiring post‐translational modification, shown to be important in antibody recognition of both tumor and viral antigens.( 7 , 8 , 9 , 10 , 11 )
We used microarray data to identify transcripts that are over‐expressed in human neuroblastoma. Mouse homologs of these transcripts were then cloned as a fusion gene with Renilla luciferase (Rluc), expressed in a eukaryotic cell line, and then screened for recognition by antibody from tumor‐immune mice by luciferase immunoprecipitation (LIPS) assays.( 8 , 11 ) In this manner, tumor‐specific transcripts identified by microarray analysis were directly tested for immunogenicity (Fig. 1).
Figure 1.
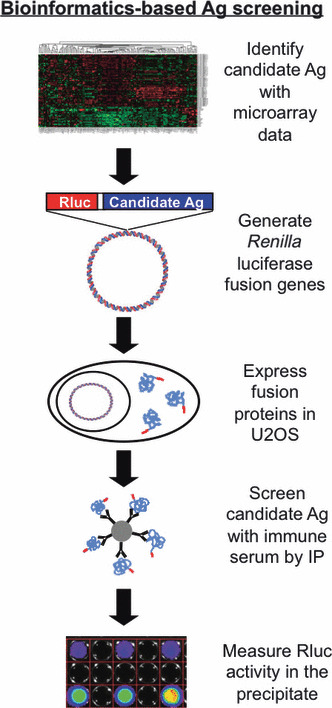
Bioinformatics‐based serological tumor‐antigen (Ag) discovery. Gene expression profiling was used to identify over‐expressed transcripts in human neuroblastoma. Murine homologs of these genes were cloned to generate fusion genes with Renilla luciferase (Rluc). U2OS cells were transfected with the fusion genes and the presence of antibodies against each protein was tested in luciferase immunoprecipitation assays using protein A/G beads coated with serum from mice vaccinated with AGN2a‐80/86 cell‐line with or without Treg depletion. Precipitation of fusion protein was measured by luminometry, demonstrating the presence/absence of treatment‐induced antibody to candidate antigens.
We have previously reported the ability to use a cell‐based vaccine to induce immunity to the murine neuroblastoma cell‐line AGN2a by engineering the cell line to express CD80 and CD86 (AGN2a‐80/86).( 12 ) The vaccine effect is enhanced by depletion of regulatory T cells.( 13 ) Vaccinated mice also develop a strong antibody response.( 14 ) Here, we identify NEK2 as a target of the vaccine‐induced immune response. In some neuroblastoma patients, NEK2‐reactive antibody was also detected, confirming our new approach to tumor antigen identification.
Materials and Methods
Vaccination and collection of immune mouse serum. A/J mice (Jackson Labs, Bar Harbor, ME, USA) were housed in the MCW Biomedical Resource Center. All experiments were carried out with approval of the MCW Institutional Animal Care and Use Committee. Mice were separated into four groups: (i) PC61 treatment (purified anti‐CD25 monoclonal antibody, 250 μg, injected intraperitoneally on day ‐10); (ii) vaccination (2 × 10⁶ AGN2a‐80/86 cell‐line injected subcutaneously on days ‐7 and 0); (iii) PC61 plus vaccination; and (iv) tumor‐bearing (106 AGN2a cells injected subcutaneously on day ‐7). On day 5, blood was collected from the tail vein and serum frozen at −80°C.
Cell‐lines and cell culture. The AGN2a cell‐line and the AGN2a‐CD80/86 vaccine cell‐line were cultured in supplemented cDMEM media as previously described.( 12 ) The human osteosarcoma cell‐line U2OS was cultured in RPMI with 10% FBS (Gemini Bio‐Products, West Sacramento, CA, USA), penicillin, streptomycin and L‐glutamine (Invitrogen, Carlsbad, CA, USA).
Identification of candidate tumor antigens. To identify genes over‐expressed in neuroblastoma, the Small Round Blue Cell Tumor (SRBCT) database was searched for genes over‐expressed in neuroblastoma relative to other tumor types (http://pob.abcc.ncifcrf.gov/cgi‐bin/JK). The SRBTC‐identified neuroblastoma‐specific gene list was supplemented with genes previously identified as over‐expressed in neuroblastoma.( 15 , 16 , 17 , 18 , 19 ) The complete gene list was then examined in a dataset of gene expression profiles of 43 human neuroblastoma samples and 13 non‐neoplastic, control tissue samples using the Affymetrix Genechip human genome U133 AB.( 20 ) The .cel files were exported from Affymetrix GCOS software (Santa Clara, CA, USA) and normalized in dChip to the median intensity using the PM‐only model.
RT‐PCR and cloning of mouse homologs from the AGN2a cell line. Mouse homologs of over‐expressed transcripts were identified by the GeneCards database and primers designed using e‐PCR.( 21 , 22 ) RNA was extracted using Trizol (Invitrogen), DNase treated (Ambion, Austin, TX, USA) and reverse transcribed using Superscript III (Invitrogen). AGN2a cDNA was screened by PCR, with annealing temperatures based on the Tm of the primer sets. Reactions yielding no product were repeated using varying annealing temperatures (45–70°C). The forward primer for each homolog was designed to insert a NdeI or AseI restriction enzyme site up stream of the gene. The reverse primers encoded a BamHI site, BglII site or a BclI site downstream of the stop codon. The PCR products were cloned into the TOPO‐TA vector (Invitrogen), sequenced, and then used to generate Rluc fusion genes.
Generation of Rluc candidate antigen fusion genes. The Renilla luciferase (Rluc) gene was PCR amplified from the phRL‐CMV plasmid (Promega, Madison, WI, USA). Primers were designed to add a NdeI site and an XbaI/NheI/SpeI site upstream of Rluc and to replace the stop codon with a thrombin linker followed by BamHI and NdeI sites. The PCR products were cloned into TOPO‐ZeroBlunt (Invitrogen) and sequenced. To generate Rluc candidate antigen fusion genes, Rluc was cloned into the NdeI site upstream of the candidate antigens (in TOPO‐TA). Fusion genes were subcloned into the pcDNA3.1/Hygro(−) mammalian expression vector (Invitrogen) at the XbaI and BamHI sites. Cloning of tumor‐expressed NCAM revealed the presence of three variants. Ncam1(W) encoded the published amino acid sequence, whereas Ncam1(A) and Ncam1(D) each exhibited an insertion at the junction of exons 12 and 13. Ncam1(D) also contained an insertion at the junction of exon 13 and exon 14. Each variant was cloned.
Expression of Rluc candidate antigen fusion proteins. U2OS cells were plated in 96‐well black plates at 5 × 10⁴ cells per well and transfected 24 h later with 0.2 μg pcDNA3.1/Hygro(−) fusion‐gene‐encoding plasmid and 0.5 μL of Lipofectamine 2000 (Invitrogen). Cells were cultured for 48 h, colenterazine (Biotium, Hayward, CA, USA) was added (1 μg/mL), and light production measured on the Lumina In vivo Imaging System (Xenogen, Alameda, CA, USA). Light production was observed with each fusion gene.
Rluc candidate antigen western blot. Transfected U2OS were harvested, washed twice, and resuspended pellets were boiled in lithium dodecyl sulfate (LDS) sample buffer with a reducing agent (NuPAGE; Invitrogen). Samples were separated on 4–12% Bis‐Tris Mini Gels in MOPS SDS running buffer and protein transferred to PVDF membranes (NuPAGE; Invitrogen). Membranes were washed, blocked and probed with a mouse anti‐Rluc monoclonal antibody (1:500, 1D5.2; Millipore, Billerica, MA, USA) followed by alkaline phosphatase‐labeled rabbit anti‐mouse IgG (H + L) antibody (1:100; Abcam, Cambridge, MA, USA). The membrane was washed and incubated in BCIP/NBT substrate (Sigma, St Louis, MO, USA). Blots were stripped with 0.2 M glycine (pH, 2.9) at 55°C, washed and reprobed with rabbit anti‐actin antibody (1:5000; Novus, Littleton, CO, USA) followed by alkaline phosphatase‐labeled goat anti‐rabbit IgG (1:1000; Santa Cruz Biotech, Santa Cruz, CA, USA) and CDP‐Star (Roche, Indianapolis, IN, USA) chemiluminescent reagent.
Murine luciferase immunoprecipitations. Five × 106 U2OS cells were plated in a 10 cm2 tissue culture plate and transfected the following day with 16 μg of fusion gene plasmid and 40 μL Lipofectamine 2000 (Invitrogen), and lysates were collected 48 h later. Protein A/G agarose beads (Calbiochem, Gibbstown, NJ, USA) were washed and loaded with 2 μg of goat anti‐mouse IgG (H + L), goat anti‐mouse μ‐chain or goat anti‐mouse Fcγ heavy chain (Jackson ImmunoResearch, West Grove, PA, USA). Beads were incubated with serum overnight at 4°C while rotating end‐over‐end. For Bcl‐2 dose‐response experiments, beads were incubated overnight at 4°C with various amounts of anti‐Bcl2 antibody (Abcam) or affinity purified IgG (Jackson ImmunoResearch). Serum‐loaded beads were incubated with lysates at 4°C overnight. Beads were pelleted, washed and transferred to a 96‐well black plate. Colenterazine was added to each well (1 μg/mL) and light production was measured using the Victor3 luminometer (PerkinElmer, Waltham, MA, USA). Readings were recorded in relative light units (RLU) and normalized to no serum controls.
Human luciferase immunoprecipitations and human serum. The LIPS assays were performed using protein A/G beads loaded with human serum. The serum was from 20 newly diagnosed neuroblastoma patients, generously provided by the Children’s Oncology Group (COG) Neuroblastoma Biology Committee (Dr Michael Hogarty, chair). The control patient serum was generously provided under approved protocol by Dr Paul Sondel, University of Wisconsin School of Medicine (Madison, WI, USA). Immunoprecipitation assays were carried out with lysate from U2OS cells transfected with either NEK2‐Rluc (human NEK2 clone NM_002497.2; Origene Technologies, Rockville, MD, USA) or GFP‐Rluc fusion gene plasmids.
Statistics. GraphPad Prism (GraphPad Software, La Jolla, CA, USA) was used for statistical analysis. For all tests, a P‐value of <0.05 was considered significant.
Results
There are few known antigens consistently associated with neuroblastoma, which thus limits the development of antigen‐specific immunotherapy.( 23 , 24 , 25 , 26 ) The SRBCT dataset of the Oncogenomics database was searched for genes over‐expressed in neuroblastoma and 38 potential neuroblastoma antigens were identified. We supplemented this list with 26 genes previously identified as being over‐expressed in neuroblastoma, such as survivin and NTRK2.( 16 , 17 , 18 , 19 ) To determine if these transcripts were over‐expressed relative to normal tissues, expression profiling data from clinical neuroblastoma samples were assessed.( 20 ) We found that the majority of genes identified as over‐expressed in the SRBTC database were also over‐expressed in neuroblastoma relative to normal tissues (Figs 2,S1).
Figure 2.
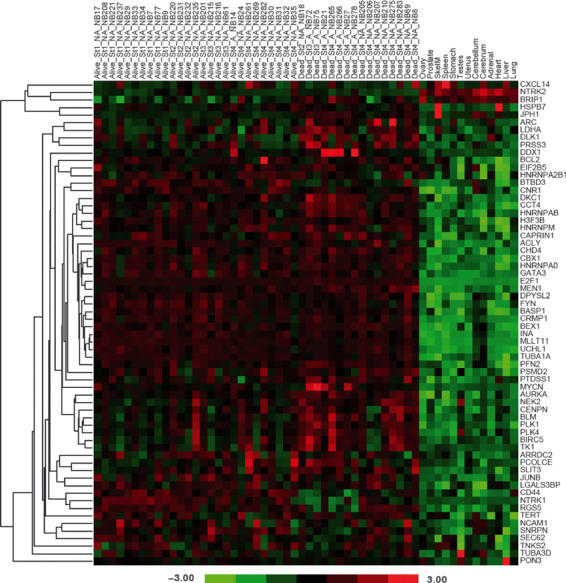
Identification of over‐expressed genes in neuroblastoma. Gene expression data was mined to identify transcripts over‐expressed by neuroblastoma. The gene list was examined in a microarray dataset of 43 clinical neuroblastoma samples and 13 normal tissue samples. For each neuroblastoma sample the clinical outcome (Alive/Dead), clinical stage at the time of collection (St1–St4) and MYCN amplification (A) or non‐amplification (NA) was recorded. The heatmap represents the relative expression of these genes in tumor and normal samples. The color map represents the z‐scored expression values across all samples.
A major aim of the present study was to use a mouse model of tumor immunity to screen potential antigens identified by gene expression profiling in patients. The motivation for using a mouse model of protective immunity was that clinical serum samples are frequently taken prior to treatment. Recently it has been demonstrated that antibodies generated in tumor‐bearing hosts recognize antigens to which the immune system had been tolerized.( 27 ) The post‐vaccination setting in our murine model provides a unique opportunity to identify tumor antigens to which protective responses are mounted. Prior to testing the candidate gene list, we tested AGN2a for expression of the mouse homologs of the genes identified in the clinical samples in Figure 2. AGN2a expressed the majority of these homologs (53/64), establishing them as relevant candidates (Table 1).
Table 1.
Murine homologs of human genes over‐expressed in neuroblastoma. The AGN2a cell line was screened by RT‐PCR for expression of the mouse homologs of the 64 genes identified in Figure 2 . Expression (+) or lack thereof (−) was determined by PCR
| Neuroblastoma gene | AGN2a expression |
|---|---|
| ACLY | + |
| ARC | + |
| ARRDC2 | − |
| AURKA | + |
| BASP1 | + |
| BCL2 | + |
| BEX1 | + |
| BIRC5 | + |
| BLM | + |
| BRIP1 | + |
| BTBD3 | + |
| CAPRIN1 | + |
| CBX1 | − |
| CCT4 | + |
| CD44 | + |
| CENPN | − |
| CHD4 | + |
| CNR1 | + |
| CRMP1 | + |
| CXCL14 | + |
| DDX1 | + |
| DKC1 | + |
| DLK1 | − |
| DPYSL2 | + |
| E2F1 | + |
| EIF2B5 | + |
| FYN | + |
| GATA3 | + |
| H3F3B | + |
| HNRNPA0 | + |
| HNRNPA2B1 | + |
| HNRNPAB | + |
| HNRNPM | − |
| HSPB7 | + |
| INA | + |
| JPH1 | + |
| JUNB | − |
| LDHA | + |
| LGALS3BP | + |
| MEN1 | + |
| MLLT11 | + |
| MYCN | + |
| NCAM1 | + |
| NEK2 | + |
| NTRK1 | − |
| NTRK2 | + |
| PCOLCE | + |
| PFN2 | + |
| PLK1 | + |
| PLK4 | + |
| PON3 | − |
| PRSS3 | − |
| PSMD2 | + |
| PTDSS1 | + |
| RGS5 | + |
| SEC62 | + |
| SLIT3 | + |
| SNRPN | + |
| TERT | − |
| TK1 | + |
| TNKS2 | − |
| TUBA1A | + |
| TUBA3D | + |
| UCHL1 | + |
Sixteen of the candidate antigens identified in Figure 2 and Table 1 were PCR amplified and cloned as Rluc fusion genes. Fifteen were cloned in their entirety (Plk4 was cloned as two overlapping fragments, Plk4‐N and Plk4‐C, encoding the N‐terminal and C‐terminal halves). For Brip1, 1750 bp of the 3′‐region of the coding sequence was cloned, generating Brip1‐C, encoding the C‐terminal half. Only tumor‐derived Ncam1 showed differences in the amino acid sequence from published sequences (as detailed in Methods, each was tested). Fusion genes were transfected into the human U2OS cell‐line, colenterazine was added, and light production was measured to test for the presence of fusion proteins (Fig. 3a). The samples were subsequently examined by western blot analysis using an anti‐Rluc antibody to verify production of the full‐length protein (Fig. 3b).
Figure 3.
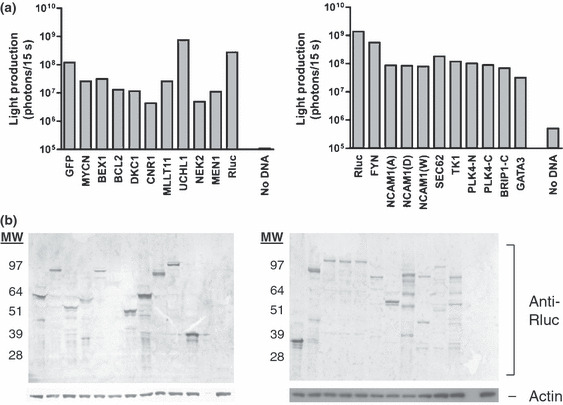
Generation of Renilla luciferase (Rluc) candidate antigen fusion proteins. (a) Candidate antigens identified in Figure 2 and Table 1 were cloned in frame with Rluc, U2OS cells were transfected, and Rluc activity at 48 h was tested. Colenterazine was then added and light production was measured. Non‐transfected U2OS cells (no DNA) served as a negative control. Results are representative of three experiments. (b) U2OS cells from Figure 3a were lysed, and separated by SDS‐PAGE. Protein was transferred to a PVDF membrane and probed with an anti‐Rluc antibody. Blots were also probed with an anti‐actin antibody as a loading control. Expected molecular weight (MW, kDa): GFP, 58; MYCN, 91; BEX1, 52; BCL2, 58; DKC1, 88; CNR1, 76; MLLT11, 50; UCHL1, 61; NEK2, 85; MEN1, 103; FYN, 82; NCOAM, 105; SEC62, 71; TK1, 54; PLK4‐N, 78; PLK4‐C, 76; BRIP1‐C, 95; GATA3, 88; Rluc, 38.
For standardizing LIPS, protein A/G beads were coated with serial dilutions of an anti‐Bcl2 antibody or control IgG and tested with lysate from Rluc‐Bcl2‐transfected U2OS. Luciferase activity was precipitated by anti‐Bcl2 antibody in a dose‐dependent manner and was significantly greater than control IgG, giving a detectable signal at a threshold of 1 ng of the precipitating antibody (P < 0.05, Fig. 4a). To determine if LIPS could be used to identify a model antigen expressed by a cell‐based vaccine, we vaccinated mice with GFP‐expressing AGN2a‐80/86 and screened for a reactive antibody. The GFP‐reactive antibody was detected in mice vaccinated with the GFP + AGN2a‐80/86 cell‐line, but not in the GFP‐negative controls (Fig. 4b).
Figure 4.
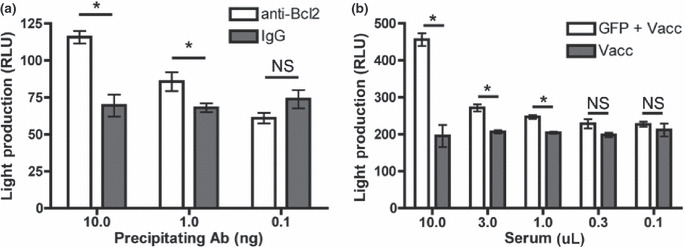
Determining the sensitivity of luciferase immunoprecipitation (LIPS) using anti‐Bcl2 antibody and GFP‐reactive serum. (a) Protein A/G beads were coated with serial dilutions of anti‐Bcl2 antibody or control IgG and used to precipitate Renilla luciferase (Rluc)‐Bcl2 fusion protein and light production (RLU, relative light units) was measured. (b) Mice were vaccinated with GFP‐expressing AGN2a‐80/86 cell‐line or control AGN2a‐80/86 cell‐line. Serum was collected, serial dilutions were used to coat protein A/G beads and LIPS was performed. Data were analyzed using an unpaired two‐tailed t‐test. *P < 0.05. NS, no significant difference in the means. Error bars represent the SEM.
Serum was then collected from mice treated with PC61 and/or vaccination to screen for recognition of the candidate antigens (Fig. 5). Nek2‐reactive antibodies were detected in the serum of mice treated with vaccine or with PC61 and vaccine (Fig. 5a). Mice treated with PC61 and vaccine also produced antibodies that precipitated Ncam1 (Fig. 5a).
Figure 5.
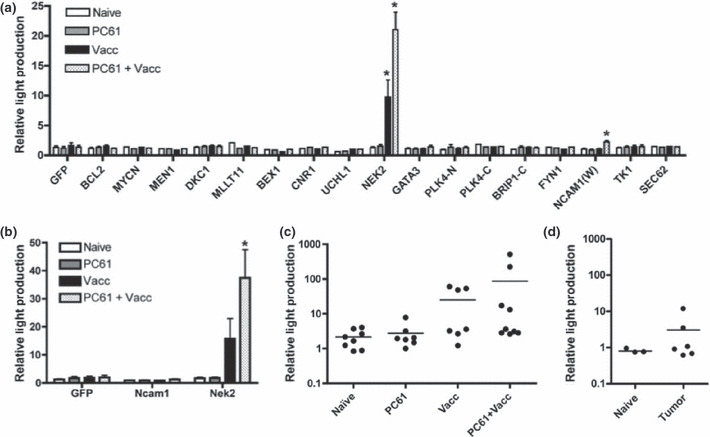
Identification of Nek2 as a tumor antigen. (a) Serum from mice treated with PC61 and/or AGN2a‐80/86 cell‐line was screened for antibody to the fusion proteins generated in Figure 3. The light production of the precipitated fractions was measured and normalized to the no serum control of each gene. (b) Serum from vaccinated mice was tested for Nek2‐reactive IgG. Using an IgG‐specific secondary antibody, Renilla luciferase (Rluc)‐Nek2, Rluc‐Ncam1 and Rluc‐GFP containing lysates were immunoprecipitated with serum from treated mice. Precipitated fractions were examined for light production and the results were normalized to the no serum controls. Serum from individual treated mice (c) or tumor‐bearing mice (d) was then examined for production of Nek2‐reactive IgG by luciferase immunoprecipitation (LIPS). Results were analyzed for each gene tested by anova and Dunnett’s multiple comparison test. *P < 0.05 relative to naïve. Error bars represent the SEM. Bars in (c) and (d) represent the mean value for the group.
IgG production is the result of class‐switching recombination (CSR).( 28 , 29 ) To examine the production of Nek2‐ and Ncam1‐reactive IgG, we performed LIPS using a secondary antibody specific for mouse IgG. Mice treated with PC61 and vaccine produced significantly more NEK2‐reactive IgG than naïve mice or mice treated with PC61 alone (P < 0.05, Fig. 5b). Mice treated with vaccine alone demonstrated a trend for higher levels of NEK2‐reactive IgG relative to naïve or PC61‐treated mice (Fig. 5b). Ncam1‐reactive IgG was not detected in any of the treatment groups, suggesting that the reactive antibodies were IgM (Fig. 5b).
In mice, pooled serum is commonly used in the initial screening of tumor antigens. While the production of NEK2‐reactive IgG was consistently observed in groups of vaccinated mice from multiple experiments, the individual variance of this response was unknown. SEREX and ELISA results from the HER‐2/neu breast cancer model suggest that antibody responses to tumor antigens identified with pooled serum may be heterogeneous on a mouse‐to‐mouse level.( 30 ) We found that production of NEK2‐reactive IgG was heterogeneous (Fig. 5c). Forty‐four percent of mice treated with the vaccine (with or without PC61) produced NEK2‐reactive IgG at five standard deviations above the mean of naïve mice, demonstrating variability in NEK2 recognition. To determine if the absence of NEK2‐reactive IgG was due to a lack of CSR, experiments were repeated to determine the frequency of mice producing NEK2‐reactive IgM. Only mice producing NEK2‐reactive IgG produced NEK2‐reactive IgM (data not shown), suggesting that the variability lies in the initial recognition of NEK2 as an antigen.
Antibodies against tumor antigens have been observed in cancer patients; however, it is not known if the same antigens are recognized after vaccination with a cell‐based vaccine. To test tumor‐bearing mice for anti‐NEK2 antibody, mice were inoculated with 106 live AGN2a cells and serum was collected 12 days later. A subset of tumor‐bearing mice (33%) produced NEK2‐reactive IgG (Fig. 5d). The tumor‐bearing mice produced lower levels of NEK2‐reactive IgG than vaccinated mice (Fig. 5c,d). Similar to vaccinated mice, only the mice that had generated NEK2‐reactive IgG generated NEK2‐reactive IgM (data not shown). Thus, immunization with a cell‐based vaccine is required for a heightened response.
Antibody responses to tumor antigens is somewhat conserved between species.( 30 ) To test our model, human NEK2 (NM_002497.2) was cloned and tested in the same assay using serum from newly diagnosed neuroblastoma patients (patient details described in Table S1) or from healthy controls. To control for the presence of IgG against the Rluc fragment and/or the linker peptide, serum reactivity to GFP‐Rluc was also tested. Two of the 20 patient sera demonstrated significant and specific NEK2 reactivity (P0386 and P0235) relative to the no serum controls (Fig. 6, P < 0.001). A third sample (P0010) also recognized GFP‐Rluc, suggesting an antibody response to backbone fusion protein elements (Fig. 6). No healthy controls showed NEK2 reactivity. Sample P0386 was found to have significantly more NEK2 reactivity than any of the healthy control sera (Fig. 6, P < 0.001). Sample P0235 also demonstrated a significantly higher level of NEK2 reactivity than five of the six healthy control serum samples (Fig. 6, P < 0.001).
Figure 6.
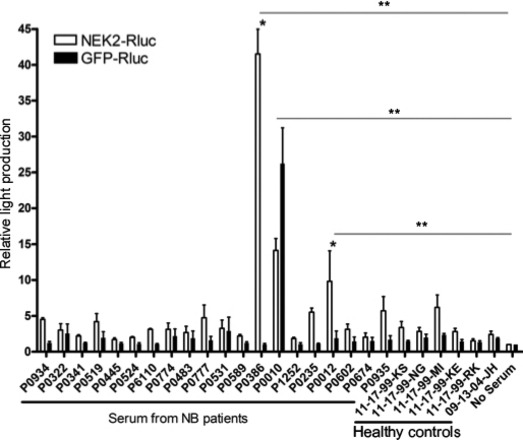
Identification of NEK2‐reactive antibodies in the serum of neuroblastoma (NB) patients. Serum from neuroblastoma patients or from healthy (normal) control was used in luciferase immunoprecipitation (LIPS) assays with NEK2‐Rluc fusion protein. GFP‐Rluc fusion proteins served as a control. Bars represent the median relative light production of three independent experiments. Error bars represent the SEM. *P < 0.001 when comparing serum reactivity against NEK2‐Rluc vs GFP‐Rluc using two‐way anova with Bonferoni post‐test. **P < 0.001 when comparing serum reactivity against NEK2‐Rluc vs no serum control using one‐way anova with Bonferoni post‐test.
Finally, we used the Oncogenomics datasets (NCI Pediatric Oncology Branch) to test for the prognostic value of NEK2 expression and to determine if NEK2 expression correlates with an established molecular marker for aggressive neuroblastoma, MYCN amplification. When NEK2 gene expression was divided between high (n = 126) and low expressors (n = 125), a strong association was seen with high NEK2 expression and decreased survival (Fig. 7). Similarly, in stage 4 MYCN‐amplified disease, a strong correlation between NEK2 and MYCN over‐expression was seen (Fig. S2).
Figure 7.
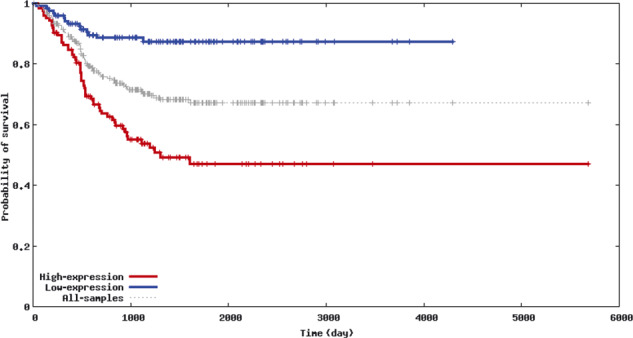
NEK2 over‐expression is a marker of poor prognosis in neuroblastoma. The Obertheur Lab Dataset of the Neuroblastoma Prognosis Database (http://home.ccr.cancer.gov/oncology/oncogenomics/) was used to compare survival data of patients with NEK2 over‐expressing neuroblastoma (n = 126) with the survival of patients without NEK2 over‐expression (n = 125). The Kaplan–Meier plot shows the probability of survival vs survival duration. The difference in survival curves between the two groups was highly significant (P = 5.533 × 10⁻⁹) owing to the large number of samples analyzed and large difference in the outcome, demonstrating the depth of this dataset. The generation of this dataset was described previously.( 55 )
Discussion
Tumor antigens include proteins that are mutated, contain unique splice variants, are of viral origin, or that once functioned as differentiation or tissue‐restricted antigens.( 31 , 32 ) Genome‐scale searches for tumor‐specific antigens are being evaluated, but are limited by the difficulty in phrasing search parameters and the small sample size of the primary datasets.( 33 ) The over‐expression of cancer‐associated transcripts can generate cancer antigens by altered glycosylation and expression of unique antigenic epitopes or the inappropriate expression of developmental antigens.( 34 , 35 , 36 )
SEREX is limited by the use of prokaryotic expression systems, and the use of “at diagnosis” serum samples. Tumor‐bearing hosts can be tolerant to tumor antigens, and the use of antibodies from these sources may not identify antigens important for tumor rejection.( 27 , 37 , 38 , 39 ) We addressed these issues by developing a novel methodology for the identification of tumor antigens. By using clinical gene expression profiling data, we identified a narrow set of over‐expressed genes (Fig. 2). A subset of these genes was then cloned as Rluc fusion proteins (Fig. 3) and screened for antibody recognition in an established murine model of neuroblastoma immunity (Fig. 5a). One potential limitation of our approach is the frequency with which candidate antigens are identified. In our studies, only one of 17 antigens, NEK2, was a strong target (Fig. 5a). While this finding is significant, a higher throughput approach may prove more effective in detecting new antigens.
The production of NEK2‐reactive IgG was observed in mice treated with vaccine and enhanced by the inhibition of regulatory T cells (Fig. 5b). We also examined the production of NEK2‐reactive antibodies in mice inoculated with the parental tumor and found the humoral response to NEK2 to be diminished in tumor‐bearing mice in comparison with mice vaccinated with AGN2a‐CD80/CD86 (Fig. 5c,d). Thus, vaccination and regulatory T‐cell inhibition is required for a strong response to this tumor/self antigen.
In the SEREX database hosted by Cancer Immunity (http://www.cancerimmunity.org), 11 genes are reported as associated with neuroblastoma. Topoisomerase IIα was the most common hit,( 3 ) along with three other antigens encoded by the amplified region on 17q, CCX5, HEXIM1 and HOXB6.( 40 ) Behrends et al.,( 41 ) identified 10 antigens by SEREX, including the Hu and NNP‐1 neuronal antigens. These studies, and our own published mouse studies, did not detect NEK2.( 42 ) However, using gene expression profiling, Landi et al. ( 43 ) found that expression of NEK2 and TTK were key components of a gene expression signature of cigarette smoking, as well as of early stage tumors.
NEK2 plays a regulatory role in cell division.( 44 , 45 , 46 ) Over‐expression has been reported in several types of cancer and correlates with a poor clinical outcome.( 47 , 48 , 49 , 50 , 51 , 52 , 53 , 54 ) Here, we demonstrate that NEK2 expression is associated with a poor prognosis (Fig. 7 and reference 19), perhaps due to the correlation of NEK2 overexpression with MYCN amplification (Fig. S2). These data suggest that NEK2 is a potential therapeutic target.
Disclosure Statement
The authors have no conflict of interest or disclosures.
Supporting information
Fig. S1. Candidate gene expression in neuroblastoma tumor tissue and normal human tissue controls. Gene expression profiling data from 43 patients and normal tissue controls (on the top horizontal axis of the figure, patients are listed according to viability; normal tissues are: ovary, prostate, skeletal muscle, spleen, stomach, testes, uterus, cerebellum, cerebrum, adrenal, heart, liver and lung) were assembled from the Oncogenomics Website (http://pob.abcc.ncifcrf.gov/cgi‐bin/JK) as detailed in Methods. Relative gene expression is presented as a heat‐map and hierarchically clustered (left vertical axis), allowing for the identification of a small number of transcripts that are also expressed in normal tissues (bottom right shows the clustered heat‐map region for these normal tissues samples).
Fig. S2. Correlation of MYCN and NEK2 expression. Using the National Cancer Institute, NIH, USA (NCI) Neuroblastoma cDNA mRNA Expression Database (hosted as described in Table S1), gene expression in normal tissue (A) and stage 4 MYCN‐amplified neuroblastoma samples (B) for NEK2 and MYCN was analyzed using the Pearson correlation method. Although trends were seen for other datasets (stage 4 MYCN non‐amplified, r = 0.277, P = 0.063 and stage 1 non‐amplified, r = 0.36, P = 0.0295), only MYCN amplified stage 4 proved statistically significant.
Table S1. Patient data. Serum provided by the Children’s Oncology Group (COG) was analyzed for specific patient characteristics. Serum was collected according to original protocol and distributed according to the quality of the submitted sample, and thus not always complete for these specimens. MYCN amplification status, ploidy, INSS stage (International Neuroblastoma Staging System), Shimada histology, and age at diagnosis are provided, as available, for each sample courtesy of Dr. Wendy London, Lead Statistician for Neuroblastoma, Children’s Oncology Group.
Supporting info item
Supporting info item
Supporting info item
Acknowledgments
These studies were supported by the Midwest Athletes Against Childhood Cancer (MACC Fund, Inc., Milwaukee, WI, USA), an American Cancer Society Internal Research Grant (ACS IRG‐170) to R. Orentas, and a US Public Health Service Grant (CA100030) to B. Johnson. We thank James Weber for expert technical assistance.
References
- 1. Sahin U, Tureci O, Schmitt H et al. Human neoplasms elicit multiple specific immune responses in the autologous host. Proc Natl Acad Sci U S A 1995; 92: 11810–3. [DOI] [PMC free article] [PubMed] [Google Scholar]
- 2. Sahin U, Tureci O, Pfreundschuh M. Serological identification of human tumor antigens. Curr Opin Immunol 1997; 9: 709–16. [DOI] [PubMed] [Google Scholar]
- 3. Chen YT. Identification of human tumor antigens by serological expression cloning: an online review on SEREX. Cancer Immunity, Cancer Research Institute, [serial on the Internet]. 2004. Accessed Date February 1, 2009.
- 4. Jager E, Chen YT, Drijfhout JW et al. Simultaneous humoral and cellular immune response against cancer‐testis antigen NY‐ESO‐1: definition of human histocompatibility leukocyte antigen (HLA)‐A2‐binding peptide epitopes. J Exp Med 1998; 187: 265–70. [DOI] [PMC free article] [PubMed] [Google Scholar]
- 5. Schena M, Shalon D, Davis RW, Brown PO. Quantitative monitoring of gene expression patterns with a complementary DNA microarray. Science 1995; 270: 467–70. [DOI] [PubMed] [Google Scholar]
- 6. Lipshutz RJ, Fodor SP, Gingeras TR, Lockhart DJ. High density synthetic oligonucleotide arrays. Nat Genet 1999; 1(Suppl): 20–4. [DOI] [PubMed] [Google Scholar]
- 7. Gunawardana CG, Diamandis EP. High throughput proteomic strategies for identifying tumour‐associated antigens. Cancer Lett 2007; 249: 110–9. [DOI] [PubMed] [Google Scholar]
- 8. Burbelo PD, Ching KH, Mattson TL, Light JS, Bishop LR, Kovacs JA. Rapid antibody quantification and generation of whole proteome antibody response profiles using LIPS (luciferase immunoprecipitation systems). Biochem Biophys Res Commun 2007; 352: 889–95. [DOI] [PubMed] [Google Scholar]
- 9. Lin S, Arcangel P, Medina‐Selby A et al. Design of novel conformational and genotype‐specific antigens for improving sensitivity of immunoassays for hepatitis C virus‐specific antibodies. J Clin Microbiol 2005; 43: 3917–24. [DOI] [PMC free article] [PubMed] [Google Scholar]
- 10. Race EM, Ramsey KM, Lucia HL, Cloyd MW. Human immunodeficiency virus infection elicits early antibody not detected by standard tests: implications for diagnostics and viral immunology. Virology 1991; 184: 716–22. [DOI] [PubMed] [Google Scholar]
- 11. Burbelo PD, Goldman R, Mattson TL. A simplified immunoprecipitation method for quantitatively measuring antibody responses in clinical sera samples by using mammalian‐produced Renilla luciferase‐antigen fusion proteins. BMC Biotechnol 2005; 5: 22. [DOI] [PMC free article] [PubMed] [Google Scholar]
- 12. Johnson BD, Yan X, Schauer DW, Orentas RJ. Dual expression of CD80 and CD86 produces a tumor vaccine superior to single expression of either molecule. Cell Immunol 2003; 222: 15–26. [DOI] [PubMed] [Google Scholar]
- 13. Johnson BD, Jing W, Orentas RJ. CD25 + regulatory T cell inhibition enhances vaccine‐induced immunity to neuroblastoma. J Immunother 2007; 30: 203–14. [DOI] [PubMed] [Google Scholar]
- 14. Zheng J, Kohler ME, Chen Q et al. Serum from mice immunized in the context of Treg inhibition identifies DEK as a neuroblastoma tumor antigen. BMC Immunol 2007; 8: 4. [DOI] [PMC free article] [PubMed] [Google Scholar]
- 15. Khan J, Wei JS, Ringner M et al. Classification and diagnostic prediction of cancers using gene expression profiling and artificial neural networks. Nat Med 2001; 7: 673–9. [DOI] [PMC free article] [PubMed] [Google Scholar]
- 16. Brodeur GM. Neuroblastoma: biological insights into a clinical enigma. Nat Rev Cancer 2003; 3: 203–16. [DOI] [PubMed] [Google Scholar]
- 17. Berwanger B, Hartmann O, Bergmann E et al. Loss of a FYN‐regulated differentiation and growth arrest pathway in advanced stage neuroblastoma. Cancer Cell 2002; 2: 377–86. [DOI] [PubMed] [Google Scholar]
- 18. Wei JS, Greer BT, Westermann F et al. Prediction of clinical outcome using gene expression profiling and artificial neural networks for patients with neuroblastoma. Cancer Res 2004; 64: 6883–91. [DOI] [PMC free article] [PubMed] [Google Scholar]
- 19. Krasnoselsky AL, Whiteford CC, Wei JS et al. Altered expression of cell cycle genes distinguishes aggressive neuroblastoma. Oncogene 2005; 24: 1533–41. [DOI] [PubMed] [Google Scholar]
- 20. Chen QR, Song YK, Wei JS et al. An integrated cross‐platform prognosis study on neuroblastoma patients. Genomics 2008; 92: 195–203. [DOI] [PMC free article] [PubMed] [Google Scholar]
- 21. Rebhan M, Chalifa‐Caspi V, Prilusky J, Lancet D. GeneCards: a novel functional genomics compendium with automated data mining and query reformulation support. Bioinformatics 1998; 14: 656–64. [DOI] [PubMed] [Google Scholar]
- 22. Schuler GD. Sequence mapping by electronic PCR. Genome Res 1997; 7: 541–50. [DOI] [PMC free article] [PubMed] [Google Scholar]
- 23. Rousseau RF, Brenner MK. Vaccine therapies for pediatric malignancies. Cancer J 2005; 11: 331–9. [DOI] [PubMed] [Google Scholar]
- 24. Rodolfo M, Luksch R, Stockert E et al. Antigen‐specific immunity in neuroblastoma patients: antibody and T‐cell recognition of NY‐ESO‐1 tumor antigen. Cancer Res 2003; 63: 6948–55. [PubMed] [Google Scholar]
- 25. Prasannan L, Misek DE, Hinderer R, Michon J, Geiger JD, Hanash SM. Identification of beta‐tubulin isoforms as tumor antigens in neuroblastoma. Clin Cancer Res 2000; 6: 3949–56. [PubMed] [Google Scholar]
- 26. Coughlin CM, Fleming MD, Carroll RG et al. Immunosurveillance and survivin‐specific T‐cell immunity in children with high‐risk neuroblastoma. J Clin Oncol 2006; 24: 5725–34. [DOI] [PubMed] [Google Scholar]
- 27. Willimsky G, Czeh M, Loddenkemper C et al. Immunogenicity of premalignant lesions is the primary cause of general cytotoxic T lymphocyte unresponsiveness. J Exp Med 2008; 205: 1687–700. [DOI] [PMC free article] [PubMed] [Google Scholar]
- 28. Manis JP, Tian M, Alt FW. Mechanism and control of class‐switch recombination. Trends Immunol 2002; 23: 31–9. [DOI] [PubMed] [Google Scholar]
- 29. King C, Tangye SG, Mackay CR. T follicular helper (TFH) cells in normal and dysregulated immune responses. Annu Rev Immunol 2008; 26: 741–66. [DOI] [PubMed] [Google Scholar]
- 30. Lu H, Knutson KL, Gad E, Disis ML. The tumor antigen repertoire identified in tumor‐bearing neu transgenic mice predicts human tumor antigens. Cancer Res 2006; 66: 9754–61. [DOI] [PubMed] [Google Scholar]
- 31. Janeway CA, Travers P, Walport M, Shlomchik M. The immune system in health and disease. http://www.garlandscience.com ; 2001.
- 32. Dermime S, Armstrong A, Hawkins RE, Stern PL. Cancer vaccines and immunotherapy. Br Med Bull 2002; 62: 149–62. [DOI] [PubMed] [Google Scholar]
- 33. Jia J, Cui J, Liu X et al. Genome‐scale search of tumor‐specific antigens by collective analysis of mutations, expressions and T‐cell recognition. Mol Immunol 2009; 46: 1824–9. [DOI] [PubMed] [Google Scholar]
- 34. Ninkovic T, Kinarsky L, Engelmann K et al. Identification of O‐glycosylated decapeptides within the MUC1 repeat domain as potential MHC class I (A2) binding epitopes. Mol Immunol 2009; 47: 131–40. [DOI] [PMC free article] [PubMed] [Google Scholar]
- 35. Alves PM, Levy N, Stevenson BJ et al. Identification of tumor‐associated antigens by large‐scale analysis of genes expressed in human colorectal cancer. Cancer Immun 2008; 8: 11. [PMC free article] [PubMed] [Google Scholar]
- 36. Oba‐Shinjo SM, Caballero OL, Jungbluth AA et al. Cancer‐testis (CT) antigen expression in medulloblastoma. Cancer Immun 2008; 8: 7. [PMC free article] [PubMed] [Google Scholar]
- 37. Staveley‐O’Carroll K, Sotomayor E, Montgomery J et al. Induction of antigen‐specific T cell anergy: an early event in the course of tumor progression. Proc Natl Acad Sci U S A 1998; 95: 1178–83. [DOI] [PMC free article] [PubMed] [Google Scholar]
- 38. Cuenca A, Cheng F, Wang H et al. Extra‐lymphatic solid tumor growth is not immunologically ignored and results in early induction of antigen‐specific T‐cell anergy: dominant role of cross‐tolerance to tumor antigens. Cancer Res 2003; 63: 9007–15. [PubMed] [Google Scholar]
- 39. Willimsky G, Blankenstein T. Sporadic immunogenic tumours avoid destruction by inducing T‐cell tolerance. Nature 2005; 437: 141–6. [DOI] [PubMed] [Google Scholar]
- 40. Stone B, Schummer M, Paley PJ et al. Serologic analysis of ovarian tumor antigens reveals a bias toward antigens encoded on 17q. Int J Cancer 2003; 104: 73–84. [DOI] [PubMed] [Google Scholar]
- 41. Behrends U, Jandl T, Golbeck A et al. Novel products of the HUD, HUC, NNP‐1 and alpha‐internexin genes identified by autologous antibody screening of a pediatric neuroblastoma library. Int J Cancer 2002; 100: 669–77. [DOI] [PubMed] [Google Scholar]
- 42. Zheng J, Jing W, Orentas RJ. Discovery of YB‐1 as a new immunological target in neuroblastoma by vaccination in the context of regulatory T cell blockade. Acta Biochim Biophys Sin 2009; 41: 980–90. [DOI] [PubMed] [Google Scholar]
- 43. Landi MT, Dracheva T, Rotunno M et al. Gene expression signature of cigarette smoking and its role in lung adenocarcinoma development and survival. PLoS ONE 2008; 3: e1651. [DOI] [PMC free article] [PubMed] [Google Scholar]
- 44. O’Connell MJ, Krien MJ, Hunter T. Never say never The NIMA‐related protein kinases in mitotic control. Trends Cell Biol 2003; 13: 221–8. [DOI] [PubMed] [Google Scholar]
- 45. O’Regan L, Blot J, Fry AM. Mitotic regulation by NIMA‐related kinases. Cell Div 2007; 2: 25. [DOI] [PMC free article] [PubMed] [Google Scholar]
- 46. Bahmanyar S, Kaplan DD, Deluca JG et al. Beta‐Catenin is a Nek2 substrate involved in centrosome separation. Genes Dev 2008; 22(1): 91–105. [DOI] [PMC free article] [PubMed] [Google Scholar]
- 47. Hayward DG, Fry AM. Nek2 kinase in chromosome instability and cancer. Cancer Lett 2006; 237: 155–66. [DOI] [PubMed] [Google Scholar]
- 48. Loo LW, Grove DI, Williams EM et al. Array comparative genomic hybridization analysis of genomic alterations in breast cancer subtypes. Cancer Res 2004; 64: 8541–9. [DOI] [PubMed] [Google Scholar]
- 49. Ren B, Cam H, Takahashi Y et al. E2F integrates cell cycle progression with DNA repair, replication, and G(2)/M checkpoints. Genes Dev 2002; 16: 245–56. [DOI] [PMC free article] [PubMed] [Google Scholar]
- 50. Fry AM, Schultz SJ, Bartek J, Nigg EA. Substrate specificity and cell cycle regulation of the Nek2 protein kinase, a potential human homolog of the mitotic regulator NIMA of Aspergillus nidulans. J Biol Chem 1995; 270: 12899–905. [DOI] [PubMed] [Google Scholar]
- 51. Weiss MM, Kuipers EJ, Postma C et al. Genomic alterations in primary gastric adenocarcinomas correlate with clinicopathological characteristics and survival. Cell Oncol 2004; 26: 307–17. [DOI] [PMC free article] [PubMed] [Google Scholar]
- 52. Hayward DG, Clarke RB, Faragher AJ, Pillai MR, Hagan IM, Fry AM. The centrosomal kinase Nek2 displays elevated levels of protein expression in human breast cancer. Cancer Res 2004; 64: 7370–6. [DOI] [PubMed] [Google Scholar]
- 53. Hames RS, Wattam SL, Yamano H, Bacchieri R, Fry AM. APC/C‐mediated destruction of the centrosomal kinase Nek2A occurs in early mitosis and depends upon a cyclin A‐type D‐box. EMBO J 2001; 20: 7117–27. [DOI] [PMC free article] [PubMed] [Google Scholar]
- 54. De Vos S, Hofmann WK, Grogan TM et al. Gene expression profile of serial samples of transformed B‐cell lymphomas. Lab Invest 2003; 83: 271–85. [DOI] [PubMed] [Google Scholar]
- 55. Oberthuer A, Berthold F, Warnat P et al. Customized oligonucleotide microarray gene expression‐based classification of neuroblastoma patients outperforms current clinical risk stratification. J Clin Oncol 2006; 24: 5070–8. [DOI] [PubMed] [Google Scholar]
Associated Data
This section collects any data citations, data availability statements, or supplementary materials included in this article.
Supplementary Materials
Fig. S1. Candidate gene expression in neuroblastoma tumor tissue and normal human tissue controls. Gene expression profiling data from 43 patients and normal tissue controls (on the top horizontal axis of the figure, patients are listed according to viability; normal tissues are: ovary, prostate, skeletal muscle, spleen, stomach, testes, uterus, cerebellum, cerebrum, adrenal, heart, liver and lung) were assembled from the Oncogenomics Website (http://pob.abcc.ncifcrf.gov/cgi‐bin/JK) as detailed in Methods. Relative gene expression is presented as a heat‐map and hierarchically clustered (left vertical axis), allowing for the identification of a small number of transcripts that are also expressed in normal tissues (bottom right shows the clustered heat‐map region for these normal tissues samples).
Fig. S2. Correlation of MYCN and NEK2 expression. Using the National Cancer Institute, NIH, USA (NCI) Neuroblastoma cDNA mRNA Expression Database (hosted as described in Table S1), gene expression in normal tissue (A) and stage 4 MYCN‐amplified neuroblastoma samples (B) for NEK2 and MYCN was analyzed using the Pearson correlation method. Although trends were seen for other datasets (stage 4 MYCN non‐amplified, r = 0.277, P = 0.063 and stage 1 non‐amplified, r = 0.36, P = 0.0295), only MYCN amplified stage 4 proved statistically significant.
Table S1. Patient data. Serum provided by the Children’s Oncology Group (COG) was analyzed for specific patient characteristics. Serum was collected according to original protocol and distributed according to the quality of the submitted sample, and thus not always complete for these specimens. MYCN amplification status, ploidy, INSS stage (International Neuroblastoma Staging System), Shimada histology, and age at diagnosis are provided, as available, for each sample courtesy of Dr. Wendy London, Lead Statistician for Neuroblastoma, Children’s Oncology Group.
Supporting info item
Supporting info item
Supporting info item