Abstract
To compare with our previous findings on relative-duration discrimination, we studied prefrontal cortex activity as monkeys performed a relative-distance discrimination task. We wanted to know whether the same parts of the prefrontal cortex compare durations and distances and, if so, whether they use similar mechanisms. Two stimuli appeared sequentially on a video screen, one above a fixed reference point, the other below it by a different distance. After a delay period, the same two stimuli reappeared (as choice stimuli), and the monkeys' task was to choose the one that had appeared farther from the reference point during its initial presentation. We recorded from neurons in the dorsolateral prefrontal cortex (area 46) and the caudal prefrontal cortex (area 8). Although some prefrontal neurons encoded the absolute distance of a stimulus from the reference point, many more encoded relative distance. Categorical representations (“farther”) predominated over parametric ones (“how much farther”). Relative-distance coding was most often abstract, coding the farther or closer stimulus to the same degree, independent of its position on the screen. During the delay period before the choice stimuli appeared, feature-based coding supplanted order-based coding, and position-based coding—always rare—decreased to chance levels. The present results closely resembled those for a duration-discrimination task in the same cortical areas. We conclude, therefore, that these areas contribute to decisions based on both spatial and temporal information.
Introduction
Psychophysical data from humans and monkeys show that time and space have such a close relationship that they interfere with each other perceptually (Casasanto and Boroditsky, 2008; Merritt et al., 2010). The use of spatial metaphors for durations epitomizes this relationship, and a frontoparietal network has been proposed as a common substrate for these two perceptual domains, among others (Walsh, 2003). Accordingly, we wanted to know whether the prefrontal (PF) areas that we showed previously to be involved in temporal perception (Genovesio et al., 2009) also play a role in spatial perception. To this end, the present task was designed to match our relative-duration task (Genovesio et al., 2009) to the extent possible, including the use of the same two stimuli, recording from the same two monkeys and recording from the same two areas. Like that duration task, the two stimuli appeared sequentially and the monkeys later chose the one that exceeded the other along a particular perceptual dimension. In the relative-duration task, that dimension was stimulus duration. In the present task, the relevant dimension was distance from a fixed reference point.
One of the areas showing relative-duration coding in our previous study (Genovesio et al., 2009), the dorsolateral prefrontal cortex (PFdl) (area 46) seems a likely candidate for processing relative-distance information. Studies of position coding have dominated PFdl research (Fuster, 1973; Funahashi et al., 1989, 1993; Goldman-Rakic, 1994, 1997, 2000; Courtney et al., 1996; Levy and Goldman-Rakic, 2000; Constantinidis et al., 2001; Druzgal and D'Esposito, 2003; Genovesio et al., 2006a; Tsujimoto et al., 2008), and it could be a step toward relative-distance coding. Although a few parietal cortex studies have addressed the representation of egocentric distance (Genovesio and Ferraina, 2004; Bhattacharyya et al., 2009; Ferraina et al., 2009a,b), none have done so for the prefrontal cortex, and no neurophysiological study has investigated distance comparisons. Furthermore, recent work has shown that PFdl has additional functions, including spatial attention (Lebedev et al., 2004), nonspatial memory (Rao et al., 1997; Rainer et al., 1998), nonspatial rule (Buckley et al., 2009) and strategy (Genovesio et al., 2005) selection, shape coding (Averbeck et al., 2003), and various aspects of sequence processing (Averbeck et al., 2003; Hasegawa et al., 2004; Ninokura et al., 2004; Shima et al., 2007). So distance coding could be another function of PFdl. Spatial information processing also occurs in the other area showing relative-duration effect in our previous study, the caudal prefrontal cortex–prearcuate (PA) area 8 (Barone and Joseph, 1989).
In this report, we describe the activity of neurons in both PFdl and PA during the performance of a distance-discrimination task. To the extent possible, we attempt to match the description and analysis used for the duration-discrimination task (Genovesio et al., 2009).
Materials and Methods
Two adult, male rhesus monkeys (Macaca mulatta) were used in this study. Monkey 1 weighed 8.5 kg, and monkey 2 weighed 8.0 kg. All procedures followed the National Institutes of Health Guide for the Care and Use of Laboratory Animals (1996) and were approved by the National Institute of Mental Health Animal Care and Use Committee.
The monkeys sat in a primate chair, 29 cm from a video screen with their heads fixed. Three 3 × 2 cm infrared switches were located within reach, under the video screen. The switches, also called keys, were arranged left to right and separated by 7 cm, and both monkeys used their left hands to contact the keys. A fixed reference point appeared in the center of the screen (0.6° white circle), and the stimuli were a blue 3° (diameter) circle and a red 3° × 3° square.
Behavioral task.
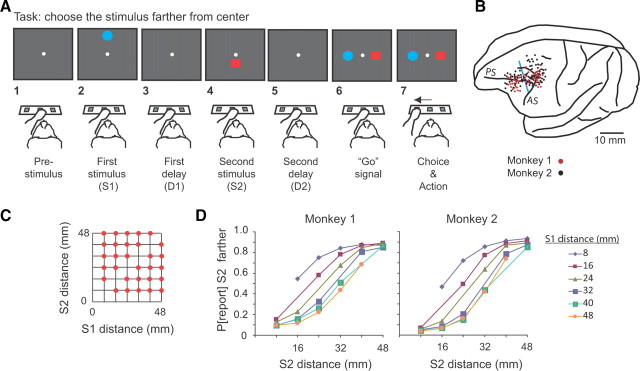
A trial began when the monkey touched the central key with its left hand, which led to the reference point appearing at the center of the screen (Fig. 1A1). After a prestimulus period of either 400 or 800 ms, the two visual stimuli appeared for 1.0 s each, in succession. One stimulus appeared directly above the reference point, and the other appeared directly below it (Fig. 1A2,A4), separated by a delay (Fig. 1A3). (We call the former the up or upward stimulus, and the latter is termed the down or downward stimulus.) Both the order of the two stimuli and their location above or below the reference were pseudorandomly determined.
Figure 1.
Task, recording locations, distances used, and discrimination behavior. A, Sequence of task events. Each gray rectangle represents the video screen. B, Penetration sites. Composite from both monkeys, relative to sulcal landmarks. Vertical blue line, Division between periarcuate (right) and dorsolateral prefrontal (left) areas. AS, Arcuate sulcus; PS, principal sulcus. C, Stimulus locations. D, Psychometric curves showing the probability of reporting (P[report]) that S2 was farther as a function of S2 distance.
The relevant stimulus dimension was the distance of each stimulus from the reference point. In screen distance, the stimuli ranged from 8 to 48 mm from the reference point, in steps of 8 mm (Fig. 1C). These screen distances corresponded to 1.6°-9.4° of visual angle. This set of distances had the advantage of graded differences between the two stimuli, which enabled us to examine distance coding parametrically.
After each 1.0 s stimulus presentation, a delay period ensued. The first stimulus (Fig. 1A2) was called S1, and it was followed by a randomly selected 400 or 800 ms delay period called D1 (Fig. 1A3). (In a subset of sessions, we added a D1 of 1200 ms and in another subset we used D1 periods of a fixed 1200 ms duration.) After the D1 period ended, the second stimulus, called S2, appeared (Fig. 1A4), followed by a second delay period called D2, which lasted 0, 400, or 800 ms (pseudorandomly selected) (Fig. 1A5). Note that, on one-third of the trials, there was no D2 delay. At the end of the D2 period, the red square and blue circle reappeared, one 7.8° directly to the left of the reference point and the other 7.8° to the right (Fig. 1A6), pseudorandomly determined. This event served as the “go” signal, and, to receive a reward, the monkey had a maximum of 6 s to touch the switch below the stimulus that had appeared farthest from the reference point in its earlier appearance on that trial (Fig. 1A7). We called this the choice and action (C&A) period. The time limitation of 6 s had little influence on the monkeys' performance because both monkeys responded in <500 ms, as shown in supplemental Figure 1 (available at www.jneurosci.org as supplemental material).
An important feature of the task design was that the monkeys could not plan any motor response until after the go signal (Fig. 1A6,A7), except perhaps by default. Because each choice stimulus appeared with equal probability to the left and right of the reference point, the monkey had to wait until these stimuli reappeared to plan and execute the movement to its choice. In the terminology of Schall et al. (2002), the tasks allowed a clear temporal separation between a “decision” (about which stimulus had appeared farther from the reference point) and the later neural processing that involved a “choice” between the two stimuli (red square vs blue circle) and the “action” required to make the report (moving to the left or the right switch).
Acoustic feedback signaled each error, and both correct and incorrect responses were followed by an intertrial interval of 300 ms. Correct responses were rewarded (0.1 ml of fluid).
Surgery.
Access ports were implanted over the exposed dura mater of the left frontal lobe, along with head restraint devices, using aseptic techniques and isoflurane anesthesia (1–3%, to effect). Monkey 1 had two 18-mm-diameter ports, whereas monkey 2 received one 27 × 36 mm port.
Data collection.
An infrared oculometer (Arrington Recording) recorded eye position. Single-cell potentials were isolated with quartz-insulated platinum–iridium electrodes (0.5–1.5 MΩ at 1 kHz) positioned by a 16-electrode drive assembly (Thomas Recording). Electrodes were spaced according to a concentric recording head with 518 μm spacing. Spikes were discriminated online using Multichannel Acquisition Processor (Plexon) and confirmed with Off Line Sorter (Plexon) based on principal component analysis, minimal interspike intervals, and clearly differentiated waveforms inspected individually for every isolated neuron.
Task periods.
After an examination of perievent time histograms of neuronal activity, we decided that the most representative measures of activity rates required dividing the stimulus periods into two parts. Accordingly, we measured activity from 80–400 ms after stimulus onset and separately from 400–1000 ms after stimulus onset. The first of these epochs was called the “early stimulus period,” and the second was called the “late stimulus period.” For activity rates during the D1 and D2 delay periods, we took the interval from 80–400 ms after stimulus offset. Finally, during the C&A period, we measured activity from the go signal until the monkey made contact with the left or right switch.
Neuronal analysis.
We used SPSS (SPSS Inc.) and Matlab (MathWorks) for the analysis. For the early S1, late S1, and D1 periods, we used a two-way ANOVA (α = 0.05) with S1 distance and stimulus features (red square vs blue circle) as factors. For cells with significant distance effects, we used ANOVA with orthogonal polynomial contrasts to describe the relationship between average activity and S1 distance. The quadratic polynomial tested whether quadratic relationships exceeded linear ones; the cubic polynomial tested whether cubic fits exceeded quadratic ones.
For the early S2, late S2, D2, and C&A periods, we used a three-way ANOVA (α = 0.05) to screen for relative-distance effects. The three factors were relative distance based on stimulus order (S1 or S2 farther), stimulus features (red or blue stimulus farther), and position (up or down stimulus farther).
To compare distance coding for stimulus positions up and down from the reference point, we calculated two indices that measured the relative-distance effects. First, we calculated an index for order-based coding: (AS2 farther − AS1 farther)/(AS2 farther + AS1 farther), where AS2 is the activity rate during trials when S2 was farther, and AS1 is the activity rate when S1 was farther. Second, we calculated an analogous index for feature-based coding: (AB farther − AR farther)/(AB farther + AR farther), where B represents the blue circle and R represents the red square. Pearson's correlations compared these indices when the preferred stimulus–distance combination was up versus down from the reference.
A separate analysis, based on two stepwise regressions, examined the encoding in more detail than possible with ANOVA. We examined the variance accounted for by four possible factors: (1 and 2) the absolute distance of each stimulus from the reference point, (3) which stimulus had been farther from the reference point on its initial presentation, and (4) the difference in distance from reference for the two stimuli. The first four-factor multiple regression was based on the order of stimulus presentation, with the distances of S1 and S2 regressed along with their relative distance (S2 − S1; S2 farther or closer):
 |
where Z is mean firing rate during the task period analyzed. A separate four-factor stepwise regression was based on stimulus features, with the distance of the red and blue stimuli substituted for S1 and S2, respectively, in Equation 1.
After testing each factor, the predictor variable that had the highest correlation with the average neural activity then entered into the model, provided that it met the p < 0.05 level. Having removed the variance of the first predictor, the remaining variables were then tested and entered into the equation if they met the same level of significance. Whenever a new variable was included in the model, the previously entered variables were retested and removed from the model if they did not meet the p = 0.1 level. The advantage of this stepwise version of multiple regression analysis is that it mitigates false-positive correlates attributable to covariance among the tested factors. We then performed a Monte Carlo analysis to test whether the number of neurons selective for each factor exceeded that expected by chance. After shuffling the average neuronal activity corresponding to different pairs of stimulus distances, the selectivity of a neuron for each factor was reanalyzed by stepwise regressions. We repeated this procedure 1000 times for each neuron and obtained a chance-level distribution, against which the observations were tested. Finally, a 12-factor stepwise regression was performed that included the four factors in Equation 1, the four factors substituting the red and blue stimuli for S1 and S2 in Equation 1, and the four factors substituting the up and down stimuli for S1 and S2 in Equation 1.
Distance coding was also evaluated with the receiver operating characteristic (ROC) analysis. ROC values were calculated in 200 ms bins beginning from 100 ms before S2 offset until 900 ms after S2 offset in 20 ms steps.
Histological analysis.
Shortly before the end of recording, we passed 15 μA of anodal current through selected electrodes for 10 s. Ten days later, the monkey was deeply anesthetized and perfused through the heart with formol-saline (10% Formalin in 0.9% saline). We plotted recording sites on Nissl-stained sections, cut in the coronal plane, by reference to the recovered electrolytic lesions, marking pins inserted at the time of the perfusion, and structural magnetic resonance images taken at various stage after recordings began. Although the entry points for PA (periarcuate) recordings (Fig. 1B) make it appear that many cells were located in the postarcuate cortex, track reconstructions based on the angle and depth of penetrations showed that they were predominantly from prearcuate cortex, mainly area 8. Figure 1B shows the dividing line between the PFdl and PA recording sites. The cells rostral to that line were located mostly in area 46, with a few cells in the adjacent areas. Given the close similarity of the PA and PFdl populations in all of the properties studied, we did not undertake any finer examination of regional variance in those properties.
Results
Behavior
Figure 1D shows that, for each S1 distance, the probability of the monkey reporting that the second stimulus was farther increased with S2 distance from the reference point. Overall, both monkeys performed the task accurately, with better scores and faster response latencies for easier discriminations (supplemental Fig. 1, available at www.jneurosci.org as supplemental material). Mean scores were 78 and 80% correct for monkeys 1 and 2, respectively.
As a control procedure, in separate blocks of trials, we presented the two stimuli in the same half of the screen, either the top half or the bottom half. This differed from the standard task in which one stimulus appeared above the central reference point and the other below it. In the first block of trials in which the monkeys experienced this control task, they scored 85 and 70% correct, respectively. This immediate transfer indicates that the monkeys followed a general rule of reporting the stimulus that had appeared farthest from reference point, instead of memorizing all the combinations of distances for the red and blue stimuli.
Eye position was not placed under experimental control for this task because of the strong tendency for the monkeys to fixate the stimuli when they appeared. However, the central reference point was the experimentally controlled fixation point in the companion task, reported by Genovesio et al. (2009). Probably because of the extensive training on this task, both monkeys tended to fixate the fixed reference point during the last part of the prestimulus period and at the time that S1 appeared. After S1 onset, the monkeys often made a saccadic eye movement to fixate S1, after which they made various saccades before returning fixation to the reference point near the end of the D1 period. Because of this behavior, the monkeys were usually gazing at the reference point when S2 appeared. After S2 onset, the monkeys again made a saccade to fixate the stimulus, followed by various saccades that ended with them returning to the reference point. When the choice stimuli appeared, the monkeys were usually fixating near the reference point again, and they made a saccade to one or both stimuli before making the reaching movement on that trial. Somewhat surprisingly, it was not uncommon for the monkeys to saccade in one direction and maintain fixation on one of the choice stimuli while shortly thereafter reaching to the switch in the other direction.
Neuronal database
The neuronal sample comprised 1671 neurons that were recorded for at least 40 trials and always in strict isolation from other unit potentials. Of this population, 492 cells came from monkey 1, 1179 cells came from monkey 2, 1287 neurons from PA, and 384 from PFdl.
We first describe activity during the S1 and D1 periods and then focus our analysis on the period after S2 onset, which includes the S2, D2, and C&A periods.
Activity during the S1 and D1 periods
The main focus of this investigation involved the neural coding of relative distance, which could not begin until the presentation of S2. For completeness, however, we describe some neuronal properties during the S1 and D1 periods. During the D1 period of each trial, the monkey needed to remember the distance of S1 from the reference point to perform the task correctly.
A small population of frontal cortex neurons encoded the distance of S1 or its location from the reference point during both the S1 and D1 periods. Table 1 gives the breakdown by cortical area and task period, and supplemental Tables 1 and 2 (available at www.jneurosci.org as supplemental material) present a more extensive analysis. The polynomial contrast method showed that cells in both areas encoded S1 distance by linear, quadratic, and cubic functions (supplemental Table 1, available at www.jneurosci.org as supplemental material). Figure 2 shows an example of distance coding during the S1 period, with both red and blue stimuli combined. The tuning curve of the cell is shown separately for upward and downward stimuli and for all trials combined. These curves show that the cell preferred stimuli at the larger distances both above and below the reference point. Tuning for large distances, whether the stimulus was up or down from the reference point, seems to rule out interpretations in terms of traditional visual receptive fields. We did not, however, have experimental control over the monkey's eye position at all times during the S1 and D1 periods, so an effect of eye position, eye movements, or an interaction between eye position and the visual stimuli cannot be ruled out.
Table 1.
ANOVA and polynomial contrasts for encoding of distance from the reference point during the S1 and D1 periods
| Task period | Cortical region | n | S1 distance effect | Lineara | Quadratica | Cubica |
|---|---|---|---|---|---|---|
| Early S1 | Periarcuate | 1287 | 99 (7.7%) | 38 (38.4%) | 21 (21.2%) | 15 (15.1%) |
| Prefrontal | 384 | 27 (7.0%) | 6 (22.2%) | 8 (29.6%) | 8 (29.6%) | |
| Late S1 | Periarcuate | 1287 | 105 (8.1%) | 32 (30.5%) | 31 (29.5%) | 18 (17.1%) |
| Prefrontal | 384 | 39 (10.1%) | 11 (28.2%) | 13 (33.3%) | 6 (15.4%) | |
| D1 | Periarcuate | 1287 | 111 (8.6%) | 36 (32.4%) | 26 (23.4%) | 23 (20.7%) |
| Prefrontal | 384 | 33 (8.6%) | 12 (36.4%) | 6 (18.2%) | 6 (18.2%) |
aNumbers (percentage) of cells.
Figure 2.
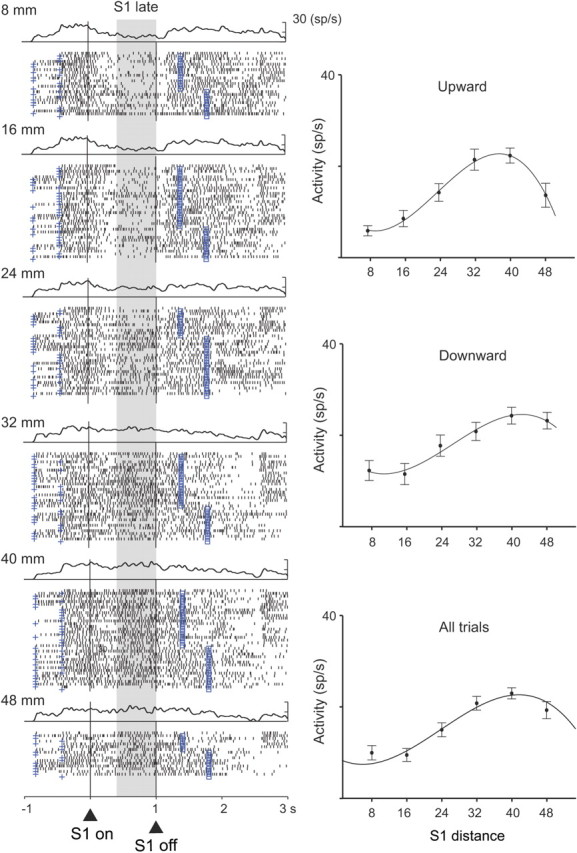
Distance tuning during the S1 and D1 periods. PA neuron with a cubic relationship between the S1 distance and neural activity during the late S1 period. Each dot in the raster plot indicates when the cell discharged relative to S1 onset (triangle and vertical line); spike-density averages are above each display. The cross mark to the left of the alignment line on each raster line shows the onset of the prestimulus period (400–800 ms); the square mark to the right of the alignment line corresponds to the end of D1, which was either 400 or 800 ms after S1 offset. Trials were divided according to S1 distance (8–48 mm). Plots shown to the right show the mean discharge rate for each cell as a function of S1 distance, with regression curves shown for all trials (bottom) and separately for S1 up (top) and down (middle) from the reference point. Error bars indicate SEM. Background shading indicates the analyzed period. sp, Spikes.
Activity during the S2, D2, and C&A periods: ANOVA
The remainder of the analysis deals with the time from the onset of the second stimulus (S2), when the monkeys could decide which stimulus had appeared farther from the reference and prepare for their forthcoming choice and action. By convention, we will refer to relative distances farther from the reference point. However, when the blue stimulus was farther, the red one was always closer and vice versa. Likewise, when the first stimulus (S1) was farther, the second stimulus (S2) was closer, and when the upward (up) stimulus was farther, the downward (down) one was closer.
For each task period, a three-way ANOVA was performed with factors order (whether S1 or S2 had appeared farther from the reference point), features (red or blue farther), and position (up or down farther). All three factors were encoded by cells in both PA and PFdl (Table 2), and these properties varied as a function of task period.
Table 2.
Results of three-way ANOVA for relative-distance coding based on order, features, or position
| Task period | Cortical region | n | Order (S1 or S2 farther) | Feature (red or blue farther) | Position (up or down farther) |
|---|---|---|---|---|---|
| Early S2 | Prefrontal | 384 | 108 (28.1%) | 51 (13.3%) | 55 (14.3%) |
| Periarcuate | 1287 | 406 (31.5%) | 249 (19.3%) | 209 (16.2%) | |
| Late S2 | Prefrontal | 384 | 123 (32.0%) | 110 (28.6%) | 54 (14.1%) |
| Periarcuate | 1287 | 476 (37.0%) | 386 (30.0%) | 194 (15.1%) | |
| D2 | Prefrontal | 384 | 67 (17.4%) | 78 (20.3%) | 36 (9.4%) |
| Periarcuate | 1287 | 266 (20.7%) | 301 (23.4%) | 134 (10.4%) | |
| C&A | Prefrontal | 384 | 28 (7.3%) | 86 (22.4%) | 28 (7.3%) |
| Periarcuate | 1287 | 136 (10.6%) | 300 (23.3%) | 84 (6.5%) |
For D2 and the C&A periods, D2 delays of 0 ms are excluded. p < 0.05. Numbers (percentages) of cells.
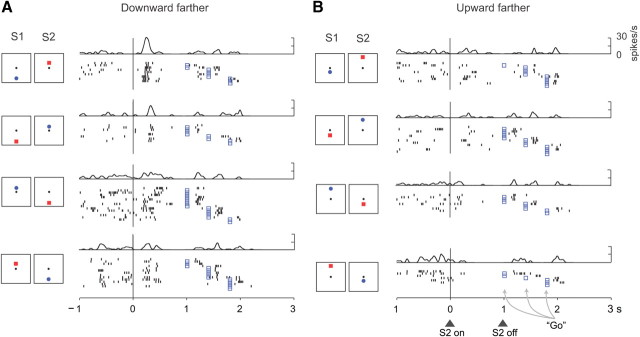
Figure 3 illustrates the activity of a cell that encoded relative distance based on the features of the stimulus. This neuron had a preference for trials when the blue circle had appeared farther from the reference point, and that preference persisted through the S2, D2, and C&A periods (p < 0.001). It did so regardless of whether the blue stimulus had appeared first and above center (Fig. 3A, top row), second and below center (Fig. 3A, second row), first and below center (Fig. 3B, first row), or second and above center (Fig. 3B, last row). Like this cell, 13–30% of the cells encoded relative distance based on stimulus features, with the percentage varying by task period (Table 2). [Supplemental Table 3 presents a more detailed analysis that includes screen position (available at www.jneurosci.org as supplemental material).] These cells could represent the choice (red or blue) made by the monkey on the basis of the decision about which stimulus had appeared farther from the reference.
Figure 3.
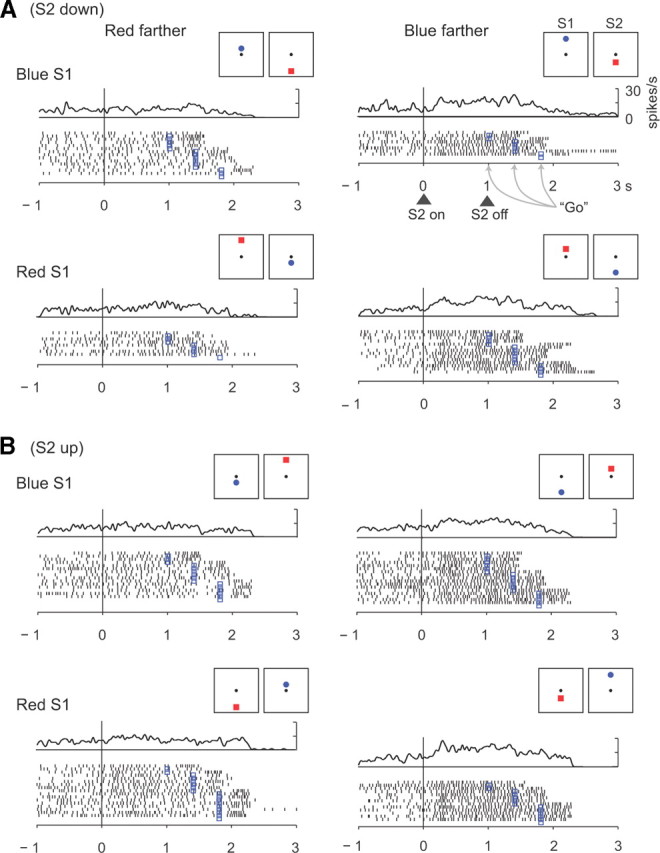
Relative-distance coding based on stimulus features. This PA neuron encoded whether the red or blue stimulus had been farther from the reference point, with a preference for blue-farther trials, independent of the position of the stimuli (up or down). A, Trials with S2 down from reference. B, Trials with S2 up from reference.
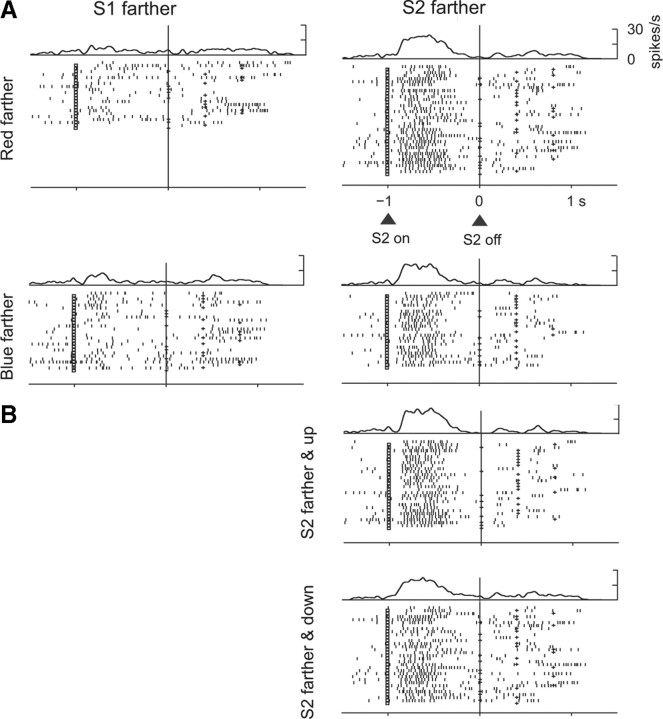
Figure 4 shows an example of a cell encoding relative distance in terms of stimulus order. This neuron had a preference for trials when S2 appeared farther from the reference point (p < 0.001), independent of whether it was red or blue (Fig. 4A) or up or down (Fig. 4B). The relative-distance effect based on order declined abruptly near the end of S2 in this neuron. Leaving aside the C&A period, 17–37% of the cells encoded whether S1 or S2 had appeared farther from reference (Table 2). For the late S2 period, ∼30–40% of the neuronal sample had this property (599 of 1671 tested cells, two-way ANOVA, 37% in PA and 32% in PFdl).
Figure 4.
Abstract relative-distance coding based on stimulus order. This PA neuron encoded whether S1 or S2 had been farther from the reference point, with a preference for S2 farther. A, Trials with stimuli up and down from reference combined. B, Trials with S2 farther divided by position up and down from the reference point. Note that there is no effect of the position of S2 on the neural activity, which indicates abstract encoding of the relative distance based on order. Format as in Figure 3.
Figure 5 shows a neuron encoding relative distance based on stimulus position. This neuron has a preference for trials when the downward stimulus appeared farther from center, regardless of whether it was a blue S1 (top row), a red S1 (second row), a red S2 (third row), or a blue S2 (bottom row). As shown in Table 2, cells with position-based relative-distance effects were the least common of the three types.
Figure 5.
Relative-distance coding based on stimulus position. This PA neuron encoded whether the up or down stimulus had been farther from the reference point in the early S2 period, with a preference for the downward stimulus being farther. A, Trials when the downward stimulus was farther from the reference. B, Trials when the upward stimulus was farther. Format as in Figure 3.
Figure 6 presents an additional analysis of the three types of relative-distance coding. The key point illustrated by this figure is the close correlation in the distance-coding index regardless of whether the preferred stimulus of a cell was up or down from the reference. This finding shows that distance coding was abstract in that it usually did not vary much according to the positions of the stimuli in space.
Figure 6.
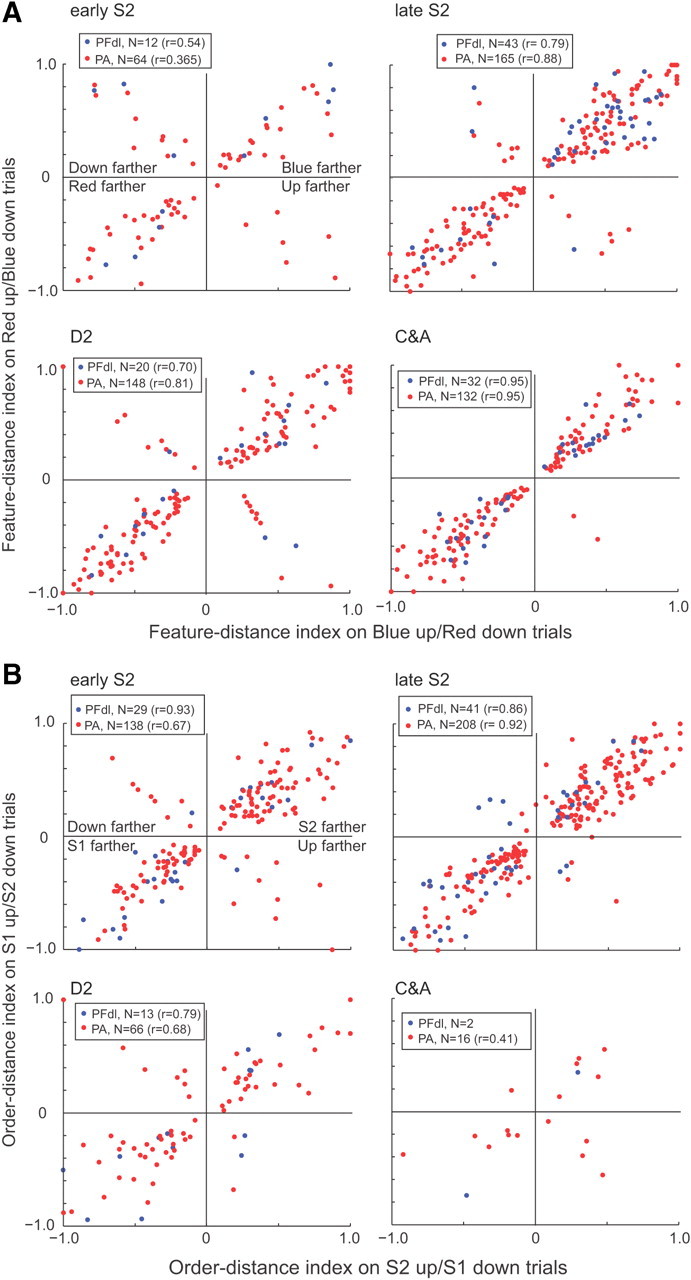
Abstract relative-distance tuning. A, A feature-distance index varied from −1.0, which indicated complete selectivity for trials in which the red stimulus appeared farther from the reference, to +1.0, which indicated complete selectivity for trials in which the blue stimulus appeared farther, with 0.0 indicating no selectivity. For most cells, the selectivity for blue-farther trials changed little when the blue circle had appeared above the reference (abscissa) or below the reference (ordinate) (461 of 509, 90.1%, in PA; 98 of 107, 91.6%, in PFdl). A minority of cells showed a preference for the downward stimulus (top left quadrant) or upward (bottom right quadrant) being farther (48 of 509, 9.4%, in PA; 9 of 107, 8.4%, in PFdl). B, As in A but for the order-distance index. Order-distance coding changed little based on stimulus position (391 of 428, 91.3% in PA; 75 of 85, 88.2%, in PFdl). A minority of cells coded whether the upward stimulus (bottom right quadrant) or downward stimulus (top left quadrant) had been farther from the reference (37 of 428, 8.6%, in PA; 10 of 85, 11.8%, in PFdl). In parentheses, the correlation r between indexes for up and down trials.
Figure 6, however, is necessarily limited to cells that had significant relative-distance effects for both positions (up and down). Such cells composed approximately half of the larger population of cells showing relative-distance effects. The others showed a significant effect only when the preferred stimulus was either upward or downward from the reference point. For the entire population of neurons that encoded relative-distance based on stimulus features, approximately half did so regardless of stimulus position during the late S2, D2, and C&A periods. Of 847 neurons in PA that encoded relative distance when blue was up, 52% also did so when blue was down (supplemental Table 3, available at www.jneurosci.org as supplemental material). In PFdl, 42% of the tested neurons had this property. Similar results were obtained for neurons with relative-distance effects based on order, which could be tested only in the early or late S2 periods. Of 751 neurons in PA that encoded relative distance when S2 was up, 46% also did so when S2 was down (supplemental Table 3, available at www.jneurosci.org as supplemental material). In PFdl, 38% of the neurons did so. Figure 7 illustrates both kinds of relative-distance coding. During the C&A period, the cell preferred trials when the blue circle was farther from the reference point, regardless of whether the blue stimulus was up or down from the reference point. During the S2 period, however, relative-distance coding occurred mainly during trials in which S2 was up from the reference point (Fig. 7B).
Figure 7.
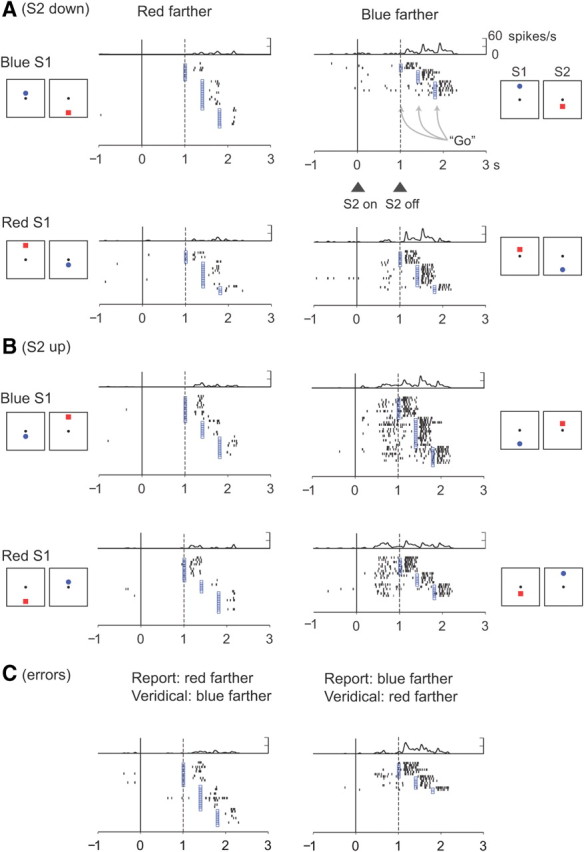
Neuron in PA that encoded whether the red or blue stimulus had been farther from the reference. During the S2 period, this cell was selective for blue-farther trials only when S2 appeared upward from the reference point (B) but not downward (A). During the C&A period, the cell preferred the blue-farther trials regardless of whether the blue stimulus or S2 appeared up (B) and down (A) from the reference. C, On error trials, the cell preferred trials with closer blue stimuli, which accorded with the monkey's erroneous choice of the blue stimulus, although the red stimulus had been farther from the reference.
Figure 6 also allowed us to examine the relative frequency of feature-based, order-based, and position-based coding. This analysis showed that the vast majority of cells showed feature-based coding as opposed to position-based coding (Fig. 6A): 73–99% in PA and 75–100% in PFdl, varying by task period (supplemental Table 4, available at www.jneurosci.org as supplemental material). Likewise, order-distance predominated over position-distance coding (Fig. 6B): 69–98% for PA and 85–100% for PFdl, also varying by task period (supplemental Table 4, available at www.jneurosci.org as supplemental material). Thus, for cells that could be tested in this way, feature- and order-based relative-distance coding was much more prevalent than position-based coding. We return to this topic below (see Activity during the S2, D2, and C&A periods: multiple-regression analysis).
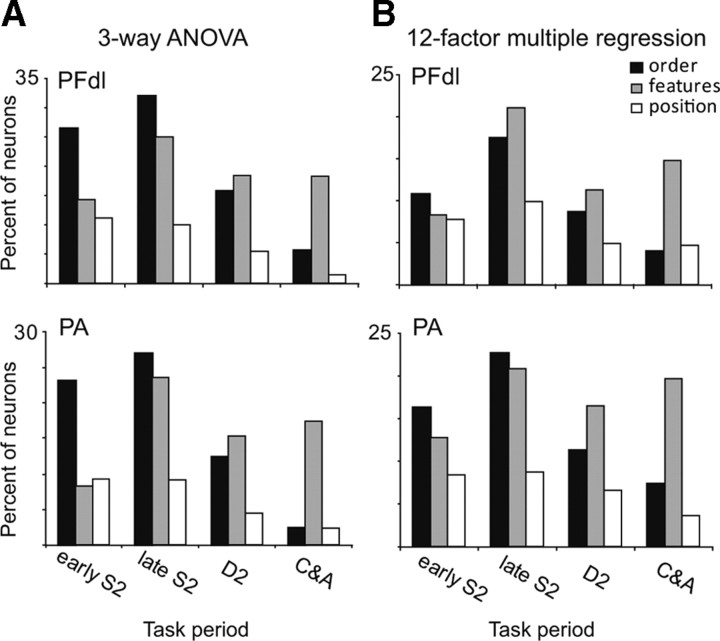
In both PA and PFdl, the proportion of cells encoding these various forms of relative-distance coding changed as the time for a choice approached. Figure 8A shows this time-trend based on ANOVA (Table 2). The proportion of cells encoding relative-distance based on order or position tends to decline as the trial progresses from the S2 period toward the C&A period. For order-based coding, the difference between the early S2 period and the C&A period is significant (χ2 = 49.17, p < 0.001 for PFdl; χ2 = 99.03, p < 0.001 for PA), as it is for position-based coding (χ2 = 12.5, p < 0.05 for PFdl; χ2 = 68.9, p < 0.001 for PA). This decline is not seen in cells encoding relative-distance based on stimulus features, which maintain their proportion after an initial increase during the S2 period.
Figure 8.
Time course of order-distance and feature-distance coding for task periods after S2 onset. A, Results of three-way ANOVA (see Table 2), after subtracting 5% for false-positive results expected by chance, main effects only. B, Results of 12-factor multiple-regression analysis for relative-distance coding.
Activity during the S2, D2, and C&A periods: multiple-regression analysis
ANOVA shows that there is an effect of relative distance on neuronal discharge rates. It does not indicate whether the neurons encode the difference in distances (parametric coding) or whether they encode the farther stimulus independent of the magnitude of the difference (categorical coding) or both. ANOVA also cannot rule out the possibility that the neurons showing significant effects of relative distance actually encode the absolute distance of stimuli from the reference. If, for example, a neuron encodes the fact that S2 appeared farther from the reference than S1 did, this is likely to occur on trials in which S2 is far from the reference in absolute terms, as well.
Accordingly, we performed a stepwise, multiple-regression analysis. This procedure factored out relative distance and the absolute distance of the individual stimuli, and it distinguished categorical from parametric encoding of relative distance. We tested, on a cell-by-cell basis, the predictive value of four factors to evaluate whether they accounted significantly for the observed variance. We performed two separate four-factor analyses, one for order-based distance coding (Fig. 9A) (supplemental Table 5, available at www.jneurosci.org as supplemental material) and the other for feature-based coding (Fig. 9B) (supplemental Table 6, available at www.jneurosci.org as supplemental material), and a 12-factor analysis that included order, feature, and position effects (supplemental Table 7, available at www.jneurosci.org as supplemental material).
Figure 9.
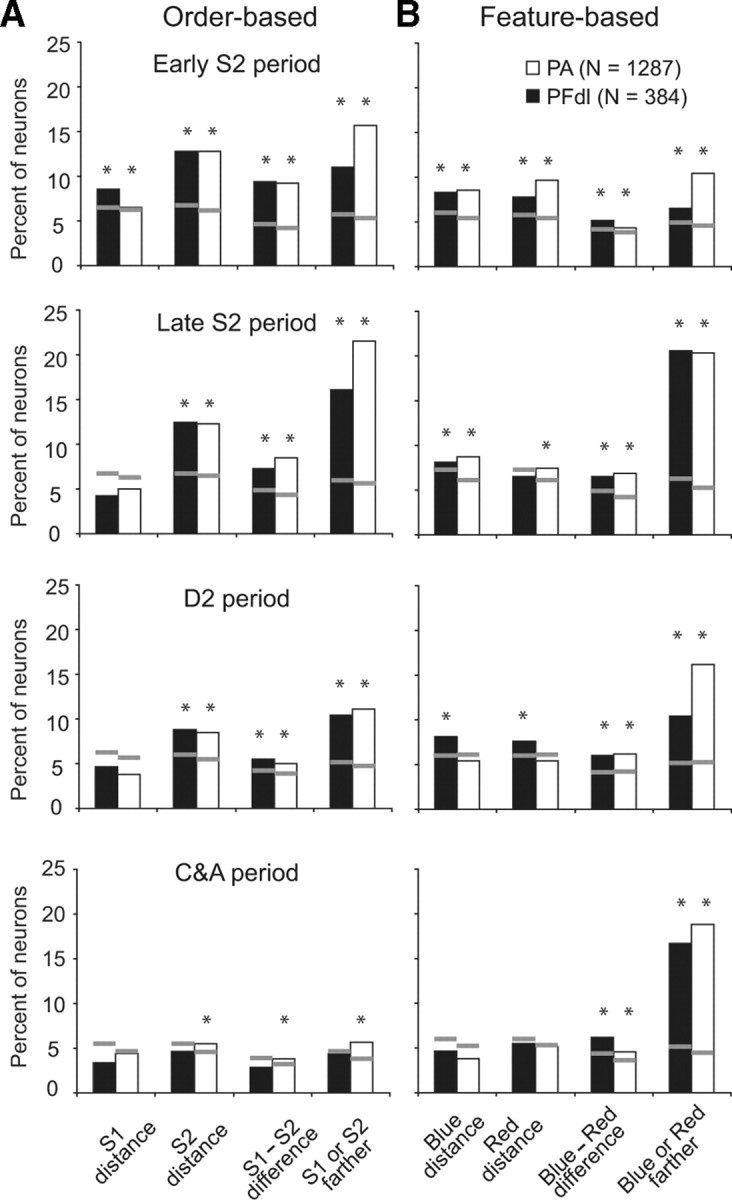
Results of two separate four-factor, stepwise multiple-regression analyses. A, Order-based distance coding. B, Feature-based distance coding. The gray lines indicate chance level (p = 0.05) as calculated with Monte Carlo analysis. The asterisks above each histogram indicate a significant effect for that factor.
The first multiple regression, for order-based distance coding, used four factors: S1 distance from the reference point, S2 distance from the reference point, the S1 − S2 difference between distances, and whether S1 or S2 was farther (in categorical terms). The results showed that the neurons in our sample encoded all four factors (Fig. 9A). For feature-based distance coding, the factors were the distance of the blue circle from the reference point, the distance of the red square from the reference point, the difference between those two distances, and whether the blue or red stimulus was farther in categorical terms. Prefrontal cortex neurons also encoded all four of these factors (Fig. 9B).
To confirm the statistical significance of these results, we tested whether the number of cells selective for each of the factors occurred more frequently than expected by chance. Monte Carlo analysis generated chance levels, indicated by the gray horizontal lines for each bar in Figure 9. This analysis confirmed that order- and feature-based relative-distance coding exceeded chance levels in both PA and PFdl (p < 0.05, asterisks in Fig. 9). The exceptions occurred mainly for encoding S1 distance and for several kinds of coding during the C&A period. During the C&A period, only cells encoding relative distance based on stimulus features were substantially more frequent than expected by chance.
In general, categorical encoding was more prevalent than parametric encoding (Fig. 9). For order-based coding, this difference was significant in both PFdl and PA during the late S2 period (χ2 = 12.9, p < 0.001 for PFdl; χ2 = 72.1, p < 0.001 for PA). These differences also reached statistical significance for feature-based relative-distance coding both in the late S2 period (χ2 = 28.0, p < 0.001 for PFdl; χ2 = 84.5, p < 0.001 for PA) and in the C&A period (χ2 = 18.2, p < 0.001 for PFdl; χ2 = 111.2, p < 0.001 for PA).
To evaluate position-based coding on an equal footing with feature- and order-based coding, we performed a 12-factor multiple regression for stimulus order, feature, and position (three factors) crossed by absolute coding for the two stimuli, parametric coding, and categorical coding (four factors). This analysis showed that, during the C&A period, distance coding based on either order or position became relatively rare (Fig. 8B), in accord with results from a three-way ANOVA (Fig. 8A).
Activity during the S2, D2, and C&A periods: population analysis
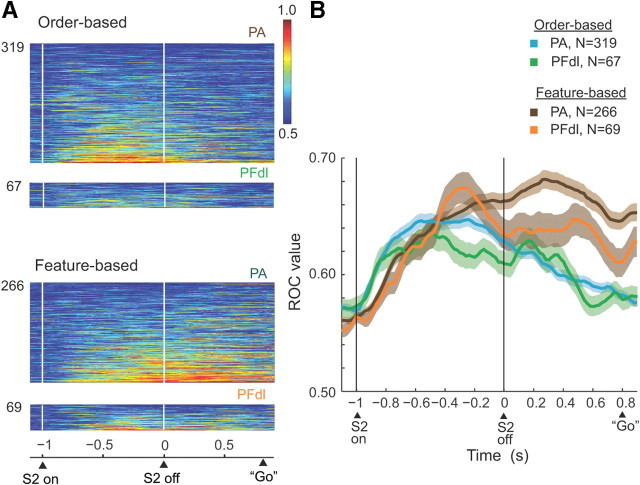
We also quantified the strength of relative-distance coding at the population level and did so in two ways: ROC analysis and population averages. We computed ROC values on a neuron-by-neuron basis, using mean firing rates during the S2 and D2 periods. The ROC values reflect the capacity of an ideal observer to decode some signal based on single-trial activity, and the value is not affected by the mean discharge rate of a cell or its dynamic range. For feature-based coding, we plotted for each neuron the proportion of “blue-farther” trials with activity that exceeded the observed discharge rate against the proportion of “red-farther” trials that did so or vice versa. Thus, the area under the ROC curve is a measure of relative-distance coding. A value of 0.5 shows no selectivity, and a value of 1.0 shows complete selectivity, i.e., the extreme case in which all blue-farther trials had higher activity than any red-farther trial or vice versa. A separate ROC analysis examined order-based coding.
Figure 10 shows the results of the ROC analysis, based on trials with a D2 period of 800 ms. We plotted the ROC values only of the cells that were selective by the stepwise regression analysis (p < 0.01) for relative distance in at least one of three task periods: early S2, late S2, or D2. The average ROC values in Figure 10B show the time course of relative-distance coding. After S2 onset, ROC values increased rapidly for both order and features. Approximately midway through the S2 stimulus, order-based ROC values (green and blue curves) peaked and began to decline, a trend that continued until the go cue initiated the C&A period. In contrast, ROC values for features (brown and orange curves) maintained a high level throughout the D2 period. The individual-cell contributions to this population ROC analysis can be appreciated from Figure 10A. During the D2 period, ROC values were significantly higher for feature-based coding than for order-based coding in both PFdl (Kruskal–Wallis test, p < 0.001) and PA (p < 0.05).
Figure 10.
Results of ROC analysis. Bin of 200 ms, with 20 ms steps. A, ROC plots for neurons with significant relative-distance coding, with the area under the ROC curve color-coded for each cell and ranked according to mean ROC values. B, Time course of changes in mean ROC values. Background shading indicates one SEM. Only trials with an 800 ms D2 period were used.
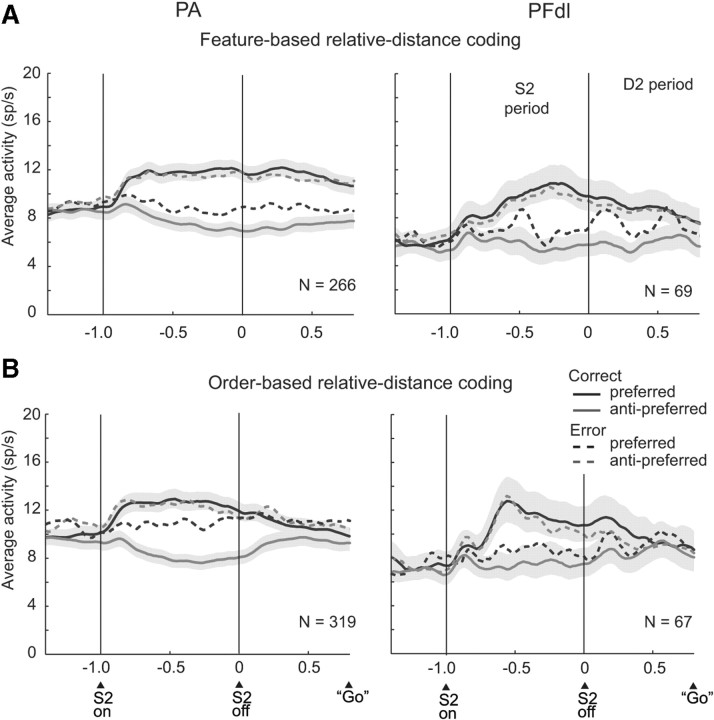
Figure 11 and supplemental Figure 2 (available at www.jneurosci.org as supplemental material) show results based on population averages, which confirmed the ROC analysis. Figure 11A and supplemental Figure 2A (available at www.jneurosci.org as supplemental material) show average activity for the same neurons and trials used for the brown and orange curves in Figure 10B. These neurons encoded whether the red or blue stimulus had appeared farther from the reference or their difference in distance from the reference. The preferred feature-distance conjunction had the higher activity (black curves), with the remaining one defined as anti-preferred (gray curves). For correct trials (solid lines), the cells showed their preference after S2 onset and reached a peak earlier in PA (∼300 ms after S2 offset) than in PFdl (∼600 ms after S2 offset), followed by a plateau. The preferred versus anti-preferred activity levels differed significantly in the early part of the S2 period (two-tailed paired t test, t(265) = 10.7, p < 0.001 in PA; t(68) = 5.2, p < 0.001 in PFdl), the late part of the S2 period (t(265) = 15.3, p < 0.001 in PA; t(68) = 8.2, p < 0.001 in PFdl), and in the D2 period (t(265) = 14.2, p < 0.001 in PA; t(68) = 5.4, p < 0.001 in PFdl).
Figure 11.
Population activity averages. Correct trials, Solid lines; error trials, dashed lines. Shading indicates SEM. A, Feature-based distance coding. B, Order-based distance coding. Only trials with D2 periods of 800 ms are included. Bin width, 20 ms; smoothed with a five-bin moving average.
Figure 11B and supplemental Figure 2B (available at www.jneurosci.org as supplemental material) come from the cells and trials used for the blue and green curves in Figure 10B: neurons that encoded whether S1 or S2 had appeared farther from the reference. The preferred and anti-preferred averages of the cells differed significantly during the early part of the S2 period (t(318) = 10.7, p < 0.001 in PA; t(66) = 3.4, p < 0.001 in PFdl), the late part of the S2 period (t(318) = 15.0, p < 0.001 in PA; t(66) = 7.1, p < 0.001 in PFdl), and the D2 period (t(318) = 7.7, p < 0.001 in PA; t(66) = 3.5, p < 0.001 in PFdl). Compared with the feature-based coding shown in Figure 11A, the order-based distance signal decreased in amplitude during the D2 period. In accord with the ROC analysis, the difference between preferred and anti-preferred stimulus-distances dissipated as the C&A period approached.
Error trials
During error trials (Fig. 11, dashed lines) (supplemental Fig. 2, available at www.jneurosci.org as supplemental material), the monkeys reported incorrectly that the closer stimulus had been farther from the reference point. We sorted trials according to which stimulus the monkeys ultimately chose on those trials. For the most part, the neuronal population encoded the report the monkey had made rather than the one that would have been correct. This result is illustrated for a single neuron in Figure 7C. When the red stimulus had appeared farther from the reference but the monkey incorrectly chose the blue stimulus, the cell had the same C&A-period activity as when the monkey correctly reported that the blue stimulus had been farther. For neurons encoding relative distance based on stimulus features (Fig. 11A) (supplemental Fig. 2A, available at www.jneurosci.org as supplemental material), the difference between the preferred and anti-preferred averages of the cells remained significant in the early part of the S2 period in PA but not in PFdl (t(265) = 4.17, p < 0.001 in PA; t(68) = 1.7, p = 0.095, NS in PFdl). In the late part of the S2 period, this difference was significant in both PA and PFdl (t(265) = 6.7, p < 0.001 in PA; t(68) = 2,8, p < 0.05 in PFdl), and in the D2 period, this difference was significant in PA but not in PFdl (t(265) = 4.37, p < 0.001 in PA; t(68) = 0.870, NS in PFdl), as it was for the early part of the S2 period.
Figure 11B and supplemental Figure 2B (available at www.jneurosci.org as supplemental material) show error-trial data for cells encoding relative distance based on stimulus order. The results were somewhat mixed, with a weak signal reflecting the incorrect choice during the S2 period but not during the D2 period. For the PA cortex, the preferred and anti-preferred averages of the cells differed significantly on error trials during the S2 period (t(318) = 3.2, p < 0.05 in early S2; t(318) = 2.45, p < 0.05 in late S2) but not during the D2 period (t(318) = 0.64, p = 0.52, NS). For PFdl, this difference was significant only during the late S2 period (t(66) = 2.46, p < 0.05) but not in either the early S2 period (t(66) = 1.9, p = 0.065, NS) or the D2 period (t(66) = 0.38, p = 0.70, NS).
Discussion
The present study examined whether PF cortical areas that encode decisions in a relative-duration discrimination task (Genovesio et al., 2009) also do so in a relative-distance discrimination task. Neuronal activity was sampled in the same two areas, using the same two stimuli, in the same two monkeys. Our analysis focused on four questions. Were distances encoded absolutely (in terms of the distance of a stimulus from a reference point) or relatively (taking both stimuli into account)? Were relative distances encoded parametrically (reflecting how much the two distances differed) or categorically (designating which stimulus was farther from the reference independent of the magnitude of that difference)? Were they encoded concretely (for each combination of stimulus positions) or abstractly (independent of stimulus position)? And was the activity feature based, order based, or position based? The answers to these questions closely resembled those for the relative-duration task (Genovesio et al., 2009). Relative-distance coding predominated over absolute-distance coding, and relative-distance coding was predominantly categorical and abstract. Like relative-duration coding, relative-distance coding was linked to stimulus features (e.g., color) and order. As in the relative-duration task, feature-based coding supplanted order-based coding as the time for the choice approached.
Abstract, relative, and categorical coding has been reported previously for PF. An example of abstract coding is the role of PF in semantic associations between signs and numerical categories (Diester and Nieder, 2008). Niki (1974) first reported relative coding in PFdl neurons, for relative location, and this finding has been extended to object-centered reference frames (Olson, 2003), as well as to the relative coding of value (Tremblay and Schultz, 1999; Padoa-Schioppa and Assad, 2006; Hosokawa et al., 2007), flutter frequency (Romo and Salinas, 2003), and reward time (Tsujimoto and Sawaguchi, 2007). Categorical coding has been reported in several studies of PF (Freedman et al., 2002; Shima et al., 2007; Ferrera et al., 2009; Kusunoki et al., 2010). Roy et al. (2010), for example, showed that PF populations represented competing categories.
Some of these properties probably reflected task demands. A large population of neurons encoded whether the red or blue stimulus had appeared farther from the reference point, and this signal was maintained after the choice stimuli appeared and the monkeys made their response. The prevalence and persistence of this signal was unsurprising because the monkeys were rewarded for choosing the red or blue stimulus when it had appeared farther from the reference point. In parallel with results from the duration-discrimination task (Genovesio et al., 2009), feature-based coding supplanted order-based coding as the time for the choice and action neared.
In our duration-discrimination task (Genovesio et al., 2009), we could only study order- and feature-based coding, and, as just noted, feature coding was a special case because the monkey reported this information by its action. The present experiment introduced an additional factor: the position of the stimuli up or down from the reference point. This allowed us to examine two kinds of coding that were not task requirements: order and position based. Although we found ample representation of relative distance based on stimulus order, the analogous coding based on stimulus position was much less common. This finding could indicate that monkeys used the order of presentation as an intermediate computation, without using position to the same extent. There have been several studies showing the importance of frontal cortex for ordered sequences of objects, spatial locations, and movements, including PA, PFdl, the supplementary eye field, and the supplementary motor area (Barone and Joseph, 1989; Averbeck et al., 2003; Isoda and Tanji, 2003; Ninokura et al., 2003; Hasegawa et al., 2004; Berdyyeva and Olson, 2010). We also observed representations of stimulus order, but the signals we describe in this report differ in that they combine distance and order information. We propose that stimulus order plays a preferential role in the task compared with stimulus position.
In a vibrotactile-discrimination task, PF (and premotor cortex) neurons encoded relative flutter frequency based on order (Romo and Salinas, 2003). During the S2 period, cells encoded whether S1 or S2 had the higher flutter frequency. This task differed from ours in that the monkey's response choice was based on the order of stimuli: S1-higher mapped to one motor response and S2-higher mapped to another response. We also found order-based relative coding, but in the present experiment, we could rule out motor factors. Furthermore, because our monkeys chose their responses based on stimulus features, we could obtain evidence that the order-based distance codes formed an intermediate representation, as discussed above.
During error trials, the population encoding a farther stimulus reflected the stimulus chosen by the monkey, not the stimulus that actually had been farther from the reference point. Several previous reports have shown that, on error trials, dorsolateral PF activity reflected what the monkeys did in terms of a movement sequence (Averbeck and Lee, 2007), a category of such sequences (Shima et al., 2007), or the goal selected (Genovesio et al., 2008). These findings indicate the close linkage of PF activity to choices and actions. In contrast, the representation of abstractions that guide behavior, such as strategies, rules, or task context, are often weak or absent in PF during errors (Mansouri et al., 2006; Genovesio et al., 2008).
Memory signals
During the D1 period, the monkeys had to remember either the location of S1 or its distance from the reference point to make their later choice. Given the longstanding emphasis on the role of the PFdl cortex in spatial working memory (Goldman-Rakic, 1994, 1997, 2000; Levy and Goldman-Rakic, 2000; Constantinidis et al., 2001), it was surprising that, during the D1 period, the prevalence of location or distance coding was only 3–4% above that expected by chance. This small percentage might reflect the limited part that simple spatial memories played in the present task. In addition to remembering spatial information, the monkeys had to compare two object-like stimuli along a distance dimension and later choose one of them according to a rule. The present findings thus supports others (Rao et al., 1997; Rainer et al., 1998; Lebedev et al., 2004; Buckley et al., 2009) challenging the view that PFdl functions primarily in spatial working memory. Tasks that involve little more than remembering the location of a recent spatial cue, such as the spatial delayed-response task and its derivatives, promote an oversimplified view of PFdl.
Common metric for space and time
There is evidence for a frontoparietal network involved in the representation of time, space, number, and order (Leon and Shadlen, 2003; Walsh, 2003; Nieder and Miller, 2004; Janssen and Shadlen, 2005; Nieder, 2005; Genovesio et al., 2006b; Tudusciuc and Nieder, 2009). It has been proposed that the perception of space, time, and quantity are part of a generalized magnitude system (Gallistel and Gelman, 2000; Walsh, 2003). One hypothesis is that representations of different types of quantities share a common representation of magnitude (Gallistel and Gelman, 2000). Some data support this hypothesis (Mitchell and Davis, 1987; Basso et al., 1996), but others have contradicted it (Cappelletti et al., 2009).
Together with our previous results (Genovesio et al., 2009), we conclude that two parts of PF, PFdl and PA, compute comparisons of both time (duration discrimination) and space (distance discrimination). It is well known that these areas contribute to the performance of many tasks, with diverse cognitive requirements. Indeed, one idea about these area is that they contribute to nearly all of the behaviors and memories important to primates (Gaffan, 2002), including humans (Duncan, 2010). Nevertheless, the present findings provide general support for a common neural-processing resource that could account for the interference between spatial and temporal perception in both humans and monkeys (Casasanto and Boroditsky, 2008; Merritt et al., 2010). Walsh (2003) proposed that these perceptual dimensions, among others, share resources because they represent information that can be used to direct action. The link to action is central to a theory of magnitude (ATOM) representation and is relevant to the concept of embodied cognition (Cisek and Kalaska, 2010). In this context, it is of interest that duration and distance comparisons are based on the same sequence of computations: an early one dependent on stimulus order and a later one based on stimulus features. Future analysis and experiments are needed to test ATOM directly, at the single-cell level and in tasks with conflicting distance and duration stimuli.
Spatial cognition in monkeys
Spatial cognition has ecological importance because landmarks used in foraging can be difficult to discriminate. Marmosets (and human children) use relative relationships between items in a visual scene (MacDonald et al., 2004), and PF provides a neural substrate for that capacity. Baboons (Dépy et al., 1998, 1999) and capuchin monkeys (Spinozzi et al., 2004) can represent abstract and categorical spatial relationships, which could also be used in foraging. In the present study, both monkeys transferred a rule from the standard task to a control task with both stimuli on the same side of the reference. Thus, macaque monkeys can use abstract relational rules in the service of foraging choices along with memorized exemplars.
Footnotes
This work was supported by Division of Intramural Research of the National Institute of Mental Health Grant Z01MH-01092. We thank Dr. Andrew Mitz, James Fellows, and Ping-Yu Chen for technical support.
References
- Averbeck BB, Lee D. Prefrontal neural correlates of memory for sequences. J Neurosci. 2007;27:2204–2211. doi: 10.1523/JNEUROSCI.4483-06.2007. [DOI] [PMC free article] [PubMed] [Google Scholar]
- Averbeck BB, Chafee MV, Crowe DA, Georgopoulos AP. Neural activity in prefrontal cortex during copying geometrical shapes. I. Single cells encode shape, sequence, and metric parameters. Exp Brain Res. 2003;150:127–141. doi: 10.1007/s00221-003-1416-6. [DOI] [PubMed] [Google Scholar]
- Barone P, Joseph JP. Prefrontal cortex and spatial sequencing in macaque monkey. Exp Brain Res. 1989;78:447–464. doi: 10.1007/BF00230234. [DOI] [PubMed] [Google Scholar]
- Basso G, Nichelli P, Frassinetti F, di Pellegrino G. Time perception in a neglected space. NeuroReport. 1996;7:2111–2114. doi: 10.1097/00001756-199609020-00009. [DOI] [PubMed] [Google Scholar]
- Berdyyeva TK, Olson CR. Rank signals in four areas of macaque frontal cortex during selection of actions and objects in serial order. J Neurophysiol. 2010;104:141–159. doi: 10.1152/jn.00639.2009. [DOI] [PMC free article] [PubMed] [Google Scholar]
- Bhattacharyya R, Musallam S, Andersen RA. Parietal reach region encodes reach depth using retinal disparity and vergence angle signals. J Neurophysiol. 2009;102:805–816. doi: 10.1152/jn.90359.2008. [DOI] [PMC free article] [PubMed] [Google Scholar]
- Buckley MJ, Mansouri FA, Hoda H, Mahboubi M, Browning PG, Kwok SC, Phillips A, Tanaka K. Dissociable components of rule-guided behavior depend on distinct medial and prefrontal regions. Science. 2009;325:52–58. doi: 10.1126/science.1172377. [DOI] [PubMed] [Google Scholar]
- Cappelletti M, Freeman ED, Cipolotti L. Dissociations and interactions between time, numerosity and space processing. Neuropsychologia. 2009;47:2732–2748. doi: 10.1016/j.neuropsychologia.2009.05.024. [DOI] [PMC free article] [PubMed] [Google Scholar]
- Casasanto D, Boroditsky L. Time in the mind: using space to think about time. Cognition. 2008;106:579–593. doi: 10.1016/j.cognition.2007.03.004. [DOI] [PubMed] [Google Scholar]
- Cisek P, Kalaska JF. Neural mechanisms for interacting with a world full of action choices. Annu Rev Neurosci. 2010;33:269–298. doi: 10.1146/annurev.neuro.051508.135409. [DOI] [PubMed] [Google Scholar]
- Constantinidis C, Franowicz MN, Goldman-Rakic PS. The sensory nature of mnemonic representation in the primate prefrontal cortex. Nat Neurosci. 2001;4:311–316. doi: 10.1038/85179. [DOI] [PubMed] [Google Scholar]
- Courtney SM, Ungerleider LG, Keil K, Haxby JV. Object and spatial visual working memory activate separate neural systems in human cortex. Cereb Cortex. 1996;6:39–49. doi: 10.1093/cercor/6.1.39. [DOI] [PubMed] [Google Scholar]
- Dépy D, Fagot J, Vauclair J. Comparative assessment of distance processing and hemispheric specialization in humans and baboons (Papio papio) Brain Cogn. 1998;38:165–182. doi: 10.1006/brcg.1998.1027. [DOI] [PubMed] [Google Scholar]
- Dépy D, Fagot J, Vauclair J. Processing of above/below categorical spatial relations by baboons (Papio papio) Behav Process. 1999;48:1–9. doi: 10.1016/s0376-6357(99)00055-8. [DOI] [PubMed] [Google Scholar]
- Diester I, Nieder A. Complementary contributions of prefrontal neuron classes in abstract numerical categorization. J Neurosci. 2008;28:7737–7747. doi: 10.1523/JNEUROSCI.1347-08.2008. [DOI] [PMC free article] [PubMed] [Google Scholar]
- Druzgal TJ, D'Esposito M. Dissecting contributions of prefrontal cortex and fusiform face area to face working memory. J Cogn Neurosci. 2003;15:771–784. doi: 10.1162/089892903322370708. [DOI] [PubMed] [Google Scholar]
- Duncan J. The multiple-demand (MD) system of the primate brain: mental programs for intelligent behaviour. Trends Cogn Sci. 2010;14:172–179. doi: 10.1016/j.tics.2010.01.004. [DOI] [PubMed] [Google Scholar]
- Ferraina S, Battaglia-Mayer A, Genovesio A, Archambault P, Caminiti R. Parietal encoding of action in depth. Neuropsychologia. 2009a;47:1409–1420. doi: 10.1016/j.neuropsychologia.2008.12.028. [DOI] [PubMed] [Google Scholar]
- Ferraina S, Brunamonti E, Giusti MA, Costa S, Genovesio A, Caminiti R. Reaching in depth: hand position dominates over binocular eye position in the rostral superior parietal lobule. J Neurosci. 2009b;29:11461–11470. doi: 10.1523/JNEUROSCI.1305-09.2009. [DOI] [PMC free article] [PubMed] [Google Scholar]
- Ferrera VP, Yanike M, Cassanello C. Frontal eye field neurons signal changes in decision criteria. Nat Neurosci. 2009;12:1458–1462. doi: 10.1038/nn.2434. [DOI] [PMC free article] [PubMed] [Google Scholar]
- Freedman DJ, Riesenhuber M, Poggio T, Miller EK. Visual categorization and the primate prefrontal cortex: neurophysiology and behavior. J Neurophysiol. 2002;88:929–941. doi: 10.1152/jn.2002.88.2.929. [DOI] [PubMed] [Google Scholar]
- Funahashi S, Bruce CJ, Goldman-Rakic PS. Mnemonic coding of visual space in the monkey's dorsolateral prefrontal cortex. J Neurophysiol. 1989;61:331–349. doi: 10.1152/jn.1989.61.2.331. [DOI] [PubMed] [Google Scholar]
- Funahashi S, Chafee MV, Goldman-Rakic PS. Prefrontal neuronal activity in rhesus monkeys performing a delayed anti-saccade task. Nature. 1993;365:753–756. doi: 10.1038/365753a0. [DOI] [PubMed] [Google Scholar]
- Fuster JM. Unit activity in prefrontal cortex during delayed-response performance: neuronal correlates of transient memory. J Neurophysiol. 1973;36:61–78. doi: 10.1152/jn.1973.36.1.61. [DOI] [PubMed] [Google Scholar]
- Gaffan D. Against memory systems. Philos Trans R Soc Lond B Biol Sci. 2002;357:1111–1121. doi: 10.1098/rstb.2002.1110. [DOI] [PMC free article] [PubMed] [Google Scholar]
- Gallistel CR, Gelman II. Non-verbal numerical cognition: from reals to integers. Trends Cogn Sci. 2000;4:59–65. doi: 10.1016/s1364-6613(99)01424-2. [DOI] [PubMed] [Google Scholar]
- Genovesio A, Ferraina S. Integration of retinal disparity and fixation-distance related signals toward an egocentric coding of distance in the posterior parietal cortex of primates. J Neurophysiol. 2004;91:2670–2684. doi: 10.1152/jn.00712.2003. [DOI] [PubMed] [Google Scholar]
- Genovesio A, Brasted PJ, Mitz AR, Wise SP. Prefrontal cortex activity related to abstract response strategies. Neuron. 2005;47:307–320. doi: 10.1016/j.neuron.2005.06.006. [DOI] [PMC free article] [PubMed] [Google Scholar]
- Genovesio A, Brasted PJ, Wise SP. Representation of future and previous spatial goals by separate neural populations in prefrontal cortex. J Neurosci. 2006a;26:7305–7316. doi: 10.1523/JNEUROSCI.0699-06.2006. [DOI] [PMC free article] [PubMed] [Google Scholar]
- Genovesio A, Tsujimoto S, Wise SP. Neuronal activity related to elapsed time in prefrontal cortex. J Neurophysiol. 2006b;95:3281–3285. doi: 10.1152/jn.01011.2005. [DOI] [PMC free article] [PubMed] [Google Scholar]
- Genovesio A, Tsujimoto S, Wise SP. Encoding problem-solving strategies in prefrontal cortex: activity during strategic errors. Eur J Neurosci. 2008;27:984–990. doi: 10.1111/j.1460-9568.2008.06048.x. [DOI] [PMC free article] [PubMed] [Google Scholar]
- Genovesio A, Tsujimoto S, Wise SP. Feature- and order-based timing representations in the frontal cortex. Neuron. 2009;63:254–266. doi: 10.1016/j.neuron.2009.06.018. [DOI] [PMC free article] [PubMed] [Google Scholar]
- Goldman-Rakic P. Space and time in the mental universe. Nature. 1997;386:559–560. doi: 10.1038/386559a0. [DOI] [PubMed] [Google Scholar]
- Goldman-Rakic P. Localization of function all over again. Neuroimage. 2000;11:451–457. doi: 10.1006/nimg.2000.0575. [DOI] [PubMed] [Google Scholar]
- Goldman-Rakic PS. The issue of memory in the study of prefrontal function. In: Thierry AM, Glowinski J, Goldman-Rakic PS, Christen Y, editors. Motor and cognitive functions of the prefrontal cortex. Berlin: Springer; 1994. pp. 112–121. [Google Scholar]
- Hasegawa RP, Blitz AM, Goldberg ME. Neurons in monkey prefrontal cortex whose activity tracks the progress of a three-step self-ordered task. J Neurophysiol. 2004;92:1524–1535. doi: 10.1152/jn.01110.2003. [DOI] [PubMed] [Google Scholar]
- Hosokawa T, Kato K, Inoue M, Mikami A. Neurons in the macaque orbitofrontal cortex code relative preference of both rewarding and aversive outcomes. Neurosci Res. 2007;57:434–445. doi: 10.1016/j.neures.2006.12.003. [DOI] [PubMed] [Google Scholar]
- Isoda M, Tanji J. Contrasting neuronal activity in the supplementary and frontal eye fields during temporal organization of multiple saccades. J Neurophysiol. 2003;90:3054–3065. doi: 10.1152/jn.00367.2003. [DOI] [PubMed] [Google Scholar]
- Janssen P, Shadlen MN. A representation of the hazard rate of elapsed time in macaque area LIP. Nat Neurosci. 2005;8:234–241. doi: 10.1038/nn1386. [DOI] [PubMed] [Google Scholar]
- Kusunoki M, Sigala N, Nili H, Gaffan D, Duncan J. Target detection by opponent coding in monkey prefrontal cortex. J Cogn Neurosci. 2010;22:751–760. doi: 10.1162/jocn.2009.21216. [DOI] [PubMed] [Google Scholar]
- Lebedev MA, Messinger A, Kralik JD, Wise SP. Representation of attended versus remembered locations in prefrontal cortex. PLoS Biol. 2004;2:e365. doi: 10.1371/journal.pbio.0020365. [DOI] [PMC free article] [PubMed] [Google Scholar]
- Leon MI, Shadlen MN. Representation of time by neurons in the posterior parietal cortex of the macaque. Neuron. 2003;38:317–327. doi: 10.1016/s0896-6273(03)00185-5. [DOI] [PubMed] [Google Scholar]
- Levy R, Goldman-Rakic PS. Segregation of working memory functions within the dorsolateral prefrontal cortex. Exp Brain Res. 2000;133:23–32. doi: 10.1007/s002210000397. [DOI] [PubMed] [Google Scholar]
- MacDonald S, Spetch ML, Kelly DM, Cheng K. Strategies in landmark use by children, adults and marmoset monkeys. Learn Motiv. 2004;35:322–347. [Google Scholar]
- Mansouri FA, Matsumoto K, Tanaka K. Prefrontal cell activities related to monkeys' success and failure in adapting to rule changes in a Wisconsin Card Sorting Test analog. J Neurosci. 2006;26:2745–2756. doi: 10.1523/JNEUROSCI.5238-05.2006. [DOI] [PMC free article] [PubMed] [Google Scholar]
- Merritt DJ, Casasanto D, Brannon EM. Do monkeys think in metaphors? Representations of space and time in monkeys and humans. Cognition. 2010;117:191–202. doi: 10.1016/j.cognition.2010.08.011. [DOI] [PMC free article] [PubMed] [Google Scholar]
- Mitchell CT, Davis R. The perception of time in scale model environments. Perception. 1987;16:5–16. doi: 10.1068/p160005. [DOI] [PubMed] [Google Scholar]
- Nieder A. Counting on neurons: the neurobiology of numerical competence. Nat Rev Neurosci. 2005;6:177–190. doi: 10.1038/nrn1626. [DOI] [PubMed] [Google Scholar]
- Nieder A, Miller EK. A parieto-frontal network for visual numerical information in the monkey. Proc Natl Acad Sci U S A. 2004;101:7457–7462. doi: 10.1073/pnas.0402239101. [DOI] [PMC free article] [PubMed] [Google Scholar]
- Niki H. Prefrontal unit activity during delayed alternation in the monkey. II. Relation to absolute versus relative direction of response. Brain Res. 1974;68:197–204. doi: 10.1016/0006-8993(74)90389-8. [DOI] [PubMed] [Google Scholar]
- Ninokura Y, Mushiake H, Tanji J. Representation of the temporal order of visual objects in the primate lateral prefrontal cortex. J Neurophysiol. 2003;89:2868–2873. doi: 10.1152/jn.00647.2002. [DOI] [PubMed] [Google Scholar]
- Ninokura Y, Mushiake H, Tanji J. Integration of temporal order and object information in the monkey lateral prefrontal cortex. J Neurophysiol. 2004;91:555–560. doi: 10.1152/jn.00694.2003. [DOI] [PubMed] [Google Scholar]
- Olson CR. Brain representation of object-centered space in monkeys and humans. Annu Rev Neurosci. 2003;26:331–354. doi: 10.1146/annurev.neuro.26.041002.131405. [DOI] [PubMed] [Google Scholar]
- Padoa-Schioppa C, Assad JA. Neurons in the orbitofrontal cortex encode economic value. Nature. 2006;441:223–226. doi: 10.1038/nature04676. [DOI] [PMC free article] [PubMed] [Google Scholar]
- Rainer G, Asaad WF, Miller EK. Memory fields of neurons in the primate prefrontal cortex. Proc Natl Acad Sci U S A. 1998;95:15008–15013. doi: 10.1073/pnas.95.25.15008. [DOI] [PMC free article] [PubMed] [Google Scholar]
- Rao SC, Rainer G, Miller EK. Integration of what and where in the primate prefrontal cortex. Science. 1997;276:821–824. doi: 10.1126/science.276.5313.821. [DOI] [PubMed] [Google Scholar]
- Romo R, Salinas E. Flutter discrimination: neural codes, perception, memory and decision making. Nat Rev Neurosci. 2003;4:203–218. doi: 10.1038/nrn1058. [DOI] [PubMed] [Google Scholar]
- Roy JE, Riesenhuber M, Poggio T, Miller EK. Prefrontal cortex activity during flexible categorization. J Neurosci. 2010;30:8519–8528. doi: 10.1523/JNEUROSCI.4837-09.2010. [DOI] [PMC free article] [PubMed] [Google Scholar]
- Schall JD, Stuphorn V, Brown JW. Monitoring and control of action by the frontal lobes. Neuron. 2002;36:309–322. doi: 10.1016/s0896-6273(02)00964-9. [DOI] [PubMed] [Google Scholar]
- Shima K, Isoda M, Mushiake H, Tanji J. Categorization of behavioural sequences in the prefrontal cortex. Nature. 2007;445:315–318. doi: 10.1038/nature05470. [DOI] [PubMed] [Google Scholar]
- Spinozzi G, Lubrano G, Truppa V. Categorization of above and below spatial relations by tufted capuchin monkeys (Cebus apella) J Comp Psychol. 2004;118:403–412. doi: 10.1037/0735-7036.118.4.403. [DOI] [PubMed] [Google Scholar]
- Tremblay L, Schultz W. Relative reward preference in primate orbitofrontal cortex. Nature. 1999;398:704–708. doi: 10.1038/19525. [DOI] [PubMed] [Google Scholar]
- Tsujimoto S, Sawaguchi T. Prediction of relative and absolute time of reward in monkey prefrontal neurons. NeuroReport. 2007;18:703–707. doi: 10.1097/WNR.0b013e3280d943a1. [DOI] [PubMed] [Google Scholar]
- Tsujimoto S, Genovesio A, Wise SP. Transient neuronal correlations underlying goal selection and maintenance in prefrontal cortex. Cereb Cortex. 2008;18:2748–2761. doi: 10.1093/cercor/bhn033. [DOI] [PMC free article] [PubMed] [Google Scholar]
- Tudusciuc O, Nieder A. Contributions of primate prefrontal and posterior parietal cortices to length and numerosity representation. J Neurophysiol. 2009;101:2984–2994. doi: 10.1152/jn.90713.2008. [DOI] [PubMed] [Google Scholar]
- Walsh V. A theory of magnitude: common cortical metrics of time, space and quantity. Trends Cogn Sci. 2003;7:483–488. doi: 10.1016/j.tics.2003.09.002. [DOI] [PubMed] [Google Scholar]


