Abstract
Left ventricular outflow tract arrhythmias originating from the aortomitral continuity, the left coronary cusp, the superior basal septum, and the epicardial left ventricular summit display common electrocardiographic and electrophysiological features, probably due to the close proximity of those locations. Catheter ablation of these arrhythmias can be challenging. The case of a 68-year-old male with frequent premature ventricular extrasystoles arising from the aortomitral continuity of the basal left ventricle is described. The electrocardiographic and electrophysiologic characteristics of this arrhythmia are discussed.
1. Case Presentation
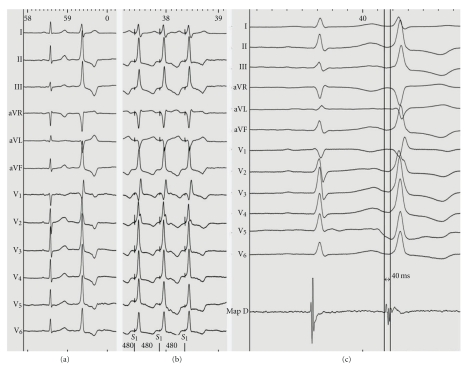
A 68-year-old male with a history of palpitations was referred to our hospital for further evaluation. Baseline ECG showed sinus rhythm and frequent premature ventricular extrasystoles (PVEs) with a relatively narrow QRS complex (115 ms), an inferior axis (tall R waves in leads II, III, and aVF), a qR pattern in lead V1 with no transition zone, and absence of S wave in lead V5 or V6 (Figure 1(a)). Holter monitoring showed frequent monomorphic PVEs without episodes of ventricular tachycardia. Transthoracic echocardiography and coronary angiography ruled out structural heart disease.
Figure 1.
(a) Baseline ECG showing a premature ventricular extrasystole displaying a qR pattern in lead V1; (b) intracardiac tracing during left ventricular mapping (MapD) showing the earliest local activation at the basal left ventricle; (c) pace mapping at this location demonstrated “perfect match” (12 of 12 leads) with the morphology of the premature ventricular extrasystoles.
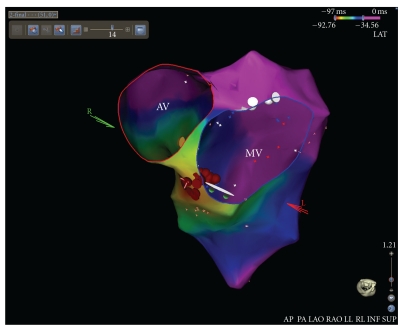
An electrophysiological study was then carried out, where a detailed activation mapping of the PVEs was performed using a 3-dimentional electroanatomical mapping system (CARTO 3, Biosense Webster, Inc., Diamond Bar, Calif, USA). Left ventricular (LV) mapping was performed using a 4mm tip deflectable catheter (NAVISTAR, Biosense Webster). The earliest local activation site of the PVEs (preceding the onset of the surface QRS by 40 ms) was identified at the aortomitral continuity of the basal LV (Figure 1(b)). Pace mapping at this location demonstrated “perfect match” (12 of 12 leads) with the morphology of the PVEs (Figure 1(c)). The first radiofrequency (RF) energy application (target temperature of 60°C, 30 W, 60 s, and impedance drop of 5–10 ohms) abolished all the PVBs arising from the aortomitral continuity (Figure 2). Additional RF applications (total ablation time up to 180 s) were delivered at this region in order to ensure a long-term success (red dots in Figure 2).
Figure 2.
Activation mapping of the premature ventricular extrasystoles performed using a 3-dimentional electroanatomical mapping system revealed the earliest ventricular activation at the aortomitral continuity. Energy delivery (red dots) at this region abolished all the premature ventricular extrasystoles. AV: aortic valve; MV: mitral valve.
2. Discussion
LV outflow tract ventricular arrhythmias originating from the aortomitral continuity, the left coronary cusp, the superior basal septum, and the epicardial left ventricular summit display common electrocardiographic and electrophysiological features, probably due to the close proximity of those locations [1–3]. Catheter ablation of these arrhythmias can be challenging. Data regarding ventricular arrhythmias arising from the aortomitral continuity are limited and conflicting [1–3]. Dixit et al. have shown that PVEs arising from the aortomitral continuity display narrow QRS complexes, tall R waves in inferior leads (particularly in lead II), predominantly positive forces in lead I (where superior and lateral basal sites display negative forces), and a qR pattern in lead V1 [3]. The later finding has been proposed as pathognomonic of pace maps from this location [3]. Yamada et al. have demonstrated the occurrence of a qR pattern in lead V1 and S wave in lead V5 or V6 in 50% of patients with PVEs arising from aortomitral continuity [1]. The absence of S wave in lead V5 or V6 favours the diagnosis of PVEs originating from the left coronary cusp or the epicardial left ventricular summit [1]. In a different study, Kumagai et al. have shown that all patients with PVEs arising from the aortomitral continuity exhibit monophasic R waves without S waves in almost all precordial leads [2]. These investigators failed to demonstrate a qR pattern in lead V1 or S wave in lead V6 [2].
References
- 1.Yamada T, McElderry HT, Okada T, et al. Idiopathic left ventricular arrhythmias originating adjacent to the left aortic sinus of valsalva: electrophysiological rationale for the surface electrocardiogram. Journal of Cardiovascular Electrophysiology. 2010;21(2):170–176. doi: 10.1111/j.1540-8167.2009.01608.x. [DOI] [PubMed] [Google Scholar]
- 2.Kumagai K, Fukuda K, Wakayama Y, et al. Electrocardiographic characteristics of the variants of idiopathic left ventricular outflow tract ventricular tachyarrhythmias. Journal of Cardiovascular Electrophysiology. 2008;19(5):495–501. doi: 10.1111/j.1540-8167.2007.01085.x. [DOI] [PubMed] [Google Scholar]
- 3.Dixit S, Gerstenfeld EP, Lin D, et al. Identification of distinct electrocardiographic patterns from the basal left ventricle: distinguishing medial and lateral sites of origin in patients with idiopathic ventricular tachycardia. Heart Rhythm. 2005;2(5):485–491. doi: 10.1016/j.hrthm.2005.01.023. [DOI] [PubMed] [Google Scholar]


