Abstract
Background:
The transport of particles in surrogate and actual arterial geometries has been investigated synergistically by experimentation and numerical simulation. The motivating application for this work is orbital atherectomy which spawns a particle cloud in the process of debulking plaque from arterial walls.
Methods:
Paired simulations and experiments were performed to prove the capability of the simulation model to predict both fluid and particle motions in branched arterial geometries. The verified model was then employed to predict the pattern of fluid flow in an actual multi-branched arterial geometry, including the flowrates passing through each of the individual branches. These predictions are in very good agreement with experimental data. Focus was then shifted to the issues of particle agglomeration within the flowing fluid and particle accumulation on the vessel walls. Once again, a synergistic approach was used. Flow visualization was employed to track the particle motions and to identify possible particle agglomeration within the fluid.
Results and Conclusions:
Accumulation of particles on walls was identified by measuring size distributions of effluent and residue within the artery. Scanning Electron Microscopy (SEM) evaluation showed evidence of a size-based sorting as the particles passed through vessels. It was found that plaque-facsimile particles resisted particle-particle agglomeration. They also did not accumulate to the wall of the facsimile artery. In addition, simulations showed that if particle-wall accumulation were to occur, it would be limited to very small regions in the artery branches.
Keywords: Orbital atherectomy, particle flow, blood flow, particle trajectories.
INTRODUCTION
There are many therapeutic treatments which can be facilitated by the capability of predicting the trajectories of particulates in flowing blood. For example, the delivery of drugs and embolizing agents is often a matter of particles reaching a desired location, and the trajectories of the drug-carrying particles is a necessary knowledge base [1-3]. As another example of the relevance of particle trajectories, the particulates created by orbital atherectomy pass through the peripheral vascular system, and their dispersion trajectories are a significant issue with respect to patient comfort and health [4-6]. In addition to the particle trajectories, it is equally relevant to assess the possibility of particle agglomeration and accumulation, respectively in the bulk of the flow and at the artery walls.
A search of the biomedical literature failed to unearth papers dealing with the prediction of particle trajectories in flowing blood. On the other hand, there is a significant literature on particle behavior in other fluid environments such as liquid droplets in gas [7-11] and a modest literature on agglomeration of particulates in flowing liquids [12]. However, in no case particle agglomeration in blood has been modeled numerically.
The objectives of the present work are to develop and implement numerical simulations and experimental methodologies to predict fluid flow and particle trajectories in branched arteries. As a means of establishing the validity of the simulation model, complementary experiments were performed. Once the model had been verified, it was extended to actual physiological configurations of a portion of the cardiovascular system. Another facet of the present investigation was to synergistically explore agglomeration and accumulation of particles created by orbital atherectomy by means of numerical simulation and experimentation.
Orbital atherectomy is an established therapeutic procedure for the debulking of plaque from stenosed or partially stenosed arteries. Plaque is removed by a sanding action created by the frictional interaction between a high-speed abrasive diamond-coated device (the crown) and the surface of the plaque. The tool is an eccentric crown positioned on a rotating shaft. Shaft rotations on the order of 200,000 rpm are common.
FLUID MECHANICS OF ROTATING ATHERECTOMY
The Experiments
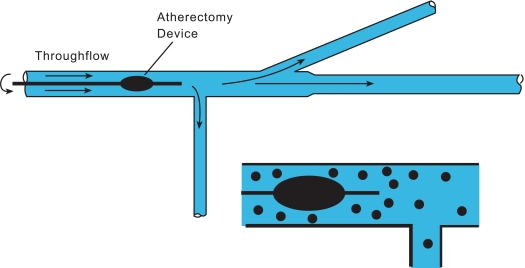
The essential features of the fluid mechanic model for the study of fluid and particle trajectories will now be discussed. The experimental apparatus for this part of the investigation is displayed schematically in Fig. (1). An in vitro simulation of a tapered, branched artery fabricated in glass is shown there. The artery lumen diameters are 5 and 4 mm, respectively, for the upstream and downstream sections, and the overall length is 230 mm. The two branches are at 30o and 90o with respect to the mainflow and have 3 mm lumen diameters. The device was created by a custom glass-manufacturing company using dimensions which are characteristic of those in this portion of the arterial system. Flowrate measurements were made by a weigh-tank method using a high-accuracy scale. Flows were collected at the exit ports of each branch and the mass of effluent was measured as described in the following paragraphs.
Fig. (1).
Schematic diagram of the experimental setup for the study of fluid and particle trifurcation and particle trajectories.
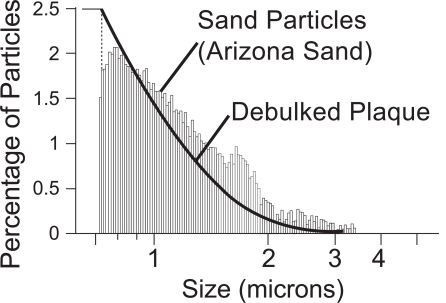
A slurry flow (fluid and particles) of sand particulates in water was introduced at the left-hand end (proximal) of the apparatus. The particles were chosen to simulate the particle-size distribution of debulked plaque. The particle size and concentration of the debulked plaque were measured from samples taken from a cadaver and are displayed in Fig. (2). There, the particle size distribution of the sand is also displayed. It is seen that the sand is an excellent facsimile of the debulked plaque. The plaque particles were measured with a Multisizer 3 Coulter Counter by Beckman Coulter. The sand particle sizes were measured by an air classification measurement technique and then results were confirmed with a Multisizer 2 Coulter Counter. The mean values of plaque and sand particles were found to be 1.122 and 0.989 µm, respectively.
Fig. (2).
Particle size distributions for the dispersed sand and ground plaque.
During the course of the experiments, the debulking crown was positioned at two locations in the artery, one near the inlet and the second just upstream of the first branch. The flowing slurry passes around the rotating crown and continues on to a branch point that is perpendicular to the mainflow direction. The fluid that does not branch next encounters a 30o bifurcation. The effluent from each of the three exits was collected and measured. Water was evaporated from the slurry with the use of an oven. Once the water had been evaporated from each of the collected samples, the mass of the dry particles and the particle-size distributions were obtained. The operating conditions of the experiments were: (a) 0.2 L/s for the flowing fluid and (b) 140,000 rpm for the atherectomy device.
The Numerical Simulations
The numerical simulation of the fluid flow was based on the Reynolds-Averaged Navier-Stokes equations (RANS) supplemented by a turbulence model. The specific turbulence model was selected because it had been previously shown that at low Reynolds numbers, the turbulence intensity dropped to virtually zero so that laminar solutions were obtained [13]. The governing equations encompass two categories: (a) conservation of mass and momentum and (b) turbulent transport equations.
Mass conservation:
| (1) |
RANS form of momentum conservation:
| (2) |
In Eqs. (1) and (2), the ui terms represent velocities expressed in tensor form, p is the local pressure, and ρ and µ signify density and viscosity, respectively.
Turbulence transport equations (Shear Stress Transport model, SST) are
| (3) |
and
| (4) |
The terms k and ω are the turbulent kinetic energy and the specific rate of turbulence dissipation, respectively. The term S is the shear strain rate and the coefficients to the terms are listed in the nomenclature. The solution of Eqs. (3) and (4) yields the so-called turbulent viscosity µt in terms of k and ω. It is
| (5) |
in which F2 is a blending function that limits the turbulent viscosity within the boundary layer. Further details of the SST model can be found in [14].
The turbulent viscosity µt is not a true fluid property but depends strongly on velocity and on position. In order to obtain µt, a turbulence model is required. In the category of two-equation turbulence models, the SST has proved to be robust, as will be demonstrated when experimental results are compared with the predictions of the numerical simulations.
The particles experience a one-sided interaction with the fluid medium. The specific meaning of one-sidedness is that the particle motion is affected by the fluid, but the fluid motion is not affected by the particles. The justification for this type of interaction is that the particles are physically small (0.7 µm to 3 µm) and are well dispersed. The model can readily be extended to larger particle sizes and more concentrated dispersions by taking account of two-sided interactions.
Particle motion was evaluated by a Lagrangian tracking approach where the instantaneous forces on each particle are calculated from the fluid flow solution. The primary forces considered were due to drag, buoyancy, and pressure gradients within the fluid. These forces, taken together, lead to a change in the velocity of the particle . The Lagrangian expression of particle motion emerges as
| (6) |
Aerodynamic drag forces on a particle are related to the slip velocity between a particle and the adjacent fluid. These forces are calculated by making use of Schiller-Naumann [15] drag coefficient CD.
| (7) |
Where CD is the drag coefficient on the particle and Vslip is the difference in particle-fluid velocities. The buoyancy exerts a force which is proportional to the difference in the particle mass and the mass of displaced fluid mf. Its direction is provided by the direction of the gravitational field.
| (8) |
The final contributor to the force sum, shown in Eq. (6), is due to the gradient of pressure in the fluid surrounding the particle.
| (9) |
The numerical solutions were carried out using CFX 12.0, a general-purpose finite-volume-based CFD program. A false-transient, time-stepping approach is employed to enable convergence to the steady-state solution. While the fully implicit, backward-Euler, time-stepping algorithm exhibits first-order accuracy in time, its involvement does not affect the accuracy of the final, converged solution.
Coupling of the velocity-pressure equations was achieved on a non-staggered, collocated grid using the techniques developed by Rhie and Chow [16] and Majumdar [17]. The inclusion of pressure-smoothing terms in the mass conservation equation suppresses oscillations which can occur when both the velocity and pressure are evaluated at coincident nodal locations.
The advection term in the momentum equations was evaluated by using the upwind values of the momentum flux, supplemented with an advection-correction term. The correction term reduces the occurrence of numerical false diffusion and is of second-order accuracy. Details of the advection treatment can be found in Barth and Jesperson [18].
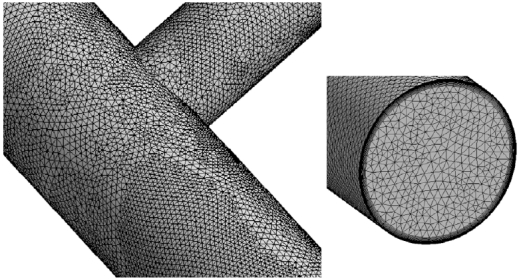
The mesh that was superposed on the system is illustrated in Fig. (3). In order to enable the mesh to be displayed at a size that can be visually resolved, only representative portions of the entire system are displayed. In the main body of the figure, the surface mesh can be viewed while the inset shows the cross-sectional mesh and the adjacent-surface mesh. All told, approximately six million elements were used for the numerical simulations subsequent to the establishment of mesh independence. That establishment consisted of utilizing meshes of 3,000,000 and 6,000,000 elements. A comparison of the apportionment of the flow among the three exits of the system formed the basis of the mesh-independence study. The variations of these results for the two simulations were less than 2.3 %.
Fig. (3).
Exhibition of the computational mesh.
The rotating shaft was treated as a moving-boundary wall, the shaft itself was not included in the solution domain.
FLUID MECHANICS OF AGGLOMERATION AND ACCUMULATION
The Experiments
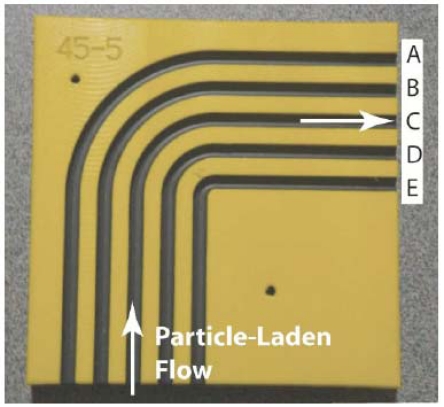
The central component of the experimental setup for the study of the agglomeration and/or accumulation is illustrated in Fig. (4). This component provides for five individual flow-passage configurations that are designated by the letters A – E. All the flow passages are bends with upstream and downstream piping segments. The incorporation of a bend in each flow passage was motivated by the recognition that bends create a complex flow pattern. In particular, a fluid passing through a bend experiences a secondary flow in the cross section of the bend which, when superimposed on the mainflow, gives rise to a helical flow pattern both in the bend and in the downstream straight section. It was reasoned that this flow pattern would promote both agglomeration and accumulation. The various bends are characterized by their respective radius of curvature, starting from the minimum to the maximum as designated by E…A. The wide range of radii of curvature was chosen to represent the range that might be encountered in arterial vessels. The setup was fabricated by machining semicircular grooves in a polymeric substrate. Each groove accommodated a polymeric tube having an outer diameter of 4.75 mm.
Fig. (4).
Apparatus to implement the experimental determination of particle agglomeration and accumulation. The illustrated setup contains five individual flow passages, labeled A-E, that are operated individually. The passages themselves are polymeric tubes set into recesses in the base of the facility.
As shown in Fig. (4), a particle-laden flow is delivered to the inlet of each of the flow passages independently. The entering slurry passes through a straightaway until the bend is encountered. Upon exiting the bend, the slurry flows through another straight section and then exits the apparatus. A slurry flowrate of 40 ml/min was delivered to the respective flow passage being used. The mass concentration of the particles in the slurry was 3%. Three different categories of particulates were separately employed throughout the experimental program: (a) Arizona sand, (b) graphite (particle size range 0 < d < 60 µm), and (c) bone meal (particle size range 0 < d < 90 ìm). Great care was taken to ensure that the slurry entering each passage was homogeneously dispersed. The nature of the entering slurry was assessed by means of scanning electron microscopy (SEM).
The experiments were performed in the steady state. The slurry exiting the respective passage being utilized was collected and subsequently analyzed. The analysis included mass determination by means of a balance capable of resolving 0.0001 grams, assessment of the particle size distribution, and SEM characterization. The nature of the flow moving through the respective flow passages was visually monitored both during the experiments and after the completion of the run in an attempt to identify regions of particle accumulation on the wall of the passage. Further quantitative information was obtained by means of high-speed video photography during the experiment and by photographs of the wall-adhered particles, if any, after the completion of the experiments. To ensure the repeatability of the experimental results, a number of replicate experiments were performed. In the presented results, variations in experimental results are displayed with error bars. The replicate experiments were performed to assess the repeatability of the experiments and the close agreement between simulations and experiments suggest that any large systematic errors are not present.
The Numerical Simulations
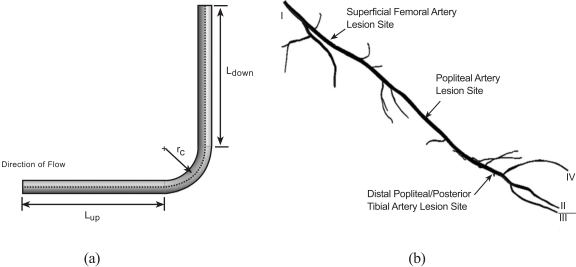
The numerical simulations that were performed with regard to agglomeration and/or accumulation were wide-ranging in that the flow configurations included not only the experimental situation described in the foregoing section but also encompassed an actual arterial system. Figs. (5a and b) display these two geometric categories. In part (a) of the figure, a right-angle bend that is intended to simulate the experimental setup of Fig. (4) is exhibited along with dimensional nomenclature, while in part (b), a reconstruction of a peripheral artery system is displayed.
Fig. (5).
(a) right-angle bend and (b) physiologic geometry selected for numerical simulation.
The equations that govern the fluid flow and particle transport in the geometries displayed in Fig. (5) are the same as those that have already been presented as Eqs. (1) – (9). To specify the unique features of the flows in these geometries, it is necessary to describe the boundary conditions. For the right-angle bend, the varied parameter is the radius of curvature rc. The conventional descriptor of the radius of curvature is the ratio rc/d, where d is the diameter of the lumen. In terms of this ratio, the radius of curvature was assigned values that ranged from 1.4 to 14. The upstream and downstream lengths were equal to 10d. At the inlet cross section, the volumetric flowrate of the slurry was 40 ml/min with a mass fraction of particulates of 3 %. At the exit end of the segment, the standard weak outflow conditions were applied along with a pressure specification of zero gauge.
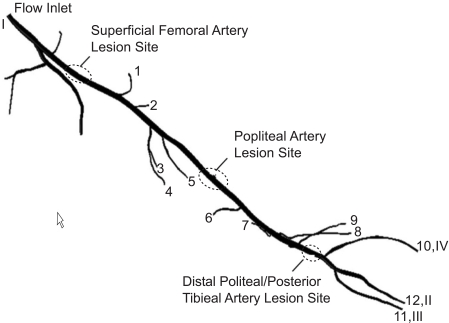
Attention will now be turned to the artery segment shown in Fig. (5b) for which three different simulations were performed. The first spanned the entire length of the displayed geometry extending from position I at the upstream end to positions II-IV at the downstream end. A second simulation extended from the popliteal artery lesion site to the downstream ends II-IV. The third started at the posterior tibial artery lesion site. To illustrate the special nature of the geometry being simulated, a closeup view of the lesion at the superficial femoral artery is presented in Fig. (6). The orientation of the Fig. (6) differs from that of Fig. (5) so that the lesion is visible. The flow cross section is seen to narrow at the lesion. The lesion is joined at each end to healthy vessel walls by tapered sections. The length of the lesion is approximately 40 times the lesion diameter. The reduction in cross-sectional area due to the presence of the lesion is 94 %. These characteristics are similar for the other investigated lesions.
Fig. (6).
Closeup view of the superficial femoral lesion.
Each of the three simulations requires individualized boundary conditions for its specification. For the first simulation, two flowrates at the superficial femoral artery were investigated, 1900 and 190 ml/min, respectively. These values correspond to the maximum and time-averaged flowrates for diseased superficial femoral arteries [19]. Along the path of flow, a number of branches is encountered and at the exit of each branch, a gauge pressure of zero was specified. At the downstream end of the system, information was available for the respective velocities at the locations II, III, and IV from experiments carried out on diseased individuals [19] Fig. (5b). These values are 11.4, 13.3, and 11.4 cm/s respectively for the maximum overall flowrate. At the lower overall flowrate, the corresponding values are 4.3, 7.4, and 4.3 cm/s. For the second of the modeled lesions, the flowrates boundary conditions at the inlet (popliteal artery) were 920 ml/min and 89.9 ml/min. The velocities at the locations II-IV were maintained as before. The third modeled lesion was characterized by inlet flowrates of 220 and 32 ml/min and by exit velocities as in the foregoing discussion. All of the above referenced blood flow information was taken from the literature [19]. For the second simulation, which corresponded to a lesion located in the Popliteal Artery, the inlet flowrate was taken from the simulations which were previously completed for lesions at the Superficial Femoral Artery.
The number of elements that was used in the final simulation runs exceeded seven million. That number of elements was determined on the basis of a mesh-independence study in which the metric used for comparison was the flowrates at the branching arteries in the system.
RESULTS AND DISCUSSION
Validation of the Numerical Simulation Model
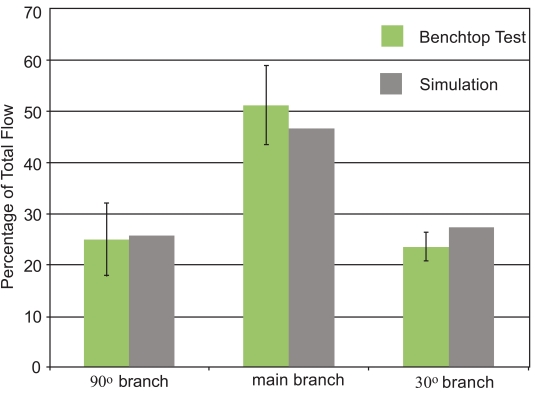
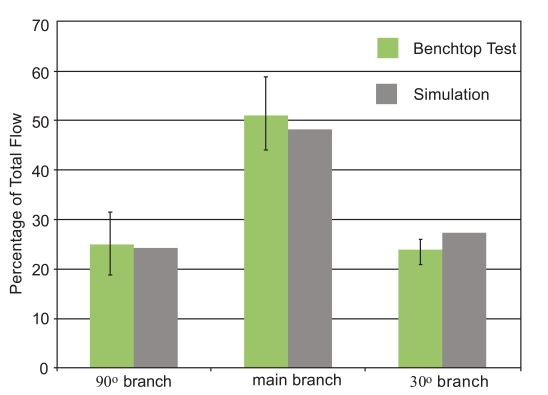
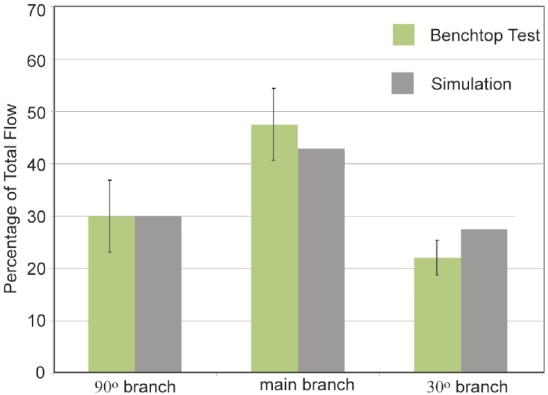
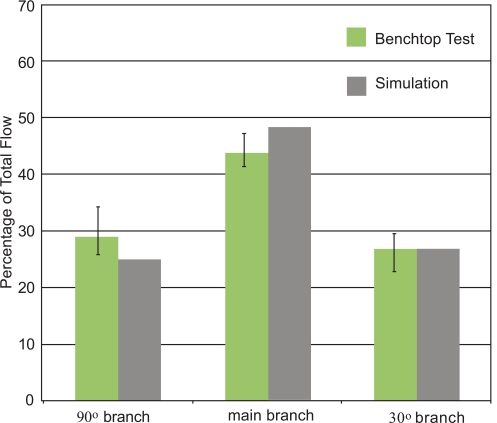
The initial focus of the presentation of results is a display of experimental data and numerical predictions for the slurry flow in the branched in vitro artery pictured in Fig. (1). This presentation consists of four figures, Figs. (7-10). Each figure contains bar graphs which indicate the fraction of the total flow that exits each of the three legs of the apparatus. There are two paired bars for each exit location, respectively, for the experimental data and the numerical predictions. The experimental results are based on a total of nine replicate data runs. Figs. (7 and 8) display information for the slurry flowrates (fluid and particulates) at each exit for two distinct locations of the crown. For Fig. (7), the crown is positioned near the system inlet, whereas for Fig. (8), the crown is located near the 90o branch. Figs. (9 and 10) provide information on the particulate flows (particulates only) for the two crown locations.
Fig. (7).
Slurry mass flowrates at the respective exits of the in vitro artery system of Fig. 1. Orbital atherectomy device situated just downstream of the system inlet.
Fig. (10).
Particulate flowrates at the respective exits of the in vitro artery system of Fig. 1. Orbital atherectomy device situated just upstream of the first branching artery.
Fig. (8).
Slurry mass flowrates at the respective exits of the in vitro artery system of Fig. 1. Orbital atherectomy device situated just upstream of the first branching artery.
Fig. (9).
Particulate flowrates at the respective exits of the in vitro artery system of Fig. 1. Orbital atherectomy device situated just downstream of the system inlet.
The comparison conveyed in Fig. (7) indicates very good agreement between the data and the numerical predictions – the simulation results are within, or near the spread of the experimental data. The maximum deviation between the two sets of results is less than 5%. This outcome provides strong support for the model that underlies the numerical predictions. The next figure, Fig. (8), also pertains to the slurry as a whole. The information in this figure is for the atherectomy crown situated just upstream of the first branch. The results shown there display a level of agreement which is more or less the same as that already observed in Fig. (7).
The next pair of figures is focused on the flowrate of the particulates. Inasmuch as the measurement task was more complex than that for the determination of the slurry as a whole, the deviation between the data and the numerical predictions is somewhat greater, but never exceeds 10%.
Taken together, Figs. (7-10) provide strong testimony supporting the validity of the numerical simulation model. This outcome is of special relevance because the model simulated a flowing fluid laden with particulates. Numerical simulations of such systems are quite uncommon, and the possible uncertainty which prevails for novel undertakings has been addressed. Each figure has error bars showing a two-standard-deviation range for each of the experimental cases.
It can be seen that only for the 30o branch outlet do the experiments and simulations differ by an amount that, in some cases, is outside the range of the experiments. It is believed that these errors may be due to slight differences between the simulations and the experiments. For instance, in the experiments, there are flexible tubes which are used to introduce the liquid into the glass tube. It is possible that the introductory tubing may have imparted a non-axial component to the fluid entering the test section. The simulations utilized a purely axial flow to the glass tubing. It is possible that this feature could explain the differences between the simulations and the experiments. Despite this, it is believed that the simulations provide results of sufficient accuracy to justify their use in the next stage of the investigation.
The standard deviation from the experiments is calculated from Eq. (10), where is the average of a flowrate at any outlet.
| (10) |
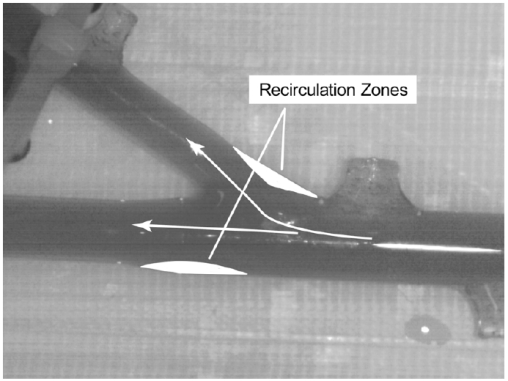
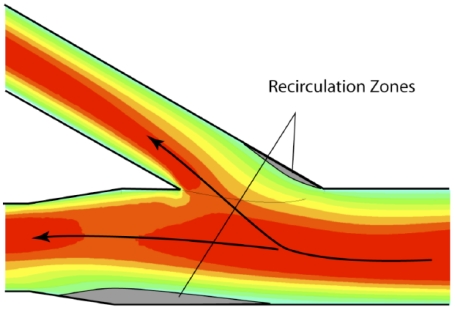
The verification process, already demonstrated by quantitative data, will now be augmented by qualitative comparisons of the patterns of fluid flow. For the experiments, dye injection is employed to make the flow pattern visible. While it is possible to view the un-dyed fluid through the glass wall, the use of dye allows photographic archiving of the results. The outcome of the flow visualization study is presented in Fig. (11). The portion of the simulated glass artery which was selected for the presentation is that in the neighborhood of the 30o branch. It can be seen from Fig. (11) that there are two major zones of fluid separation which are identified there. One of these zones reflects the difficulty that the fluid encounters in making an abrupt turn while the other results from the tendency of the main flow to be diverted toward the branch. This pattern of flow separation and recirculation is well established by information in the published literature. The results obtained by flow visualization can be compared to the results of the numerical simulation which are displayed in Fig. (12). Fig. (12) is a contour plot of local velocity within the artery. Values of the velocity are taken on a plane which passes through the center of the artery. Red and orange colors are regions of high velocity, green and blue represent slow-moving fluid. Since the actual values of the velocity are not germane to the comparison of flow patterns, a color legend has been omitted. A comparison of Figs. (11 and 12) reveals a remarkable congruence of the two sets of results. This outcome provides further strong support for the model which underlies the numerical simulations.
Fig. (11).
Flow visualization results showing regions of recirculation.
Fig. (12).
Numerical simulation results showing regions of recirculation.
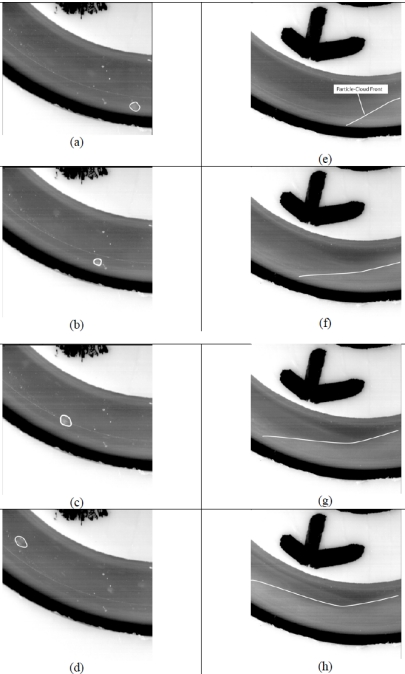
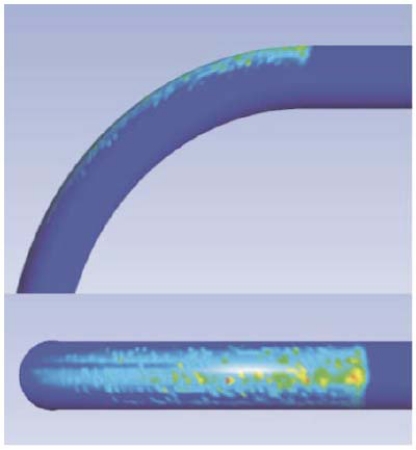
Detailed information about patterns of particle flow is provided by Fig. (13), which is subdivided into parts (a)-(h). The flow system being exhibited is that of Fig. (4) with particular focus on the bend that was illustrated in Fig. (4). The direction of flow is right to left in the images. Owing to the linear momentum possessed by the flow that is approaching the bend, collisions naturally occur between the particles transported by the flowing fluid and the wall of the bend. In parts (a)-(d), the motion of a discrete particle that has impinged on the surface and has bounced off is exhibited at a number of successive values of time. Since the numerical simulation does not presently have the capability to discern whether or not an impacting particle will stick to a wall, all that can be said at this time is that the probability of accumulation is greatest at those locations at which particles impinge. These findings are reinforced with clinical observations that plaque forms preferentially at bend locations in arteries.
Fig. (13).
Discrete- and dust-cloud-based flow visualizations.
A display of the motion of a wave front of a cloud of particles is seen in parts (e)-(h) of Fig. (13). Once again, the particle cloud is moving along the outer wall of the bend. In a later figure, a photograph will be presented of the particles which adhere to the wall.
The numerical-simulation counterpart of Fig. (13) is displayed in Fig. (14). In the latter figure, zones of high-density impingement appear as lighter and darker grey tones. In this color range, the darker grey tones correspond to lesser density impingement and the lighter tones to the most dense impingement. These colors suggest that if there is to be adhesion, the greatest density of adhered particles would follow the color pattern that is displayed in the figure. The regions of highest density impingement that are in evidence in Fig. (14) correspond closely to those which were previously shown in Fig. (13).
Fig. (14).
Simulation results showing particle-wall impacts.
Particle Accumulations
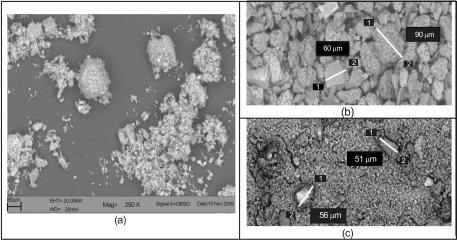
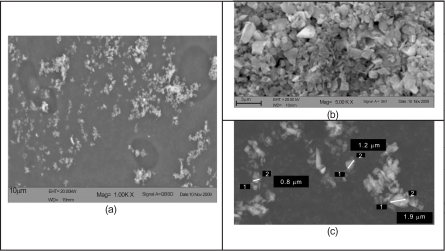
Attention will now be turned to the details of particle behavior as they pass through the test facility of Fig. (4). The results of scanning-electron-microscopy (SEM) evaluation are presented in Figs. (15 and 16), respectively for bone meal and Arizona dust. The (a) parts of both figures displays the dispersion of the particulates in slurry prior to injection into the flow passage. There are marked differences between these dispersions. In the case of the bone meal, the large chunks of the medium are not homogeneously distributed, while for the Arizona dust, which is characterized by much smaller particles, the dispersion is much more uniform.
Fig. (15).
Scanning electronic microscopy for bone meal: (a) in slurry prior to injection, (b) accumulated residue, and (c) effluent bone meal.
Fig. (16).
Scanning electronic microscopy for Arizona road dust: (a) in slurry prior to injection, (b) effluent, and (c) magnified effluent.
As the respective slurries pass through the flow passage, the bone meal does accumulate on the outer bounding surface of the bend, in locations which are consistent with what has been displayed in Figs. (13 and 14). On the other hand, no Arizona dust was detected on the surfaces of the bends. These differences in behavior are believed due to the size differences of the particles. This hypothesis is reinforced by examination of Figs. (15b and c). The images in 15 (b) are extracted from experiments with bone meal while those of (c) are taken using Arizona dust. The SEM photograph of part (b) displays the particles that have accumulated on the surface of the bend. They are clearly large particles, especially when contrasted to the particles which pass through the passage. The (c) part of the figure shows particles which have passed freely through the passage. It is seen that the flow passage is actually behaving as a particle-size separator. A few of the larger particles actually travel through the passage without adhesion to the surfaces, and these can also be seen in part (c).
In Fig. (16b and c), Arizona road dust which was collected from the effluent is shown by SEM magnification. The figures show effluent at different magnifications. In (b), a more-or-less uniform distribution of particulate sizes are observed. This finding is reinforced by measurements made on particles in (c).
Simulation Results for the Superficial Femoral Artery System
Numerical simulations have been performed for a particulate-laden flow passing through the multi-branched artery that was first pictured in Fig. (5b). That figure is repeated in Fig. (17) to enable more precise identification of the several branches. Note that branches 1-12 are downstream of the first lesion, branches 6-12 are downstream of the middle lesion, while 10-12 are downstream of the third lesion. The boundary conditions for the numerical simulations made use of available experimental data [19]. In particular, the cross-sectional average velocities at exits 10-12 were reported for both systolic peak flow and cardiac-cycle average. This information was applied at the aforementioned exits. At the other exits, a prescribed pressure was imposed.
Fig. (17).
Physiologic geometry used in the numerical simulations.
The percentages of the total fluid flow rate and the particulate flowrates that are collected at the exit of each of the branches are displayed in Tables 1-3. Table 1 provides information for two flowrates. Those flowrates refer to the total flowrates administered upstream of the first lesion. They are: (a) high = 2 ml/min and (b) averaged = 0.2 ml/min. For both cases, the particle mass concentration was 3 %. The tabulated numbers can be used to facilitate a verification check on the numerical simulations. Measurements are reported in [20] at a location between branches 5 and 6. The percentage of the total fluid flow remaining in the system downstream of this location was found to be 47%. When the tabulated numbers in branches 6-12 in Table 1 are totaled, the resulting percentages are found to be 45% and 48% for the respective total flowrates. This level of agreement can be regarded as excellent, thereby adding strong support to the validity of the numerical simulation model and to the execution of the model.
Table 1.
Outflows of Slurry and Particulates at the Branches that are Downstream of the First Lesion
| Branch | High Flowrate | Averaged Flowrate | ||
|---|---|---|---|---|
| Flow % | Particulates % | Flow % | Particulates % | |
| 1 | 12 | 15 | 12 | 24 |
| 2 | 10 | 9 | 10 | 10 |
| 3 | 12 | 8 | 10 | 22 |
| 4 | 11 | 24 | 11 | 1 |
| 5 | 9 | 8 | 9 | 4 |
| 6 | 12 | 9 | 15 | 9 |
| 7 | 9 | 0 | 7 | 5 |
| 8 | 7 | 5 | 5 | 12 |
| 9 | 5 | 7 | 4 | 2 |
| 10 | 5 | 5 | 6 | 0 |
| 11 | 4 | 8 | 5 | 5 |
| 12 | 3 | 1 | 6 | 8 |
Table 3.
Outflows of Slurry and Particulates at the Branches that are Downstream of the Last Lesion
| Artery | High Flowrate | Averaged Flowrate | ||
|---|---|---|---|---|
| Flow % | Particulates % | Flow % | Particulates % | |
| 10 | 38 | 29 | 33 | 21 |
| 11 | 36 | 39 | 32 | 26 |
| 12 | 27 | 32 | 35 | 53 |
Observation of the table indicates a more uniform behavior in the fluid flow results than that in the results for the particulates. For the fluid flow, the upstream region, branches 1-6, are characterized by a relatively uniform rate of outflow. For branches 7-12, the level of the outflow is relatively lower than that at the upstream branches. Also noteworthy is the monotonic decrease in the fluid outflows from branches 7-12 for the high flowrate case. On the other hand, for the low flowrate case, the outflows are more or less uniform at branches 7-12. The higher flowrates at the upstream branches are expected based on fluid flow theory.
In some cases, there is a notable change in particulate flowrate when the high and average flowrates are utilized. For instance, branch 4 receives a significant portion of the particulate flow during high-flow conditions but much less during averaged flow. It is believe that this difference results from the flow patterns upstream of the locations where branch 4 connects with the main artery.
Focus may now be shifted to the particulate flowrates at the many branches. The upstream branches, 1-6, capture the majority of the particulates, approximately 70-75% of the total. This suggests a predisposition of the particulates toward the upstream branches. It is noteworthy, however, that the uniformity of outflow at the upstream branches that characterizes the fluid flowrate is not in evidence for the particulate flowrates. In addition to the small particulate outflows through the downstream branches, there is no branch-to-branch trend in that region.
Table 2 conveys results for the branches downstream of the middle lesion. These simulations did not include the arterial geometry upstream of the popliteal lesion site. Attention may first be turned to the fluid flow results. Globally, the rates of fluid outflow decrease more or less monotonically with the branch position number, with a flat tail at branches 10-12. The majority of the fluid outflow occurs at branches 6-10. Noteworthy is the fact that the percentage outflows of fluid are generally the same for the two flowrates. In addition, there is a predisposition to favor outflow through the first branch, both for the fluid flow and for the particulate flow. For the particulates, the percentage outflows at the various branches are well matched for the two flowrates. Aside from the anomalous results for branch 9, the rate of particulate outflow decreases monotonically with branch number.
Table 2.
Outflows of Slurry and Particulates at the Branches that are Downstream of the Middle Lesion
| Artery | High Flowrate | Averaged Flowrate | ||
|---|---|---|---|---|
| Flow % | Particulates % | Flow % | Particulates % | |
| 6 | 32 | 34 | 32 | 38 |
| 7 | 17 | 24 | 13 | 20 |
| 8 | 16 | 12 | 10 | 19 |
| 9 | 10 | 2 | 8 | 0 |
| 10 | 9 | 12 | 12 | 13 |
| 11 | 9 | 8 | 11 | 7 |
| 12 | 7 | 7 | 13 | 3 |
The last table, Table 3, conveys outflow results for the branches downstream of the last lesion. These simulations did not include the arterial geometry upstream of the posterior-tibial lesion site. The rates of fluid outflow are, more or less, uniform among the three branches for both flowrates. For the particulates, the same characterization is applicable at the higher flowrate. At the lower flowrate, there appears to be preference for branch 12 as an outflow port.
CONCLUDING REMARKS
A multi-faceted, synergistic-based investigation has been performed to quantify the fluid mechanics of particle-laden flows in human blood vessels. The synergism was achieved by means of complementary experimentation and numerical simulation. Although the motivating application is specific to a particular therapeutic modality, the developed and implemented methodology has broad applicability.
The motivating application for this investigation is orbital atherectomy whose function is to debulk arterial plaque. This method is used extensively to treat peripheral arterial disease (PAD). In operation, the atherectomy device removes plaque by a sanding action which creates a slurry of particulates. These particulates are entrained in the fluid flowing in the artery. The resulting trajectories of the particulates are of significant relevance with regard to possible blockage of downstream branches, particle agglomeration within the fluid, or accumulation on blood vessel walls.
These issues have been investigated by a systematic approach whose starting point was a paired experimental—numerical simulation activity whose end result demonstrated the validity of the numerical simulation model. The model was then applied to a variety of particulate transport situations in order to determine the presence or absence of deleterious consequences. In particular, both possible agglomeration and accumulation were evaluated. These evaluations were enhanced by means of related experiments. The most demanding of the investigated situations was the modeling of a particle-laden flow through an actual physiological artery geometry with numerous branches. This problem was analyzed by means of numerical simulation with the objective of predicting the outflows from the main artery to each of the branches. These predictions were found to be in excellent agreement with experimental information from the literature.
It was found that agglomeration was fully absent while accumulation only occurred under special conditions. The passage of particulates through passages appears to give rise to a particle-size sorting. The degree of sorting was evaluated by scanning electronic microscopy methods. Finally, it is found that the particles are predisposed to travel through upstream branches rather than downstream to the near-foot branches.
It is hoped that the results from this study will form a knowledgebase which can be used in the application of atherectomy devices for treating peripheral arterial disease. The methods developed here can be used to predict the ultimate destination of particles which are formed during this procedure. The method may be useful in designing patient-specific therapies and in prediction regions in a specific patient’s anatomy where accumulation might occur.
A number of limitations must be remembered when these results are considered. First, the results shown here are reflective of the flow patterns in a single-patient artery. Second, the results do not include the pulsatile fluctuation in blood flow which occurs within a living human. Also, non-Newtonian effects are not included in the simulations. Finally, the outlet boundary conditions reflect a uniform pressure setting. In an in vivo setting, the pressure at the artery exit locations would likely differ. Despite these limitations, the method has been shown to faithfully reproduce particle trajectories which were observed in an experimental setting. The simulations also show regions where wall accumulation will occur, if it does so at all. Finally, the simulations can be used to predict the trajectories of particles downstream of the treatment site.
NOMENCLATURE
- a
= Turbulence model constant
- CD
= Drag coefficient
- d
= Diameter, [m]
= Force vector [N]
- F1, F2
= Blending functions in the turbulence model
= Gravitational acceleration vector [m s-2]
- k
= Turbulent kinetic energy, [m2 s-2]
- Ldown
= Tube length downstream of bend, [m]
- Lup
= Tube length upstream of bend, [m]
- m
= Mass [kg]
- p
= Pressure, [Pa]
- P
= Model production term
- rc
= Radius of curvature, [m]
- S
= Absolute value of the shear strain rate, [s-1]
- u
= Fluid velocity component, [m s-1]
= Vector representation of velocity, [m s-1]
- x
= Streamwise coordinate, [m]
Greek
- α
= Turbulence model constant
- β1, β2
= Turbulence model constants
- ω
= Specific rate of turbulence dissipation, [s-1]
- µ
= Viscosity, [kg m-1 s-1]
- ρ
= Density, [kg m-3]
- σ
= Prandtl-number-like diffusion parameters
Subscripts
- buoyancy
= Buoyancy force
- drag
= Drag force
- f
= Fluid
- i,j
= Tensor indices
- p
= Particle
- pressure
= Force caused by pressure gradient
- slip
= Slip velocity
- t
= Turbulent
REFERENCES
- 1.Tang B C, Dawson M, Lai S K, Wang YY, Suk J S, Yang M, Zeitlin P, Boyle M P, Fu J, Hanes J. “Biodegradable polymer nanoparticles that rapidly penetrate the human mucus barrier”. U.S. Proc. Nat. Acad. Sci. 2010;106:19268–73. doi: 10.1073/pnas.0905998106. [DOI] [PMC free article] [PubMed] [Google Scholar]
- 2.Zheng X, Kan B, Gou M, Fu S, Zhang J, Men K, Chen L, Luo F, Zhao Y, Zhao X, Wei Y, Qian Z. “Preparation of MPEG-PLA nanoparticle for honokiol delivery in vitro”. Int. J. Pharm. 2010;386:262–7. doi: 10.1016/j.ijpharm.2009.11.014. [DOI] [PubMed] [Google Scholar]
- 3.Harris T J, Green J J, Fung P W, Langer R, Anderson D G, Bhatia S N. “Tissue-specific gene delivery via nanoparticle coating”. Biomaterials. 2010;31:998–1006. doi: 10.1016/j.biomaterials.2009.10.012. [DOI] [PMC free article] [PubMed] [Google Scholar]
- 4.Schaafsma S H, Vonk P, Kossen NWF. “Fluid bed agglomeration with a narrow droplet size distribution”. Int. J. Pharm. 2000;193:175–87. doi: 10.1016/s0378-5173(99)00329-4. [DOI] [PubMed] [Google Scholar]
- 5.Dukowicz J K. A particle-fluid numerical model for liquid sprays”. J. Comput. Phys. 1980;35:229–53. [Google Scholar]
- 6.Chawla J M. “Effect of the droplet agglomeration on the design of spray dryer towers”. Dry. Technol. 1994;12:1357–65. [Google Scholar]
- 7.Pratsinis S E, Vemury S. “Particle formation in gases: a review”. Powder Technol. 1996;88:267–73. [Google Scholar]
- 8.Ho C A, Sommerfeld M. “Modeling of micro-particle ag-glomeration in turbulent flows”. Chem. Eng. Sci. 2002;57:3073–84. [Google Scholar]
- 9.Johnson A A, Tezduyar T E. “3D simulation of fluid-liquid interactions with the number of particles reaching 100”. Comp. Methods Appl. Mech. Eng. 1997;145:301–21. [Google Scholar]
- 10.Nakaoka T, Taniguchi S, Matsumoto K, and. Johansen S. T “Particle-size grouping method of inclusion agglomeration and its application to water model experiments”. ISIJ Int. 2001;41:1103–11. [Google Scholar]
- 11.Pan Y, Banarjee S. “Numerical simulation of particle interactions with wall turbulence”. Phys. Fluids. 1996;8:2733–55. [Google Scholar]
- 12.Mikami T, Kamiya H, Horio M. “Numerical simulation of cohesive powder behavior in a fluidized bed”. Chem. Eng. Sci. 1998;53:1927–40. [Google Scholar]
- 13.Sparrow E M, Tong J C K, Abraham J. “Fluid flow in a system with separate laminar and turbulent zone”. Numer. Heat Transfer A. 2008;53:341–53. [Google Scholar]
- 14.Menter F. “Two-equation eddy-viscosity turbulence models for engineering applications”. AIAA J. 1994;32:1598–605. [Google Scholar]
- 15.Schiller L, Naumann Z. “A drag coefficient correlation”. Z. Ver. Deutsch. Ing. 1935;77:318. [Google Scholar]
- 16.Rhie W C, Chow W L. “A numerical study of the turbulent flow past an isolated airfoil with trailing edge separation”. AIAA paper no. 1982:82–0998. [Google Scholar]
- 17.Majumdar S. “Role of underrelaxation in momentum interpolation for calculation of flow with nonstaggered grids”. Numer. Heat Transf. 1988;13:125–32. [Google Scholar]
- 18.Barth T J, Jesperson D C. “The design and applications of upwind schemes on unstructured meshes”. AIAA paper no. 1989:89–0366. [Google Scholar]
- 19.Fronek A, Coal M. “Quantitative ultrasonographic studies of lower extremity flow velocities in health and disease”. Circulation. 1976;53:957–60. doi: 10.1161/01.cir.53.6.957. [DOI] [PubMed] [Google Scholar]
- 20.Holland C, Brown J M, Scott L M, Taylor K J W. “Lower extremity volumetric arterial blood flow in normal subjects”. Ultrasound Med. Biol. 1998;24:1079–86. doi: 10.1016/s0301-5629(98)00103-3. [DOI] [PubMed] [Google Scholar]


