Abstract
It remains a critical issue to improve the survival rate in patients with recurrent or metastatic breast cancer. This study sought to develop a prognostic scheme based on a 28-gene signature in a broad patient population, including those with advanced disease. Clinically annotated transcriptional profiles of 1,734 breast cancer patients were obtained to validate the 28-gene signature in prognostic categorization. The 28-gene signature generated significant patient stratification with regard to breast cancer disease-free survival (log-rank P < 0.0001; n = 1,337) and overall survival (log-rank P < 0.0001; n = 806) in Kaplan-Meier analyses. The gene expression signature provides refined prognosis of disease-free survival (log-rank P < 0.006; Kaplan-Meier analysis) within each classic clinicopathologic factor-defined subgroup, including LN-, LN+, ER-, ER+, and tumor Grade II. Furthermore, it was investigated whether this gene signature predicts chemoresponse to drugs commonly used to treat breast cancer. The mRNA expression levels of this gene signature in NCI-60 cell lines were used to predict chemoresponse to CMF, Tamoxifen, Paclitaxel, Docetaxel, and Doxorubicin (Adriamycin). The 28-gene prognostic signature accurately (P < 0.02) predicted chemotherapeutic response to the studied drugs. This study confirmed the prognostic applicability of the breast cancer gene signature in a broad clinical setting. This prognostic signature is also predictive of drug response in cancer cell lines.
Keywords: gene signature, breast cancer prognosis, chemosensitivity prediction, NCI-60 cell lines
Introduction
Breast cancer is a complex and heterogeneous disease encompassing a wide variety of pathological entities, clinical behaviors, and molecular changes. Patients with the same disease stage or histopathology classification may have remarkably different clinical outcome and response to various therapies. During the past decades, the overall risk of mortality due to breast cancer has been declining with earlier detection and the development of advanced therapies (1). However, the survival rate has not been substantially improved for patients with recurrent or metastatic breast cancer (2). One of the main obstacles to improve the survival rate is to accurately predict the risk for recurrence in breast cancer patients after initial treatments. High-risk patients should be considered for more aggressive therapy. Following this, another essential issue in clinics is to predict the predisposition to certain chemotherapeutic agents in individual patients.
Substantial efforts have been made to establish the prognostic factors for patients with breast cancer during the last two decades. Traditional prognostic factors are lymph node status, tumor size, histologic type, histologic grade, lymphatic vessel invasion, and hormone receptor status (3). With the development of molecular biology and cell biology, many new prognostic factors have been proposed, including markers that regulate cell cycle, cell death, Her2/neu, markers of metastasis or metastatic process, lymph node micrometastases, bone marrow micrometastases, and markers of angiogenesis (4). Recent advances in DNA microarrays have fostered tremendous advances in molecular diagnosis and prognosis of breast cancer (5-19). Gene expression-based signatures such as MammaPrint (13;19) and Oncotype DX (9) have been applied in clinics for more refined prognosis in early stage breast cancer patients. Breast cancer patients with advanced stages generally receive chemotherapy, but only about half of them benefit from it (20). It remains a critical challenge to identify patients at high-risk for recurrence after primary chemotherapy. These high-risk patients should be considered for second-line chemotherapy. A population-based prognostic gene signature is needed for devising more rational treatment options in breast cancer treatment.
In a previous study, we identified a 28-gene signature from an unselected population of 99 lymph node negative and positive breast cancers obtained from Sotiriou et al. (12), and validated this gene signature in additional 153 patients for prognostic prediction of breast cancer recurrence and metastasis (21). To demonstrate the clinical applicability of this gene signature, a consistent prognostic categorization scheme needs to be designed for gene expression profiles generated from current DNA microarray platforms. This stratification scheme was developed by using a nearest centroid method and comprehensively evaluated in seven independent breast cancer patient cohorts (n = 1,734) in this study. The association between the gene signature and traditional breast cancer prognostic factors was assessed in the prediction of disease-free survival and overall survival.
Next, we sought to explore whether this prognostic gene signature is also predictive of chemoresponse to drugs commonly used for treating breast cancer. The studies assessing treatments are typically carried out in patients with advanced disease, who do not routinely undergo surgery. Therefore, it raises tremendous logistical issues to implement the (unbiased) genome-wide association studies using tissue samples for predicting treatment responses (22). As an alternative strategy, preclinical models such as cell line or animal models are used for searching predictive gene expression signatures and then validate them in clinics, thereby reducing the number of patients required for tissue collection. In this study, we used a panel of 60 cancer cell lines (NCI-60) to evaluate whether the 28-gene signature can accurately predict chemosensitivity/resistance to CMF, Tamoxifen, Paclitaxel, Docetaxel, and Doxorubicin (Adriamycin). Furthermore, gene markers that showed significant differential mRNA expression between sensitive and resistant beast cancer cells lines were identified for each drug.
Materials and Methods
Patient samples
Seven breast cancer patient cohorts were analyzed in this study. These datasets include patients from Bild et al. (5) (n = 158; GEO accession number: GSE3143), Sorlie et al. (23) (n = 117; GEO accession number: GSE4335), Wang et al. (14) (n = 286; GEO accession number: GSE2034), Van de Vijver et al. (13) (n = 295), Miller et al. (17) (n = 236; GEO accession number: GSE3494), Loi et al. (24) (n = 393; GEO accession number: GSE6532), and Ivshina et al. (25) (n = 249; GEO accession number: GSE4922). Patient cohorts from van de Vijver et al. (13), Sorlie et al. (23), Wang et al. (14), Ivshina et al. (25), and Loi et al. (24) had recorded disease-free survival (either relapse-free survival and/or metastasis-free survival). Patient cohorts from van de Vijver et al. (13), Sorlie et al. (23), Bild et al. (5), and Miller et al. (17) had recorded overall survival information. A more detailed description of each patient cohort is provided in Appendix (http://www.hsc.wvu.edu/mbrcc/fs/GuoLab/publications.asp).
Nearest shrunken centroid classification
Nearest shrunken centroid method is an efficient classification algorithm. This algorithm categorizes an unknown instance to the class whose centroid is closest to it. It considers the centroid of the cluster as a representative of the class. The learnt distance function is used to determine the closest centroid (26). For cases involving two classes, the nearest centroid algorithm is linear and implicitly encodes a threshold hyperplane that separates the two classes (27).
Specifically, the arithmetic mean of a class Cj represents the prototype pattern (i.e., the average gene expression profiles of each signature gene in the training centroid) for the class and is denoted by
where xi represents the training samples that belong to the class Cj. Using this algorithm, a class label of an unknown instance x is predicted as:
where d(x,y) denotes the distance function (27).
The distance function measures the strictness of dependence between the two vectors (28). In this study, Pearson's correlation was used as the distance measure in nearest centroid classification. Pearson's correlation provides the degree of linear dependence of vectors x and w by
where μx and μw are the respective means of the vectors x (gene expression signature in the training centroid) and w (gene expression signature in a test sample). The equation is standardized by the multiplication of the standard deviations of the vectors after subtracting their respective means. This causes the Pearson's correlation to be invariant (28).
This method is usually preferred in biological applications because of its favorable invariance properties, i.e., the correlation between the variables is not affected by an addition of a constant offset to the components of the data or by applying a multiplicative factor (28). This is especially appealing to the classification based on DNA microarray data, where heterogeneous array platforms pose a challenge to cross-cohort and cross-experiment validation.
Validation of the 28-gene expression signature in multiple DNA microarrays
The validation sets used in this study contain a variety of DNA microarray platforms, including cDNA microarrays, Affymetrix U95, U133A, and U133 plus 2.0. The recorded clinical endpoints include relapse-free survival (RFS), metastasis-free survival (MFS), disease-free survival (DFS; here a clinical event refers to either a local recurrence or distant metastasis of breast cancer), disease-specific survival (DSS; an event is death from beast cancer), and overall survival (OS).
The training cohort obtained from Sotiriou et al. (12) was partitioned into good-prognosis and poor-prognosis groups based on patient survival information recorded in the clinical data. A patient was defined with good-prognosis if the patient survived longer than five years after the primary treatment; otherwise, the patient was defined with poor-prognosis. The average expression profiles of the signature genes in both groups were computed for the training set. These constituted the training centroids of good-prognosis and poor-prognosis for future prognostic categorization in a new patient. A nearest centroid classification method (13) was used to predict clinical outcome in each patient from the validation sets. Pearson's correlation coefficient was used as the metrics for classifying a new instance (patient) into the closest centroid.
In the validation cohorts, the prognostic categorization was based on the correlation of each patient's gene expression profile and the average good-prognosis centroid in the training set. A patient was classified into the good-prognosis group if the correlation with the good-prognosis training centroid was greater than the corresponding cutoff value; otherwise, this patient was classified into the poor-prognosis group. If there are multiple probes for the same annotated signature gene, the average expression of all the probes was used in the correlation analysis. Since the validation sets contain DNA microarray data generated on heterogeneous platforms, different cut-off values were chosen in patient stratification. Each cutoff value was validated by at least two independent cohorts.
Statistical analysis
A heat map of the 28-gene signature on the good-prognosis training centroid of patients from Sotiriou et al (12) was generated with CIMminer (29) based on Euclidean distance matrix with complete linkage (http://discover.nci.nih.gov/cimminer/index.jsp).
Patient survival rates were assessed with Kaplan-Meier analysis using log-rank tests. Associations between the gene expression signature and clinicopathologic parameters were evaluated with two-sided chi-square tests. All statistical analyses were performed with software package R (30).
Transcriptional Profiles in NCI-60 Cell Panel
Genome-wide mRNA expression profiles in NCI-60 cell lines (31) were retrieved with CellMiner (http://discover.nci.nih.gov/cellminer). The data were generated on Affymetrix U133A and normalized with the GCRMA method (32). The signature genes were identified from the data file with gene symbols or UniGene Cluster IDs (for unknown genes).
Drug activity profiles in NCI-60
The drug activity data in NCI-60 were retried from Developmental Therapeutic Program at NCI/NIH through DTP Data Search (http://dtp.nci.nih.gov/dtpstandard/dwindex/index.jsp). The latest screening results for each studied drug was used in the analysis. Growth inhibition was assessed from the changes in total cellular protein after 48 hours of drug treatment using a sulphorhodamine B assay. Drug activities (log10 GI50) were recorded across the 60 human cancer cell lines. GI50 is the concentration required to inhibit cell growth by 50% compared with untreated controls. The activity profile of an agent consists of 60 such activity values, one for each cell line.
Defining Drug Sensitivity and Resistance
Drug activity data of CMF (Cyclophosphamide, Methotrexate, and Fluorouracil 5FU), Tamoxifen, Paclitaxel, Docetaxel, and Doxorubicin (Adriamycin) was processed to define drug resistance and sensitivity of the NCI-60 lines as described before (33;34). Specifically, for each drug, log10 (GI50) values were normalized across the 60 cell lines. Cell lines with log10 (GI50) at least 0.5 SDs above the mean were defined as resistant to this drug. Those with log10 (GI50) at least 0.5 SDs below the mean were defined as sensitive to the drug. The remaining cell lines with log10 (GI50) within 0.5 SDs were defined as intermediate in the range of drug responses. The log10 (GI50) values of Cyclophosphamide (Cytoxan) had little variation in NCI-60 cell lines. There was no resistant cell line to Cytoxan.
Classification of chemosensitivity/resistance
The mRNA expression profiles of the 28-gene breast cancer signature were used to predict chemosensitivity/resistance in the cancer cell lines. For each drug, only sensitive and resistant cell lines were included in the analysis, while those with intermediate response were excluded from classification. A k-nearest neighbor method was used to classify chemoresponse to Methotrexate, Fluorouracil (5FU), Paclitaxel, and Docetaxel. Neural network was used to classify drug response to Tamoxifen. Threshold Selector, choosing a mid-point threshold on the probability output by logistic regression, was used to in classifying chemoresponse to Doxorubicin (Adriamycin). The classification results were evaluated with a leave-one-out cross validation. These algorithms were implemented in WEKA 3.4 (35). No classifier was constructed for Cytoxan, because no cell lines in the NCI-60 panel were resistant to it.
Differential expression analysis in resistant and sensitive breast cancer cell lines
Using the average expression values of each gene on the breast cancer cell lines in the NCI-60 panel, fold change of the gene expression in resistant cell lines versus sensitive cell lines was computed as follows:
Where Resistant_Mean is the mean expression of the group of resistant cell lines; Sensitive_Mean is the mean expression of the group of sensitive cell lines. In this study, value 1.5 (1.5 for over-expressed and 0.67 for under-expressed) is the threshold used in deciding if a gene is expressing differently.
Statistical significance of the fold change is computed using two-tail, unequal variance two-sample t-tests. It's considered statistically significant if the p-value is ≤ 0.05. However, in cases where there is only one cell line falls into one of the response group where two-sample t-tests fail, the fold change is considered statistically significant if the expression value of the gene for that cell line does not fall into the 95% confidence interval of the other group. The confidence interval of the group with more than one cell lines is computed by:
where n is the number of cell lines falls into that response group and t is the critical-t value for two-tail t-tests on 95% confident with n-1 degree of freedom.
Results
A general patient stratification scheme for current DNA microarray platforms
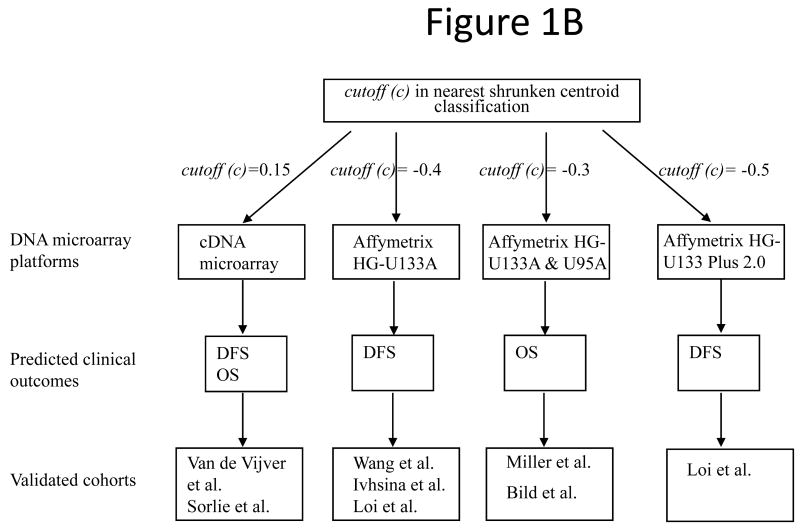
Previously (21), the 28-gene signature was identified from Sotiriou et al. (12) and was validated in two patient cohorts from Sorlie et al. (11) and van't Veer et al. (19). In this study, seven independent cohorts containing 1,734 breast cancers (5;13;14;17;23-25) were obtained to design a consistent patient stratification scheme using this prognostic gene signature. In these cohorts, diagnosis ranged from early stage (T1/T2) to advanced stage (T3/T4). To develop prognostic categorization for individual patients in these validation sets, a nearest centroid classification scheme (13) was designed based on the correlation between a new patient gene expression profile and the good-prognosis centroid of the training cohort from Sotiriou et al (12) (Fig. 1A). Compared with algorithms such as neural networks, random forests, and Bayesian methods, the nearest centroid method is more robust to the discrepancy of quantification scales and inconsistency of probe sets from different microarray platforms during cross-cohort validation. A detailed algorithms comparison is included in a thesis (http://www.hsc.wvu.edu/mbrcc/fs/GuoLab/pdfs/Shruti_Rathnagiriswaran_Thesis.pdf). During the nearest centroid classification, since the validation cohorts contain data generated from diverse DNA microarray platforms and contained different clinical endpoints, specific cutoff values based on the Pearson's correlation with the good-prognosis training centroid were identified for the corresponding experimental platforms and predicted clinical endpoints. To avoid over-fitting, each cutoff value was consistently validated in multiple patient cohorts, except for one cutoff defined for predicting relapse-free survival in patients from Loi et al. (24). Specifically, in predicting disease-free survival (DFS; including relapse-free survival and metastasis-free survival) and overall survival (OS) on samples quantified with cDNA microarray [van de Vijver et al. (13) and Sorlie et al. (23)], a patient was classified into the good-prognosis group if the correlation between the patient gene expression profile and the good-prognosis training centroid was greater than 0.15; otherwise, the patient was classified into poor-prognosis group. In predicting overall survival on samples quantified with Affymetrix HG-133A [Miller et al. (17)] and Affymetrix HG-U95 [Bild et al. (5)], a patient was classified into the good-prognosis group if the correlation between the patient gene expression profile and the good-prognosis training centroid was greater than -0.3; otherwise, the patient was classified into poor-prognosis group. In predicting disease-free survival based on gene expression quantified with Affymetrix chips, cutoff values were determined for different platforms as follows: -0.4 for Affymetrix HG-U133A [Wang et al. (14), Ivshina et al. (25), and Loi et al.(24)], and -0.5 for Affymetrix U133 Plus 2.0 Array [Loi et al. (24)] (Fig. 1B).
Figure 1.
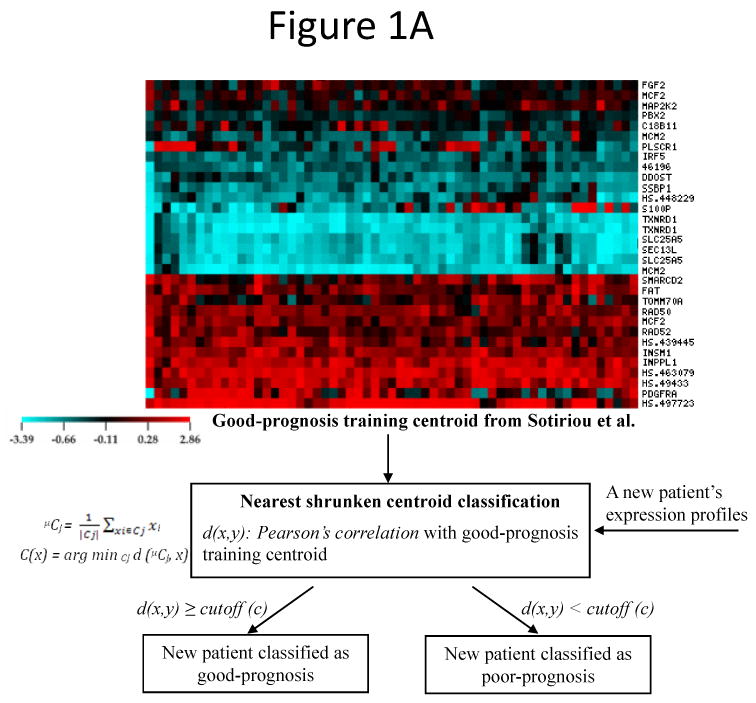
The general patient stratification scheme based on the 28-gene breast cancer signature quantified on current DNA microarray platforms. (A) Nearest shrunken centroid classification method stratified each new patient in the validation sets into good- or poor-prognosis group based on the Pearson's correlation between the patient's gene expression profiles and the good-prognosis training centroid from Sotiriou et al (12). (B) Specific cutoff values of the distant function in nearest centroid classification. Different cutoff values were determined for different DNA microarray platforms and predicted clinical outcomes. Each stratification scheme was validated in multiple published cohorts. DFS: disease-free survival; OS: overall survival.
Based on the nearest centroid classification schemes, the 28-gene signature stratified individual patients in each validation cohort into either good- or poor-prognostic group with distinct disease-free survival (log-rank P < 0.05) and overall survival (log-rank P < 0.036) in Kaplan-Meier analyses (Appendix; Suppl. Figs 1-7). When all patient cohorts were combined together, the gene expression-defined good- and poor-prognosis groups had significantly different disease-free survival (log-rank P < 0.0001; n = 1,337) and overall survival (log-rank P < 0.0001; n = 806) (Fig. 2). These results demonstrated that the 28-gene breast cancer prognostic signature has general clinical applicability for multiple DNA microarray platforms.
Figure 2.
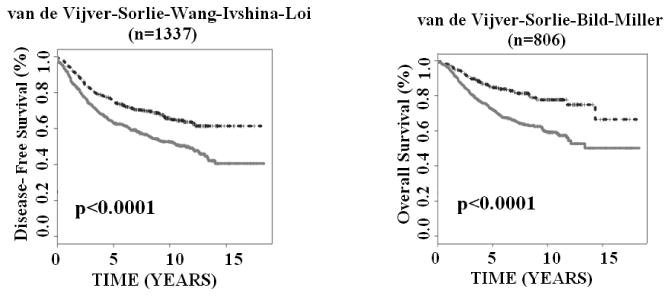
The 28-gene signature predicted breast cancer disease-free survival and overall survival in Kaplan-Meier analysis. The studied patient cohorts were stratified as either good-prognosis (upper curves) or poor-prognosis (lower curves) and were combined in the analysis. The survival probabilities of two prognostic groups were assessed with log-rank tests.
Association between the 28-gene breast cancer signature and clinicopathological factors
The association between the 28-gene expression-defined prognostic groups and patient age, lymph node status, ER status, and tumor grade was assessed with two-sided chi-square tests. The results showed that the breast cancer gene signature was significantly associated with patient age (P = 0.019), lymph node status (P = 6.6e-10), ER status (P = 0.0013), and tumor grade (P = 9.8e-14) in predicting disease-free survival (n = 1,337; Appendix; Suppl. Table 2). The prognostic gene signature was significantly associated with ER status (P = 0.0037) and tumor grade (P = 8.5e-13) in predicting breast cancer overall survival (n = 806). The association was not significant between the breast cancer gene signature and patient age (P = 0.55) or lymph node status (P =0.29) in terms of breast cancer overall survival (Appendix; Suppl. Table 3).
The 28-gene signature provides refined prognosis to traditional factors
Lymph node metastasis, estrogen receptor (ER) status, and tumor grade are important prognostic factors of breast cancer. This study sought to investigate whether the 28-gene signature could provide refined prognosis in addition to these traditional factors. First, all lymph node negative patients from the studied cohorts were combined for Kaplan-Meier analysis. Based on the prognostic categorization described in the above section, the 28-gene signature further stratified node negative patients into subgroups with distinct disease-free survival (log-rank P = 0.0029; n = 870) and overall survival (log-rank P = 0.0001; n = 334; Fig. 3A). Similarly, the 28-gene signature further stratified node positive patients into subgroups with distinct disease-free survival (log-rank P < 0.0001; n = 444) and overall survival (log-rank P = 0.0008; n = 300; Fig. 3B).
Figure 3.
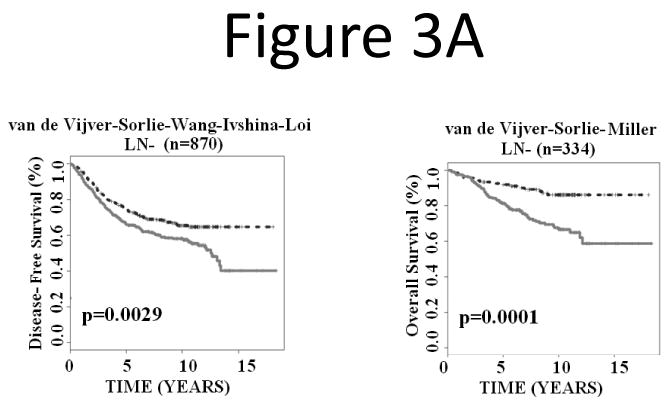
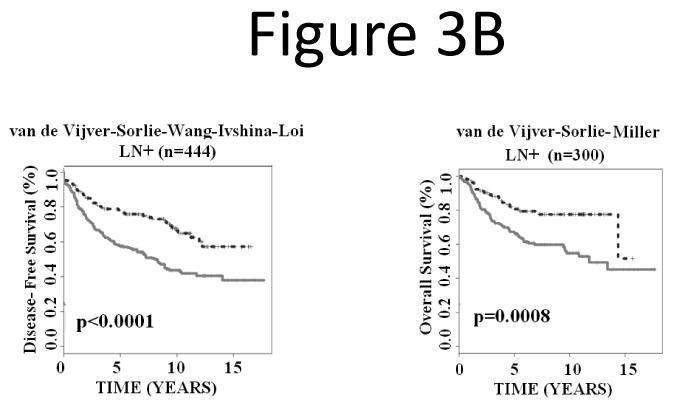
The 28-gene signature stratified subgroups defined by lymph node status in predicting breast cancer disease-free survival and overall survival using Kaplan-Meier analyses. The breast cancer gene signature further partitioned lymph node negative (A) and positive (B) patients into distinct prognostic subgroups, respectively.
Next, we investigated whether the signature could refine positive and negative estrogen receptor (ER+ and ER-) groups. The results showed that the prognostic gene signature partitioned ER+ breast cancers into subgroups with distinct disease-free survival (log-rank P < 0.0001; n = 1,075) and overall survival (log-rank P < 0.0001; n = 618; Fig. 4A). In ER- breast cancer patients, the gene expression-defined subgroups also showed significantly different disease-free survival (log-rank P = 0.0062; n = 248) and borderline different overall survival (log-rank P = 0.06; n = 179; Fig. 4B).
Figure 4.
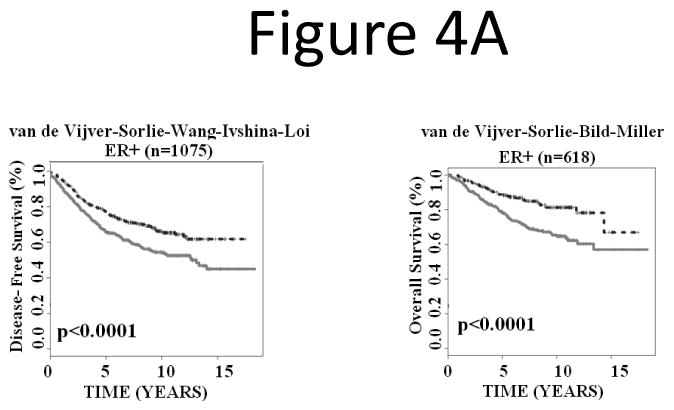
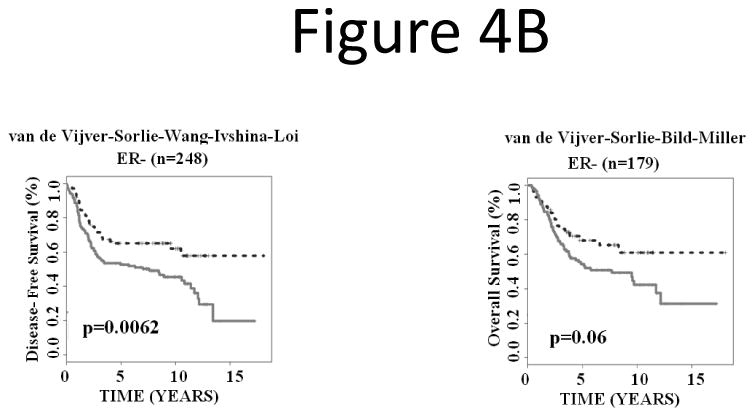
The 28-gene signature stratified subgroups defined by ER status in predicting breast cancer disease-free survival and overall survival using Kaplan-Meier analyses. The breast cancer gene signature further partitioned ER+ (A) and ER- (B) patients into distinct prognostic subgroups, respectively.
Finally, we explored whether the 28-gene signature could further stratify Grade II breast cancers, which are more challenging in prognosis than Grade I or Grade III tumors. Kaplan-Meier analyses showed that the gene expression-defined risk groups within Grade II breast cancers had divergent disease-free survival (log-rank P = 0.0197; n = 327) and overall survival (log-rank P = 0.0024; n = 270; Fig. 5). Overall, these results demonstrated that the 28-gene breast cancer signature provides independent prognostic information within subgroups defined by lymph node status, ER status, and tumor grade.
Figure 5.
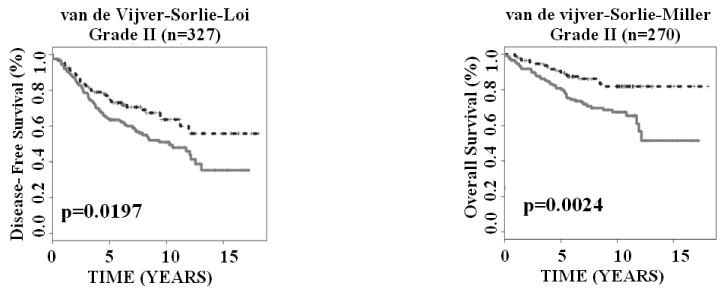
The 28-gene signature generated significant prognostic categorization in predicting disease-free survival and overall survival for Grade II breast cancers in Kaplan-Meier analyses.
The 28-gene signature predicts chemoresponse in NCI-60 cell lines
After substantiating the clinical relevance of the 28-gene signature in predicting breast cancer disease-free survival and overall survival, we sought to explore whether the signature can predict chemoresponse to anti-breast cancer agents, including CMF, Tamoxifen, Paclitaxel, Docetaxel, and Doxorubicin (Adriamycin). Here, the NCI-60 cell lines, regardless of tissue origin, were used in the study. For each drug, cancer cell lines that are either sensitive or resistant to the drug were included to build a chemoresponse classifier based on the 28-gene expression profiles in the cell lines. The performance of the classifier was evaluated with leave-one-out cross validation (Table 1). The overall prediction accuracy of chemoresponse was 90.6% (P < 0.0004) for Tamoxifen, 82.4% (P < 0.005) for Fluorouracil (5FU, part of CMF), 73.3% (P < 0.02) for Methotrexate (part of CMF), 92.3% (P < 0.0008) for Paclitaxel, 89.2% (P < 0.0002) for Doxorubicin, and 88.2% (P < 0.0007) for Docetaxel. These results demonstrated that the 28-gene signature accurately predicted sensitivity and resistance to common breast cancer chemotherapy in cancer cell lines.
Table 1.
Prediction accuracy of chemosensitivity/resistance in NCI-60 cell lines using 28-gene breast cancer prognostic signature. A P-value < 0.05 represents the overall accuracy is significantly higher than that of random prediction (two-sided Z-tests).
| Drug name | Sensitivity (chemoresistance) |
Specificity (chemosensitivity) |
Overall Accuracy | P Value |
|---|---|---|---|---|
| Tamoxifen | 94.4% (17/18) | 85.7% (12/14) | 90.6% (29/32) | 0.0004 |
| Fluorouracil (5FU; part of CMF) | 76.5% (13/17) | 88.2% (15/17) | 82.4% (28/34) | 0.005 |
| Methotrexate (part of CMF) | 60.0% (12/20) | 84.0% (21/25) | 73.3% (33/45) | 0.02 |
| Paclitaxel (Taxol) | 86.7% (13/15) | 100% (11/11) | 92.3% (24/26) | 0.0008 |
| Doxorubicin (Adriamycin) | 100% (19/19) | 77.8% (14/18) | 89.2% (33/37) | 0.0002 |
| Docetaxel | 94.4% (17/18) | 81.3% (13/16) | 88.2% (30/34) | 0.0007 |
The differential expression in sensitive and resistance breast cancer cell lines was analyzed for each signature gene. The drug responses of the breast cancer cell lines in the NCI-60 panel were provided in Appendix (Suppl. Table 4). As there was no breast cancer cell line showing resistance to Docetaxel, this drug was not included in the analysis. Among the signature genes, the over-expression of TOMM70A and PLSCR1 was linked to chemoresistance to all the studied drugs in the breast cancer cell lines; whereas the over-expression of MCF2 and IGHA1 was associated with chemosensitivity to all the studied drugs in breast cancer cell lines. The over-expression of TXNRD1, FAT, and FGF2 was observed in resistance to 5FU, Methotrexate, Tamoxifen, and Doxorubicin, but was associated with sensitivity to Paclitaxel. MCM2 and S100P also showed similar expression patterns in drug responses. Their over-expression was associated with chemoresistance to Paclitaxel (P < 0.05), and chemosensitivity to Tamoxifen (Fig. 6).
Figure 6.
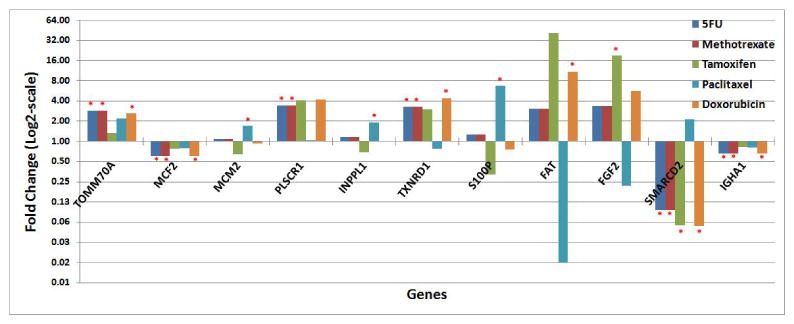
Signature genes with significant differential expression in sensitive and resistant breast cancer cell lines for the studied anti-cancer agents. Fold change represents the gene expression ratio in resistant versus sensitive breast cancer cell lines. In the graph, statistically significant differential expression is marked by a red asterisk (*).
Discussion
Predicting the risk for recurrence and treatment response for patients with advanced disease remains a critical issue in clinics. Patients at high risk for recurrence after the primary treatment should be considered for more aggressive chemotherapy, whereas second-line chemotherapy may not be necessary in low-risk patients. The FDA recently approved the first gene test for cancer, MammaPrint of Agendia (Amsterdam, The Netherlands) (19), for use in lymph node-negative women under age 61 and with a tumor size less than 5 cm. Oncotype DX of Genomic Health (Redwood City, CA) is a clinically applied multigene assay to predict recurrence of tamoxifen-treated, node-negative, and estrogen receptor-positive breast cancer (9). Both Oncotype and MammaPrint target early stage breast cancer patients. New gene signatures are needed for predicting breast cancer recurrence in broader clinical settings.
In a previous study (21), we presented a population-based approach to predicting recurrence and metastases of breast cancer by using gene expression patterns in tumors obtained from Sotiriou et al (12). The external validation sets used in this study consist of completely independent patient cohorts. The prognostic prediction based on the 28-gene signature employed the “gold standard” of validation schemes, i.e., an independent training set and a validation in multiple, non-overlapping datasets. Specific cutoff values were identified for multiple experimental platforms and clinical outcomes using a nearest centroid classification method. All cutoff schemes except one were consistently validated on multiple breast cancer patient cohorts. The 28-gene signature was confirmed to predict disease-free survival and overall survival in individual breast cancer patients (n =1,734). These results showed that the stratification scheme could be applied to predicting clinical outcomes in a new breast cancer patient based on the 28-gene expression profiles measured on various commonly used microarray platforms.
Fan et al. (36) compared five breast cancer signatures, including Oncotype DX (9), MammaPrint® (13;19), wound response predictor (6), intrinsic subtypes (10;11;23), and the “two-gene ratio” (8) using the cohort from van de Vijver et al (13). This comparison represents an entirely independent test set only for Oncotype DX and the “two–gene ratio”, whereas the remaining three signatures used part of the samples from van de Vijver's cohort (n = 295) in model development. If the training samples were removed for testing these three signatures, the resulting test dataset would be greatly reduced to fewer than 147 samples and possibly as few as 72 samples (36). In this evaluation, all five signatures except the two-gene ratio allowed for prognostic categorization with respect to disease-free survival (log-rank p < 0.001) and overall survival (log-rank p < 0.001). Compared with these results in consideration of the bias toward MammaPrint®, intrinsic subtypes, and wound response predictor, our 28-gene prognostic signature is comparable as Oncotype DX and could potentially be more accurate than the other signatures in terms of predicting disease-free survival and overall survival in van de Vijver's cohort (Appendix; Suppl. Figure 1). More importantly, the 28-gene breast cancer signature showed prognostic ability beyond early stage breast cancer. The 28-gene prognostic signature quantified disease-free survival and overall survival in a broad patient population including those with advanced stage (T3/T4), tumor grade III, lymph node metastasis, or negative estrogen receptor status (ER-).
According to the REMARK guidelines (37;38), cancer prognostic studies must demonstrate whether tumor markers provide information independent of traditional criteria or provide prognostic information within subgroups defined by traditional criteria. This study demonstrated that the breast cancer gene signature could refine prognosis within each subgroup defined by lymph node status (node positive or negative), tumor grade (patients with Grade II), and ER status (ER+ or ER-). These results indicated that the 28-gene signature provides independent prognostic information in addition to the traditional factors.
The prognostic categorization will address one clinically important issue, i.e., who should receive more aggressive chemotherapy? Following this, another unresolved issue is which chemotherapy should be given to a specific patient? Breast cancer patients with the same tumor stage may have remarkably different response to a chemotherapeutic agent. This study demonstrated that the 28-gene prognostic signature was also predictive of chemoresponse in cancer cell lines. Since each NCI-60 cell line was derived from a clinical tumor and the gene expression was measured in untreated cell lines, this finding has important clinical implications in predicting a patient's predisposition to certain chemotherapy based on her molecular tumor characteristics, in addition to the tumor stage. This would help physicians to design optimal treatment strategies by including drugs within the sensitive range of this patient in personalized therapy.
In summary, this study developed a scheme for applying a 28-gene signature in patient stratification based on transcriptional profiles generated on a diverse range of microarray platforms. The signature predicts a poor outcome in breast cancer patients with early stage as well as advanced disease. This is significant in the clinical management of breast cancer, because this molecular classification scheme may help physicians to identify high-risk patients who might need additional or more aggressive chemotherapy after the primary treatment. Furthermore, this prognostic gene signature is also predictive of chemoresponse to CMF, Tamoxifen, Paclitaxel, Docetaxel, and Doxorubicin (Adriamycin) in cancer cell lines, which could potentially be used to predict patient predisposition to chemotherapy.
Acknowledgments
This work is supported by the NIH/NCRR P20 RR16440-03 (Dr. Guo). We thank Dr. James Denvir for discussion in statistical analysis.
Footnotes
Disclaimer: The findings and conclusions in this report are those of the author(s) and do not necessarily represent the views of the National Institute for Occupational Safety and Health.
References
- 1.Peto R, Boreham J, Clarke M, Davies C, Beral V. UK and USA breast cancer deaths down 25% in year 2000 at ages 20-69 years. Lancet. 2000;355:1822. doi: 10.1016/S0140-6736(00)02277-7. [DOI] [PubMed] [Google Scholar]
- 2.Giordano SH, Buzdar AU, Smith TL, et al. Is breast cancer survival improving? Cancer. 2004;100:44–52. doi: 10.1002/cncr.11859. [DOI] [PubMed] [Google Scholar]
- 3.Schnitt SJ. Traditional and newer pathologic factors. J Natl Cancer Inst Monogr. 2001:22–26. doi: 10.1093/oxfordjournals.jncimonographs.a003456. [DOI] [PubMed] [Google Scholar]
- 4.Hayes DF, Isaacs C, Stearns V. Prognostic factors in breast cancer: current and new predictors of metastasis. J Mammary Gland Biol Neoplasia. 2001;6:375–392. doi: 10.1023/a:1014778713034. [DOI] [PubMed] [Google Scholar]
- 5.Bild AH, Yao G, Chang JT, et al. Oncogenic pathway signatures in human cancers as a guide to targeted therapies. Nature. 2006;439:353–357. doi: 10.1038/nature04296. [DOI] [PubMed] [Google Scholar]
- 6.Chang HY, Nuyten DS, Sneddon JB, et al. Robustness, scalability, and integration of a wound-response gene expression signature in predicting breast cancer survival. Proc Natl Acad Sci U S A. 2005;102:3738–3743. doi: 10.1073/pnas.0409462102. [DOI] [PMC free article] [PubMed] [Google Scholar]
- 7.Huang E, Cheng SH, Dressman H, et al. Gene expression predictors of breast cancer outcomes. Lancet. 2003;361:1590–1596. doi: 10.1016/S0140-6736(03)13308-9. [DOI] [PubMed] [Google Scholar]
- 8.Ma XJ, Wang Z, Ryan PD, et al. A two-gene expression ratio predicts clinical outcome in breast cancer patients treated with tamoxifen. Cancer Cell. 2004;5:607–616. doi: 10.1016/j.ccr.2004.05.015. [DOI] [PubMed] [Google Scholar]
- 9.Paik S, Shak S, Tang G, et al. A multigene assay to predict recurrence of tamoxifen-treated, node-negative breast cancer. N Engl J Med. 2004;351:2817–2826. doi: 10.1056/NEJMoa041588. [DOI] [PubMed] [Google Scholar]
- 10.Perou CM, Sorlie T, Eisen MB, et al. Molecular portraits of human breast tumours. Nature. 2000;406:747–752. doi: 10.1038/35021093. [DOI] [PubMed] [Google Scholar]
- 11.Sorlie T, Perou CM, Tibshirani R, et al. Gene expression patterns of breast carcinomas distinguish tumor subclasses with clinical implications. Proc Natl Acad Sci U S A. 2001;98:10869–10874. doi: 10.1073/pnas.191367098. [DOI] [PMC free article] [PubMed] [Google Scholar]
- 12.Sotiriou C, Neo SY, McShane LM, et al. Breast cancer classification and prognosis based on gene expression profiles from a population-based study. Proc Natl Acad Sci U S A. 2003;100:10393–10398. doi: 10.1073/pnas.1732912100. [DOI] [PMC free article] [PubMed] [Google Scholar]
- 13.van de Vijver MJ, He YD, van 't Veer LJ, et al. A gene-expression signature as a predictor of survival in breast cancer. N Engl J Med. 2002;347:1999–2009. doi: 10.1056/NEJMoa021967. [DOI] [PubMed] [Google Scholar]
- 14.Wang Y, Klijn JG, Zhang Y, et al. Gene-expression profiles to predict distant metastasis of lymph-node-negative primary breast cancer. Lancet. 2005;365:671–679. doi: 10.1016/S0140-6736(05)17947-1. [DOI] [PubMed] [Google Scholar]
- 15.West M, Blanchette C, Dressman H, et al. Predicting the clinical status of human breast cancer by using gene expression profiles. Proc Natl Acad Sci U S A. 2001;98:11462–11467. doi: 10.1073/pnas.201162998. [DOI] [PMC free article] [PubMed] [Google Scholar]
- 16.Zhao H, Langerod A, Ji Y, et al. Different gene expression patterns in invasive lobular and ductal carcinomas of the breast. Mol Biol Cell. 2004;15:2523–2536. doi: 10.1091/mbc.E03-11-0786. [DOI] [PMC free article] [PubMed] [Google Scholar]
- 17.Miller LD, Smeds J, George J, et al. An expression signature for p53 status in human breast cancer predicts mutation status, transcriptional effects, and patient survival. Proc Natl Acad Sci U S A. 2005;102:13550–13555. doi: 10.1073/pnas.0506230102. [DOI] [PMC free article] [PubMed] [Google Scholar]
- 18.Naderi A, Teschendorff AE, Barbosa-Morais NL, et al. A gene-expression signature to predict survival in breast cancer across independent data sets. Oncogene. 2007;26:1507–1516. doi: 10.1038/sj.onc.1209920. [DOI] [PubMed] [Google Scholar]
- 19.van 't Veer LJ, Dai H, van de Vijver MJ, et al. Gene expression profiling predicts clinical outcome of breast cancer. Nature. 2002;415:530–536. doi: 10.1038/415530a. [DOI] [PubMed] [Google Scholar]
- 20.Sjöström J. Predictive factors for response to chemotherapy in advanced breast cancer. Acta oncologica. 2002;41:334–345. doi: 10.1080/028418602760169370. [DOI] [PubMed] [Google Scholar]
- 21.Ma Y, Qian Y, Wei L, et al. Population-Based Molecular Prognosis of Breast Cancer by Transcriptional Profiling. Clin Cancer Res. 2007;13:2014–2022. doi: 10.1158/1078-0432.CCR-06-2222. [DOI] [PubMed] [Google Scholar]
- 22.Sawyers CL. The cancer biomarker problem. Nature. 2008;452:548–552. doi: 10.1038/nature06913. [DOI] [PubMed] [Google Scholar]
- 23.Sorlie T, Tibshirani R, Parker J, et al. Repeated observation of breast tumor subtypes in independent gene expression data sets. Proc Natl Acad Sci U S A. 2003;100:8418–8423. doi: 10.1073/pnas.0932692100. [DOI] [PMC free article] [PubMed] [Google Scholar]
- 24.Loi S, Haibe-Kains B, Desmedt C, et al. Definition of clinically distinct molecular subtypes in estrogen receptor-positive breast carcinomas through genomic grade. J Clin Oncol. 2007;25:1239–1246. doi: 10.1200/JCO.2006.07.1522. [DOI] [PubMed] [Google Scholar]
- 25.Ivshina AV, George J, Senko O, et al. Genetic reclassification of histologic grade delineates new clinical subtypes of breast cancer. Cancer Res. 2006;66:10292–10301. doi: 10.1158/0008-5472.CAN-05-4414. [DOI] [PubMed] [Google Scholar]
- 26.Eick CF, Rouhana A, Bagherjeiran A, Vilalta R. Using clustering to learn distance functions for supervised similarity assessment. Engineering Applications of Artificial Intelligence. 2006;19:395–401. [Google Scholar]
- 27.Levner I. Feature selection and nearest centroid classification for protein mass spectrometry. BMC Bioinformatics. 2005;6:68. doi: 10.1186/1471-2105-6-68. [DOI] [PMC free article] [PubMed] [Google Scholar]
- 28.Strickert M, Schleif FM, Villman T, Seiffert U. Similarity-Based Clustering. Springer; Berlin / Heidelberg: 2009. Unleashing Pearson Correlation for Faithful Analysis of Biomedical Data; pp. 70–91. [Google Scholar]
- 29.Weinstein JN, Myers TG, O'Connor PM, et al. An information-intensive approach to the molecular pharmacology of cancer. Science. 1997;275:343–349. doi: 10.1126/science.275.5298.343. [DOI] [PubMed] [Google Scholar]
- 30.Everitt B, Hothorn T. A Handbook of Statistical Analyses Using R. Boca Raton, FL: Chapman & Hall/CRC; 2006. [Google Scholar]
- 31.Shankavaram UT, Reinhold WC, Nishizuka S, et al. Transcript and protein expression profiles of the NCI-60 cancer cell panel: an integromic microarray study. Mol Cancer Ther. 2007;6:820–832. doi: 10.1158/1535-7163.MCT-06-0650. [DOI] [PubMed] [Google Scholar]
- 32.Wu Z, Irizarry RA, Gentleman R, Martinez-Murillo F, Spencer F. A Model-Based Background Adjustment for Oligonucleotide Expression Arrays. Journal of the American Statistical Association. 2004;99:909. [Google Scholar]
- 33.Ma Y, Ding Z, Qian Y, et al. An Integrative Genomic and Proteomic Approach to Chemosensitivity Prediction. Int J Oncol. 2009:107–115. doi: 10.3892/ijo_00000134. [DOI] [PMC free article] [PubMed] [Google Scholar]
- 34.Ma Y, Ding Z, Qian Y, et al. Predicting cancer drug response by proteomic profiling. Clin Cancer Res. 2006;12:4583–4589. doi: 10.1158/1078-0432.CCR-06-0290. [DOI] [PubMed] [Google Scholar]
- 35.Witten IH, Frank E. Data Mining: Practical Machine Learning Tools and Techniques. 2nd. Morgan Kaufmann; 2005. [Google Scholar]
- 36.Fan C, Oh DS, Wessels L, et al. Concordance among gene-expression-based predictors for breast cancer. N Engl J Med. 2006;355:560–569. doi: 10.1056/NEJMoa052933. [DOI] [PubMed] [Google Scholar]
- 37.McShane LM, Altman DG, Sauerbrei W, et al. REporting recommendations for tumor MARKer prognostic studies (REMARK) Breast Cancer Res Treat. 2006;100:229–235. doi: 10.1007/s10549-006-9242-8. [DOI] [PubMed] [Google Scholar]
- 38.McShane LM, Altman DG, Sauerbrei W, et al. Reporting recommendations for tumor marker prognostic studies (remark) Exp Oncol. 2006;28:99–105. [PubMed] [Google Scholar]


