Abstract
Small size polymer microring resonators have been exploited for photoacoustic (PA) imaging. To demonstrate the advantages of the wide acceptance angle of ultrasound detection of small size microrings, photoacoustic tomography (PAT), and delay-and-sum beamforming PA imaging was conducted. In PAT, we compared the imaging quality using different sizes of detectors with similar noise-equivalent pressures and the same wideband response: 500 μm hydrophone and 100, 60, and 40 μm microrings. The results show significantly improved imaging contrast and high resolution over the whole imaging region using smaller size detectors. The uniform high resolution in PAT imaging using 40 μm microrings indicates the potential to resolve microvasculature over a large imaging region. The improved lateral resolution of two-dimensional and three-dimensional delay-and-sum beamforming PA imaging using a synthetic array demonstrate another advantageous application of small microrings. The small microrings can also be applied to other ultrasound-related imaging applications.
Keywords: microring resonators, ultrasonic detector, photoacoustic imaging, photoacoustic tomography, beamforming
Introduction
Photoacoustic (PA) imaging, a noninvasive technique for imaging optical absorption, combines the advantages of both high-optical contrast between different biological tissues, such as blood vessels and their surrounding tissues, and better spatial resolution of ultrasound imaging because of weaker ultrasonic scattering.1 Compared with other pure optical imaging, such as optical coherence tomography, PA imaging provides deeper imaging depth in a scattering medium by using the diffused light instead of ballistic light.2 Biomedical applications such as in vivo brain imaging and breast cancer diagnosis have been demonstrated.3, 4
Since PA signals are 20 to 40 dB weaker than the ultrasound signals used in medical imaging, the detection methods for PA imaging typically rely on a single large-size piezoelectric transducer because of its convenience and high sensitivity. The bandwidths of most piezoelectric transducers are usually limited to 60% of the center frequency. The quality of the PA imaging can be degraded due to the large size and limited bandwidth.5 Wideband piezoelectric detectors with very small active size can have wide detection angle but suffer from poor signal-to-noise ratio (SNR) because the sensitivity is dependent on the detector aperture size. For example, a 40-μm piezoelectric polyvinylidene fluoride transducer (HPM04/1, Precision Acoustics, Dorchester, Dorset, United Kingdom) has an noise-equivalent pressure (NEP) around 10 kPa over a 100-MHz bandwidth considering only the noise from its matched preamplifier (HP1, Precision Acoustics). Current reconstruction algorithm for PA imaging has been developed based on point detectors.6 In practice, deconvolution of aperture effects may introduce artifacts and have not been accepted in clinical applications.7 Thus, a small-aperture detector with high sensitivity and wide bandwidth is highly desired for faithful reconstruction of PA absorption distributions.
The virtual point detector methods have been introduced to have small aperture size with high sensitivity.8, 9 However, the constructed virtual point detector has an effective size larger than 100 μm and a central frequency around 6 MHz with limited bandwidth. Such detectors can deteriorate the quality of PA imaging.5 Recently, a polymer microring resonator for ultrasound detection has been developed with increasing attraction.10, 11, 12, 13 The sensitivity of microrings primarily depends on the optical quality factor (Q) of microring resonators rather than directly on the detector size. The optical ultrasound detection enables a very wideband response, –3 dB bandwidth from DC to more than 90 MHz.10 For this work, we have developed different sizes of microring resonators with low NEPs around 20 to 200 Pa over 1 to 75 MHz bandwidth: 100- and 90-μm-diameter microring operated at an optical wavelength (λ) of 1550 nm;10, 12 60- and 40-μm-diameter microrings operated at λ = 780 nm.13 The low NEP, wide acceptance angle, and wideband response provided by the microring devices will directly benefit the quality of PA imaging. The new generation of microrings can also be applied to other ultrasound-related imaging.
In this paper, we conduct PA tomography (PAT) and delay-and-sum beamforming PA imaging to show the distinctive advantages provided by small size microrings. Section 2 briefly introduces the algorithm of PAT reconstruction. Both simulation and experiments of PAT with different detector sizes are demonstrated in Sec. 3. Two-dimensional (2-D) and three-dimensional (3-D) beamforming PA imaging are presented in Sec. 4. Finally, conclusions are provided in Sec. 5.
Photoacoustic Tomography: Principles
As has been described in literature,14, 15 in an acoustically homogeneous medium, the generation and propagation of a PA pressure wave p(r,t) at position r and time t in response to a heat source can be expressed as
| (1) |
where c is the speed of sound in the medium, β denotes the thermal coefficient of volume expansion, Cp denotes the isobaric specific heat capacity, and H(r,t) is the heating function defined as the thermal energy converted at r and t per unit volume and time. The heating function can be written as the product of a spatial absorption function A within the material at position r and a short irradiation pulse I(t), i.e.,
| (2) |
The I(t) is usually assumed as a delta-function laser pulse in the derivation. All absorbed optical energy is assumed to be converted into heat.
The algorithm in PAT is to reconstruct the spatial absorption function A(r) from the measured pressure p(r,t) at various position r. The exact inverse solution has been derived although it is computationally time consuming.16 Fortunately, when the scanning radius, ρ0, is much longer than the generated PA wavelengths, λa, as is the case in high-resolution PAT, the inverse solution has an approximated form15
| (3) |
where S0 is the measurement surface with a cylindrical surface r0 = (ρ0,ϕ0,z0) and Θ is the angle between the detector surface normal direction and the vector from the detector to the reconstruction point. From Eq. 3, the absorption distribution can be calculated by means of modified back projection of quantity , which is a good approximation under the far-field condition kρ0 ≫ 1 and k|r−r0| ≫ 1, where k = ωa/c is the wavenumber of the acoustic signals.
The PA pressure immediately generated by a spherical fluid object, illuminated by an infinite-short laser pulse, in an optically transparent fluid background that has the same sound speed and density as the object is given by14
| (4) |
where α is optical absorption coefficient, E0 is the energy fluence in the light beam, r is the distance from the object center, R is the radius of the object, t is the time, and U(ξ) = 1 for ξ ≥ 0 and U(ξ) = 0 otherwise. In practice, the measured PA pressure by an ultrasonic detector can be expressed as the convolution of multiple functions
| (5) |
where L(t) accounts for the propagation loss in the medium, D(t) is the impulse response of the detector, and * represents convolution. The last three terms in Eq. 5 are the factors that distort the original absorption A(r) in real applications. In our simulation, Eq. 5 will be substituted into Eq. 3 to evaluate the reconstructed PAT images.
Photoacoustic Tomography: Simulation and Experiments
To demonstrate the advantages of the small size microrings, we studied PAT images from both numerical simulations and phantom experiments in a 2-D case for convenience although 3-D imaging is equally feasible. The 2-D reconstruction algorithm can be obtained by simply setting z = 0 in Eq. 3.
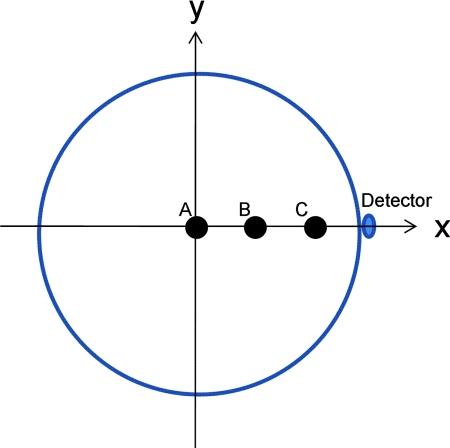
Polystyrene (PS) beads with sizes of 100 and 50 μm were considered in simulation. Due to the sound speed difference of PS beads, 2380 m/s, and the surrounding water, 1480 m/s, we considered the effective sizes of 62 and 31 μm in the simulation.11 Two different sizes of beads were used to generate PA signals of different frequency ranges, and thus can evaluate the effect of frequency-dependent directivity of detectors. The beads were positioned at three different locations: from the center of the scanning circle to off center positions at 4 and 8 mm, respectively, as shown in Fig. 1. The scanning radius was 12 mm with a step size of 3 deg/step, and the scanning center was set as coordinates (0, 0) with three beads at coordinates A (0,0), B (4,0), and C (8,0) mm. In order to have the same wide accept-ance angle, smaller detector size is required for higher frequency signals. For comparisons, an aperture size 500 μm wideband hydrophone (http://www.acoustics.co.uk/products/hpm05-3) with a NEP of 200 Pa, similar to or worse than the NEPs of our microrings, was also simulated.
Figure 1.
Diagram of beads positions and scanning geometry in PAT experiments.
The duration of a 6-ns laser pulse, which will be used in the experiments, is considered. In our case, L(t) in Eq. 5 is mainly due to water absorption, which has an attenuation coefficient of 2.2 × 10⁻⁴ dB/mm-MHz2.17D(t) includes the frequency and angular response of the detectors. A DC-100 MHz bandwidth is assumed for wideband microrings and hydrophones. The frequency-dependent angular response of microrings and hydrophones can be understood by considering a ring and disk piston transducer, respectively. The theoretical angular response or directivity d has been described:18d(θ) = J0(kasin (θ)) and d(θ) = J1(kasin (θ))/(kasin (θ)) for ring and disk, respectively, where k = ωa/c is the wavenumber of the incident acoustic signal, a the average radius of the element, and θ the incident angle of the acoustic wave.
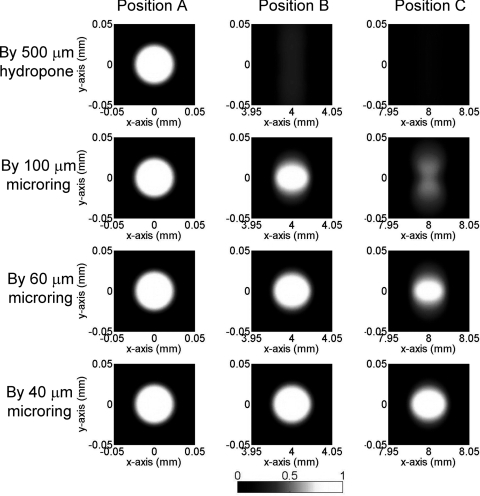
Figures 23 show the simulated PAT images of 100- and 50-μm sized PS beads using 500 μm hydrophone and different sizes of microrings. In Fig. 2, for the beads located at the center (i.e., position A) there is no difference in imaging contrast and resolution because the angle of all the impinging PA waves to the detectors are 0 deg, which gives the best angular response of all four detectors. As the beads position is farther from the center, from position B to C, both image contrast and resolution deteriorate because of narrower angular response. The 500-μm hydrophone only produces very blurred imaging in the y direction along with very poor imaging contrast. This is primarily due to the large angular dependence of the detector response resulting in a very small acceptance angle. Such undesirable effects can be effectively mitigated by using smaller size detectors, as can be seen in Fig. 2, when the detector size is reduced from 100 to 40 μm. Especially with a 40-μm microring, the imaging quality in positions B and C is almost completely restored and nearly identical to that of the central bead. A noticeable blurring is only observed for the bead at the far end position C.
Figure 2.
Simulated PAT images of 100-μm PS beads (effective size = 62 μm) using different types of detectors.
Figure 3.
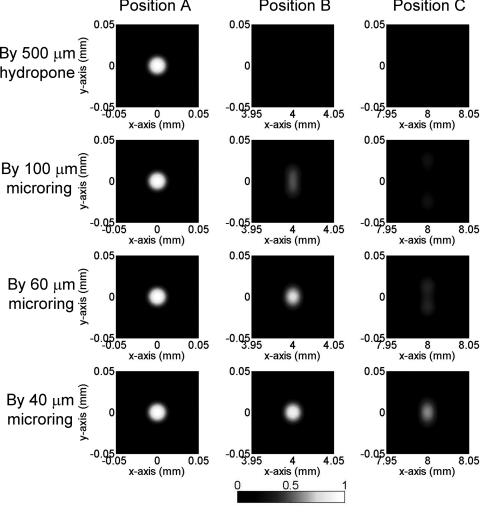
Simulated PAT images of 50-μm PS beads (effective size = 31 μm) using different types of detectors.
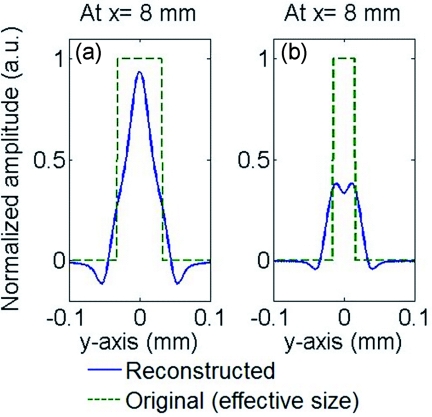
Next different bead sizes are evaluated for obtainable resolution. The PAT imaging of 50-μm beads are shown in Fig. 3. Beads at position A have good imaging quality no matter what sizes of detectors are used, as explained above. However, the imaging quality of beads farther away from the center quickly deteriorates: the 50-μm bead becomes undetectable even at position B by using a standard 500-μm sized hydrophone. The situation improves by using smaller microring detectors, and a 40 μm size microring can produce acceptable image contrast for a bead at location C. Compared with 100-μm beads in Fig. 2, the imaging quality of 50-μm beads suffers much more by using large size detectors. Take the images of 100- and 50-μm beads at position C by 60-μm microring for example, the one-dimensional (1-D) PAT profile along y of 100-μm beads have better imaging contrast and less blurring than that of 50-μm beads (Fig. 4). This can be understood because the smaller beads generate higher-frequency PA signals, and thus a smaller detector is needed to obtain wide enough acceptance angles. If the spatial resolution is defined as the full width at half maximum (FWHM), the 40-μm microrings yielded a high resolution of 22 μm in the x-direction and 30 μm in the y-direction for beads at position C with more than 0.5 imaging contrast. As a reference, previously reported virtual point detectors can only produce resolution of hundreds of μm.8, 9 Thus, with a low-noise small sized microring, the high resolution and good imaging contrast can be preserved even in regions far from the center. While in principle a large scanning radius could mitigate the aperture effects, a scanning circle as small as the objects, such as a mouse head, can be used to minimize the attenuation of PA signals.
Figure 4.
Simulated 1-D PAT profile along y of (a) 100- and (b) 50-μm PS beads at position C using 60-μm microring detectors.
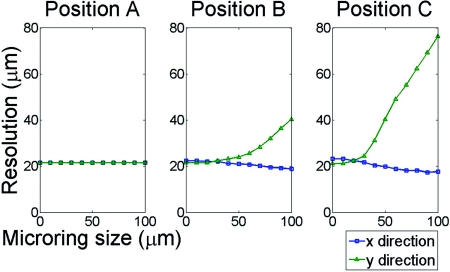
To study the relationship of imaging resolution and detector size, Fig. 5 shows the spatial resolution of imaged 50-μm beads as a function of microring size at positions A, B, and C. From the 1-D PAT profile along the x and y directions across the center of beads, we determined the resolution as FWHM although for some distorted images, such as Fig. 4b, the reconstructed maximum is not at the object center. Various sizes of microring detectors from a point to 100 μm are simulated. At position A, the resolution is independent of microring size. At positions B and C, we can clearly see that the resolution in the x direction is similar, while the resolution in the y direction linearly expands from a certain detector size. Clearly, for the imaging region farther from the center, a smaller sized detector is required to avoid blurred images. In order to preserve the resolution for the beads at all three locations, the size of the microring detector should be less than 30 μm. These simulation results show that a small sized detector is essential for faithful imaging reconstruction, especially for smaller objects and objects positioned away from the scan center.
Figure 5.
Simulated spatial resolution of 50-μm beads imaged by different microring size at positions A, B, and C.
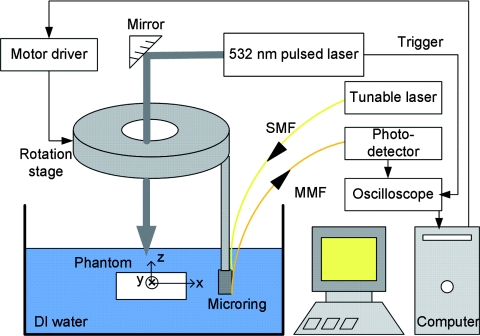
The PAT experiments were conducted for verification. The experimental setup is shown in Fig. 6. The working principles and the systems of microring ultrasonic detectors can be found in our publications.10, 11, 12, 13 Small rings with high sensitivity are obtained from extensive work to optimize the fabrication process. Detailed discussions can be found in Refs. 12 and 13. The PA signals were collected by a digital oscilloscope (WaveSurfer 452, LeCroy, Chestnut Ridge, New York) with a sampling rate of 500 MHz. The PS beads were fixed in a gel made by mixing water and 1% agarose (GPG/LE, American Bioanalytical, Natick, Massachusetts) and placed in de-ionized water. A 532-nm pulsed laser (Surelite I-20, Continuum, Santa Clara, California) with a 6-ns pulse duration was delivered from the top to the beads. A circular scan around the objects was realized by using a rotation stage. During the experiment, the microring detector scanned around the sample at a radius of ∼12 mm with a step size of 3 deg.
Figure 6.
Experimental setup of PAT imaging (SMF: single-mode fiber; MMF: multi-mode fiber).
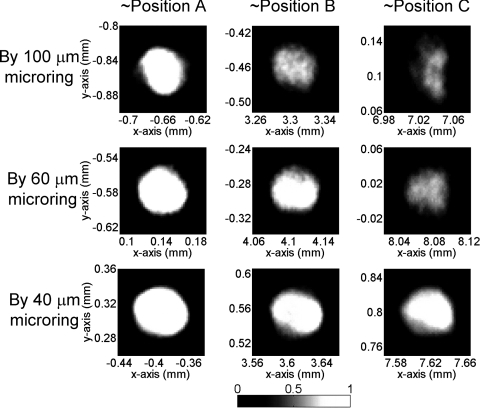
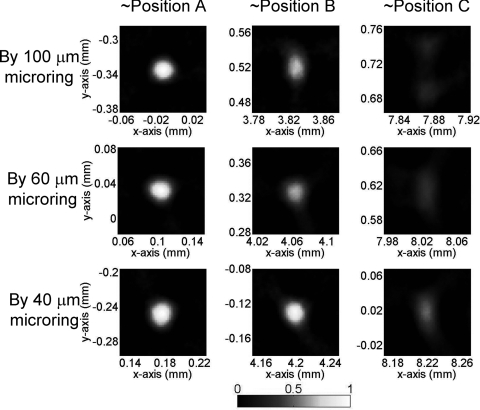
Figures 67 show the experimental PAT images of 100- and 50-μm beads, respectively, reconstructed from signals taken from the microring detectors. The beads were positioned close to, although not exactly at, the coordinates (0, 0), (4, 0), and (8, 0) mm. For the 100-μm beads around position A, the imaged size well fits the effective size, ∼62 μm, as shown in Fig. 6. Furthermore, all sizes of the microrings produced good imaging contrast. Only a little image distortion can be seen in the case of using the 100-μm microring, which may result from the fact that the bead was not well positioned at the center and the poorer directivity of the detector with the largest size of all was used in our experiment. Overall, the image quality worsens from position B to C, as expected from the simulation results. On the other hand, the image quality is significantly improved by using a 40-μm microring in all cases, also consistent with the simulation. A little discrepancy for all images between Figs. 27 could be due to the nonuniform laser absorption in the 100-μm beads.11 For the 50-μm beads case, the experimental results in Fig. 8 show excellent agreement with the simulation results in Fig. 3, except for slightly lower imaging contrast in imaged beads around position B by the 60-μm microring. These results serve as direct experimental proof that the small sized microring detectors have much less aperture effects. For the beads around position C by the 40-μm microring, a high resolution of 21 μm in x direction and 41 μm in y direction with imaging contrast of 0.5 was obtained, demonstrating the superior performance of the small sized microring as compared with other detectors reported in the literatures. Development of even smaller microrings with high sensitivity would further improve the imaging quality at regions far from the center.
Figure 7.
PAT images of 100-μm PS beads (effective size = 62 μm) using microrings.
Figure 8.
PAT images of 50-μm PS beads (effective size = 31 μm) using microrings.
Photoacoustic Imaging by Beamforming
PA imaging by beamforming was also conducted to show the advantage of small microrings for high-resolution imaging. The setup is similar to that in Fig. 6, but with the circular rotation stage replaced by a linear scanning stage and side illumination of the beads by the pulsed laser beam. Linear scan geometry was chosen because it emulates our ongoing work of a linear microring array. The 100-, 60-, and 40-μm microrings were mounted on the motorized scanning stage to form a 1-D and 2-D synthetic aperture, used for 2-D and 3-D imaging, respectively.
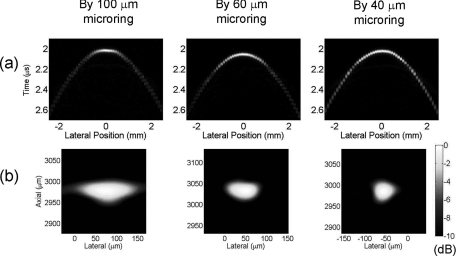
A 6-μm-diameter carbon fiber embedded in gel phantom is used to generate high-frequency PA signals. Different from the circular scanning used in PAT (Fig. 6), microring is linearly scanned along the x direction and the carbon fiber is oriented along the y direction. The distance between the synthetic aperture of microring and carbon fiber is about 3 mm. The microring is scanned 5 mm in 100-μm steps along the cross section of the carbon fiber. A bandpass filter from 20 to 60 MHz is applied to the recorded signal at each position. Then a delay-and-sum beamforming algorithm19, 20 with envelope detection is used for 2-D image reconstruction. The application of the 20 to 60 MHz bandpass filter is chosen to fit the main band of PA signals generated from the 6-μm carbon fiber. The wave field plot of the detected signals after the bandpass filter and the reconstructed image along the 1-D array is shown in Fig. 9. Improved signal amplitudes at large incident angles can be clearly seen in Fig. 9a by reducing the microring size from 100 to 40 μm. The axial FWHM resolutions are similar, ∼50 μm, for three sizes of microrings. This is because the same bandpass filter is used. The lateral resolution is 146-, 77-, and 55-μm for the case of 100-, 60-, and 40-μm microrings, respectively. Improved lateral resolution was obtained because larger array aperture can be used in the smaller microring due to its larger acceptance angle. A filter with a higher band can be used to improve the axial resolution at the expense of lateral resolution due to smaller aperture at higher frequency and SNR due to the mismatch between the band of PA signals and the filter. Thus, the specific bandpass filter can be chosen based on the consideration of trade-offs between resolutions and SNR. These results demonstrate that the 40-μm microrings are capable of forming detection arrays for PA imaging at resolutions of about 50 μm, representing one ultrasound wavelength at a frequency of 30 MHz. Note that the bandpass filter used in the delay-and-sum beamforming algorithm is usually not applied in PAT, which requires wideband signals to reconstruct images with a variety of spatial variations.11
Figure 9.
(a) Wave field plot of the detected acoustic field along a 1-D array and (b) reconstructed image of the cross section of a 6-μm-diameter carbon fiber displayed over a 10-dB dynamic range, where 0 dB represents the maximum reconstructed signal.
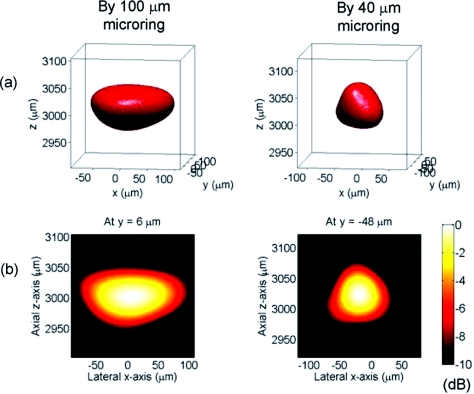
We also test a 2-D synthetic array for 3-D PA imaging. The 50-μm PS beads fixed in a gel were imaged by 100- and 40-μm microrings. The center of the synthetic array, in the x-y plane, is defined as the origin of the coordinate system. The PS beads are placed about 3 mm above the array. The microring is scanned through a region of 5 mm by 5 mm. Bandpass filtering from 12 to 38 MHz was chosen to catch the main band of the PA signals. The reconstructed 3-D and the 2-D cut images on the x-z plane crossing the center of the bead are shown in Fig. 10. The lateral FWHM resolutions are ∼150 and ∼80 μm, respectively, imaged by the 100- and 40–μm microrings, while the axial resolution are similar, ∼80 μm, by both microrings. The 3-D PA images clearly show the improved lateral resolution using a 40-μm microring.
Figure 10.
(a) –6 dB isosurface of a 3-D PA image of a 50-μm bead. (b) A 2-D image on the plane crossing the central position of the bead displayed over a 10-dB dynamic range.
Conclusions
In summary, the low-noise, wideband, and small size microring detectors have been tested for high-resolution PA imaging. The noise level of our small size microrings with diameters from 40- to 100-μm is comparable to, or lower than that of, a commercial wideband hydrophone with a size of 500 μm. Both numerical simulations and phantom experiments were performed to demonstrate the advantages of using small microrings in PAT imaging. The small size microrings offer significant improvement in PAT imaging quality for the objects far from the center. Besides PAT, the small size microrings applied in beamforming PA imaging also demonstrated the improved lateral resolution because of a larger synthetic aperture of the microrings. Unlike piezoelectric transducers, the sensitivity of microrings is not directly related to its size. Thus, the microring has the potential to be fabricated in even smaller sizes without degrading the sensitivity with improvement in fabrication technologies. Making a smaller microring, e.g., 20 μm in diameter, with low NEP will certainly be the focus of our future work.
Acknowledgments
Support from NIH Grant No. EB007619 is gratefully acknowledged.
References
- Zhang H. F., Maslov K., Stoica G., and Wang L. V., “Functional photoacoustic microscopy for high-resolution and noninvasive in vivo imaging,” Nat. Biotechnol. 24(7), 848–851 (2006). 10.1038/nbt1220 [DOI] [PubMed] [Google Scholar]
- Li C. and Wang L. V., “Photoacoustic tomography of the mouse cerebral cortex with a high-numerical-aperture-based virtual point detector,” J. Biomed. Opt. 14(2), 024047 (2009). 10.1117/1.3122365 [DOI] [PMC free article] [PubMed] [Google Scholar]
- Wang X., Pang Y., Ku G., Xie X., Stoica G., and Wang L. V., “Non-invasive laser-induced photoacoustic tomography for structural and functional in vivo imaging for the brain,” Nat. Biotechnol. 21(7), 803–806 (2003). 10.1038/nbt839 [DOI] [PubMed] [Google Scholar]
- Ku G., Fornage B. D., Jin X., Xu M., Hunt K. K., and Wang L. V., “Thermoacoustic and photoacoustic tomography of thick biological tissues toward breast imaging,” Technol. Cancer Res. Treat. 4(5), 559–566 (2005). [DOI] [PubMed] [Google Scholar]
- Xu M. and Wang L. V., “Analytic explanation of spatial resolution related to bandwidth and detector aperture size in thermoacoustic or photoacoustic reconstruction,” Phys. Rev. E 67, 056605 (2003). 10.1103/PhysRevE.67.056605 [DOI] [PubMed] [Google Scholar]
- Xu M. and Wang L. V., “Universal back-projection algorithm for photoacoustic computed tomography,” Phys. Rev. E 71, 016706 (2005). 10.1103/PhysRevE.71.016706 [DOI] [PubMed] [Google Scholar]
- Loupas T., Pye S. D., and McDicken W. N., “Deconvolution in medical ultrasonics: practical considerations,” Phys. Med. Biol. 34(11), 1691–1700 (1989). 10.1088/0031-9155/34/11/016 [DOI] [PubMed] [Google Scholar]
- Yang X., Li M.-L., and Wang L. V., “Ring-based ultrasonic virtual point detector with applications to photoacoustic tomography,” Appl. Phys. Lett. 90, 251103 (2007). 10.1063/1.2749856 [DOI] [Google Scholar]
- Li C. and Wang L. V., “High-numerical-aperture-based virtual point detectors for photoacoustic tomography,” Appl. Phys. Lett. 93, 033902 (2008). 10.1063/1.2963365 [DOI] [PMC free article] [PubMed] [Google Scholar]
- Huang S.-W., Chen S.-L., Ling T., Maxwell A., O’Donnell M., Guo L. J., and Ashkenazi S., “Low-noise wideband ultrasound detection using polymer microring resonators,” Appl. Phys. Lett. 92, 193509 (2008). 10.1063/1.2929379 [DOI] [PMC free article] [PubMed] [Google Scholar]
- Chen S.-L., Huang S.-W., Ling T., Ashkenazi S., and Guo L. J., “Polymer microring resonators for high-sensitivity and wideband photoacoustic imaging,” IEEE Trans. Ultrason. Ferroelectr. Freq. Control 56(11), 2482–2491 (2009). 10.1109/TUFFC.2009.1335 [DOI] [PMC free article] [PubMed] [Google Scholar]
- Ling T., Chen S.-L., and Guo L. J., “Fabrication and characterization of high Q polymer micro-ring resonator and its application as a sensitive ultrasonic detector,” Opt. Express 19(2), 861–869 (2011). 10.1364/OE.19.000861 [DOI] [PMC free article] [PubMed] [Google Scholar]
- Ling T., Chen S.-L., and Guo L. J., “High-sensitivity and wide-directivity ultrasound detection using high Q polymer micro-ring resonators,” submitted to Appl. Phys. Lett. [DOI] [PMC free article] [PubMed]
- Diebold G. J., Sun T., and Khan M. I., “Photoacoustic monopole radiation in one, two, and three dimensions,” Phys. Rev. Lett. 67(24), 3384–3387 (1991). 10.1103/PhysRevLett.67.3384 [DOI] [PubMed] [Google Scholar]
- Xu M., Xu Y., and Wang L. V., “Time-domain reconstruction algorithms and numerical simulations for thermoacoustic tomography in various geometries,” IEEE Trans. Biomed. Eng. 50(9), 1086–1099 (2003). 10.1109/TBME.2003.816081 [DOI] [PubMed] [Google Scholar]
- Wang X., Xu Y., Xu M., Yokoo S., Fry E. S., and Wang L. V., “Photoacoustic tomography of biological tissues with high cross-section resolution: reconstruction and experiment,” Am. Assoc. Phys. Med. 29(12), 2799–2805 (2002). 10.1118/1.1521720 [DOI] [PubMed] [Google Scholar]
- Cannata J. M., Williams J. A., Zhou Q., Ritter T. A., and Shung K. K., “Development of a 35-MHz piezo-composite ultrasound array for medical imaging,” IEEE Trans. Ultrason. Ferroelectr. Freq. Control 53(1), 224–236 (2006). 10.1109/TUFFC.2006.1588408 [DOI] [PubMed] [Google Scholar]
- Blackstock D. T., Fundamentals of Physical Acoustics, Wiley, New York: (2000). [Google Scholar]
- Mucci R. A., “A comparison of efficient beamforming algorithms,” IEEE Trans. Acoust., Speech, Signal Process. ASSP-32(3), 548–558 (1984). 10.1109/TASSP.1984.1164359 [DOI] [Google Scholar]
- Hoelen C. G. A. and de Mul F. F. M., “Image reconstruction for photoacoustic scanning of tissue structures,” Appl. Opt. 39(31), 5872–5883 (2000). 10.1364/AO.39.005872 [DOI] [PubMed] [Google Scholar]


