
Figure 5.
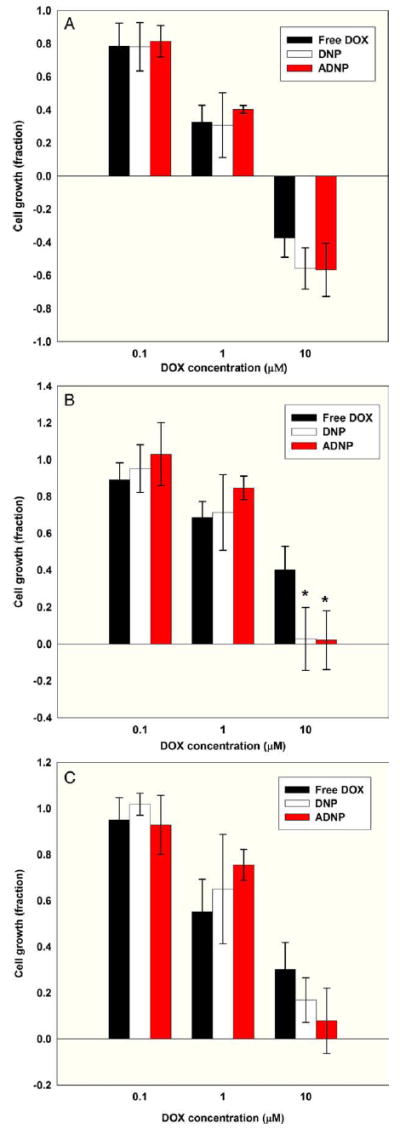
Cytotoxicity of different NP formulations. (A) MES-SA cell growth for different drug formulations (n = 3 experiments, four wells per treatment). (B) Dx5 cell growth for different drug formulations (n = 3 experiments, four wells per treatment). *P < 0.05 (by ANOVA) DNPs and ADNPs compared to free DOX, indicating significant uptake due to NP encapsulation. (C) SKOV-3 cell growth for different drug formulations (n = 3 experiments, four wells per treatment).