Abstract
In this paper, we demonstrate a high speed spectral domain optical coherence tomography (SDOCT) system capable of achieving full range complex imaging at 47 kHz line scan rate. By applying beam-offset method, a constant modulation frequency is introduced into each B-scan that enables reconstruction of the full range complex SDOCT images of in vivo tissue samples. To make use of the full capacity of detection camera used in the system, system control software is developed that streams the raw spectral fringe data directly into the computer memory. In order to assess performance of the high speed full range SDOCT system for imaging biological specimen, we present results imaged from the cuticle of fingernail of a human volunteer in vivo, and from the chicken embryos ex vivo. We also show the high sensitivity advantages of full range complex imaging as compared to the conventional SDOCT. To the best of our knowledge, 47,000 A-scan imaging rate is the highest imaging rate ever been reported for full range complex imaging. Notwithstanding, the method reported here has no limitations on the imaging speed, thus offers a useful tool to achieve volumetric imaging of living samples where the high sensitivity region around zero-delay line in the system can be utilized for imaging.
Keywords: Spectral domain optical coherence tomography, full range complex imaging, spectral interferograms, in vivo imaging
1. Introduction
Optical coherence tomography (OCT) has been emerging as a non-invasive powerful technique for in vivo imaging of biological specimens with very high resolution between 1 – 10 μm. In recent years, the focus of new developments has shifted towards spectral domain OCT (SDOCT) and swept-source OCT (SSOCT), since it has been shown that these frequency domain OCT (FDOCT) versions have advantages in terms of acquisition speed and sensitivity, as compared to time domain OCT (TDOCT) [1, 2]. However, a major drawback of the FDOCT that limits its practical application is the complex-conjugate ambiguity, which is inherent to the Fourier transformation of real functions. In SDOCT, the depth resolved information is encoded in the cross spectral density function measured with a spectrometer located at the output arm of the interferometer. Since the detected spectral density is a real function and therefore its Fourier transform is Hermitian, the reconstructed image is symmetric with respect to the zero-phase delay of the interferometer. To avoid this ambiguity in interpretation of resulted OCT images, the zero-delay line position must be carefully positioned outside of the imaged sample. Thus, only half of the imaging depth is available in practice. By resolving this problem the imaging depth range can be doubled that would in turn provide additional flexibility though arbitrary positioning of the zero delay line. Moreover, the sensitivity of SDOCT system has shown to be the highest around the zero delay line [3]. Thus, it is desirable to use the region around the zero delay line for imaging so that the imaging contrast for highly scattering tissue is improved.
To achieve the full range complex imaging for SDOCT, several methods have been proposed [4–10]. The first obvious approach is to construct complex OCT signals by phase-shifting method, an approach that is often used in the optical metrology [11]. Wojtkowski et al (2002) [4] first introduced this method into SDOCT for in vitro imaging by recording 5 measurements at the same location. Because of the high stability requirement, this technique is not suitable for in vivo applications. Even though some other similar but faster methods have been reported [5–8], these methods still need additional phase shifting components and the measurement speed is reduced by the requirement of multiple A-scans to obtain full range complex signals, making the in vivo imaging difficult. Yasuno et al (2006) [9] introduced a B-M scanning method, in which a linearly increasing phase shift is generated by the uniform movement of a piezo-driven reference mirror with a triangle wave modulation during each B-scan. By using this method, it is possible to achieve a full range complex imaging with high speed. However, triangle wave modulation of the reference mirror does not introduce a constant modulation frequency into the interferograms, which leads to the image flipping in a single B-scan. Wang [10] later pushed this method to a new height, in which a constant modulation frequency was introduced into the interferograms by moving the reference mirror. By using this latter method, the full range SDOCT imaging has been successfully achieved at an A-scan rate of 20 kHz in vivo. Still, this method needs a piezo-stage to provide the modulation requirement in the interferograms, which limits faster imaging speed due to the mechanical movement of the piezo-stage used. Recently, we [12] and other groups [13] reported a new technology to achieve full range complex FDOCT, in which a constant modulation frequency is introduced by the galvo scanner that is used for x-scanning the sample beam. By offsetting the sample beam from the pivot axis of the x-scanner, it causes a path length modulation during x-scanning, thus introduces a modulation frequency in the B-scan interferograms. One advantage of this method is that any additional phase shifting elements to realize frequency modulation in a single B-scan is avoided. Furthermore, the modulation frequency is inherently given by the system itself. These aspects provide us a potential to achieve high speed full range complex SDOCT system without restriction on additional hardware component, and without limitation on the imaging speed, which is important for in vivo imaging applications.
Another factor that could constrain the system imaging speed is the data acquisition capability, especially the data flow management since the increased imaging speed demands the increased computing power to fast capture, process and display imaging data. By optimizing the data streaming process of the control software package and applying beam-offset method, we demonstrate a high speed full range complex FDOCT system, which can achieve 47,000 A-scans per second. In this paper, we present in vivo and ex vivo experiments by use of the proposed system. This imaging speed represents the fastest full range complex FDOCT imaging ever been reported to the best of our knowledge.
2. Experimental system setup
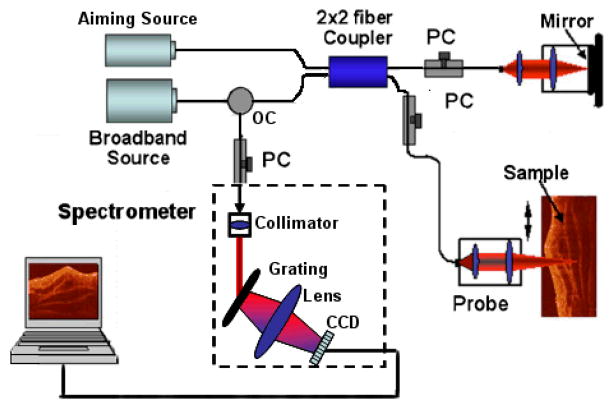
The schematic of the system setup used in our full range complex spectral domain OCT is illustrated in Fig. 1. We used a superluminescent diode (SLD) as the light source. This SLD emits light with a central wavelength of 1310 nm and a band width of 56 nm, corresponding to a coherence length of ~12 μm in air. The light beam from the SLD was then coupled into a fiber based interferometer, which was composed of a fiber circulator and a 50/50 fiber splitter. The reference light was delivered to a stationary mirror by a collimating lens and an objective lens. In the sample arm, we used the nearly identical collimating lens and an objective lens to deliver the light onto the sample.
Fig. 1.
Schematic of the SDOCT system used in this study, where PC represents the polarization controller, CCD the charged coupled device and OC the optical circulator.
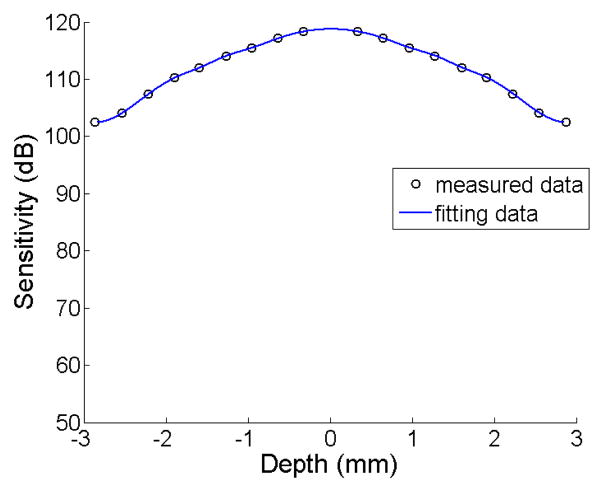
The distance of mirror to the end of fiber in the reference arm was set to be at the zero phase-delay line of the system. In doing so, ~3 mm measurement range on both sides of the zero phase-delay line was obtained, which means that the total measurement range of our system is about 6 mm. At the sample arm, an x-y galvanometer pair was used to achieve 2-D scanning. The light was focused onto the sample by another objective lens, which gave ~16 μm lateral resolution with a focal length of 50 mm. The light backscattered from the sample and reflected from the reference mirror was recombined by the fiber coupler. After collimated by a 30 mm focal length collimator, the light was directed onto a 1200 lines/mm transmitting grating and then focused by an achromatic lens with 100 mm focal length onto a 14-bit line scan InGaAs camera, which consists of 1024 pixel array detectors. Combined with the achromatic lens, the spectrometer had a designed spectral resolution of 0.141 mm, which provided a total depth range of 6 mm (2×3 mm, i.e., on both sides of zero-delay line). Fig. 2 shows the dynamic sensitivity curve of our system measured over the optical ranging distance of 6 mm. As shown in the figure, the sensitivity measured at ±0.5 mm is about 118 dB, and it drops to about 102 dB at ±3 mm depth point. This means that if we put the sample in one side of the measurement range, the sensitivity will decrease by 16 dB at ranging distance of 3 mm relative to the zero delay line. But if the sample is placed across the zero-delay line (for example from −1.5mm to 1.5mm), the decrease of the sensitivity is only 6 dB, which is much smaller than the former one. Thus, it is expected that the imaging contrast, particularly for the deeper regions within a sample, would be enhanced if the sample is placed around the zero delay line.
Fig. 2.
Measured system sensitivity against imaging depth. The solid curve was resulted from the 4th order polynomial curve fitting to the measured data.
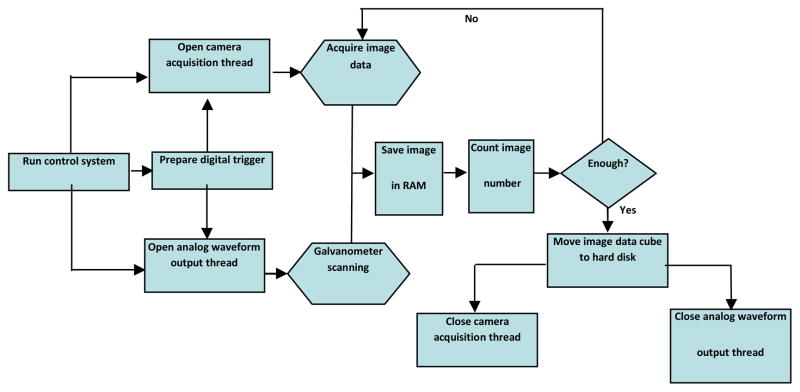
For the high-speed FDOCT application, one of the main requirements is the utilization of the full acquisition capability of the camera. In our system, if the integrating time was set at 17 μs, the corresponding time taken for the process of downloading the raw fringe data to the host computer via CameraLinkTM and a high-speed frame grabber board (PCI 1428, National Instruments, USA) was about 4 μs. In this case, the line rate of the camera reaches up to 47 kHz. To achieve such high acquisition speed, a software package to synchronize the scanning of the beam scanning system and the handling of the camera data acquisition is required. In the previous system, we used a custom software package that was developed by Labview language. Due to the limited memory management capability of the Labview language platform, it is difficult to handle a large amount of data flow directly into the system RAM. Thus, every time one single frame (B-scan) image (2000 A-scans) captured by the camera was directly saved into the hard disk, which is very slow compared to the time required by streaming the data into the RAM. For this reason, the final system speed is significantly decreased. To improve the acquisition speed of the system, a custom software was redeveloped under the Visual C++ platform, by which the acquired raw data hand-shakes with the RAM directly. The acquisition process steps implemented for the high speed full range SDOCT system is illustrated in Fig. 3. First, a multi-thread control core (control system) prepares the digital trigger signal and initializes the image acquisition thread and the control waveform output thread. The control waveform thread controls the x–y scanner to scan the probe beam, and the image acquisition thread streams the captured spectral interferograms into the system RAM frame by frame (B-scan). The two threads are synchronized by the digital trigger signal. Upon all B-scans in a C-scan are captured, the C-scan (3D) dataset is then moved to the system hard disk. Finally, the image acquisition and control waveform threads are ceased in order to protect the imaging system.
Fig. 3.
Flow chart of fast speed full range complex FDOCT software control system.
Thus far, we have constructed a fast speed FDOCT system to achieve the 47 kHz A-scan rate for full range complex imaging. For introducing the modulation frequency, the method proposed here is to simply offset the beam away from the pivot point when it deflects from the x-scanning mirror in the sample arm. This operation does not bring additional cost to the system. And at the same time, the frequency is inherently given by the system itself. This provides two great advantages compared to the previous method reported in [10]. First, the synchronization between the B-scan scanning and introduction of the modulation frequency is solved perfectly. Second, the scanning speed will never be the issue that may restrict the introduction of the modulation frequency. For the above reasons, the beam-offset method may be the best choice for high speed in vivo imaging application. In our system, the x-scanner, scanning at lateral direction, was driven by a 20 Hz sawtooth waveform, with amplitude of ~2.7 mm, while y-scanner, providing elevational scanning, was driven by a 0.1 Hz triangle waveform, whose amplitude was also ~2.7 mm. Here we offset the sample beam away from the pivot point of x-scanner about 10 mm, which provided 11 kHz (measured) modulation frequency within the B-scan interferograms. This modulation frequency totally separated the two mirror frequency components of the B-scan, making sure that full range complex FDOCT with high complex rejection ratio is achieved for the in vivo experiments.
3. Theoretical aspects
In FDOCT system, the captured spectral interferogram, which is formed between the reference light and the light backscattered from within the sample, can be expressed as;
| (1) |
where k is the wavenumber of the light, I(t,k) is the light intensity, S(k) is the spectral density of the light source, n is the refractive index of the sample, a(z) is the amplitude of the light and z is the depth the light back scattered from; t is the capture time of each A-line in one B-scan. However, in real situation, the biological specimen is often optically heterogeneous, which means that a(z) and n should be also the function of t along lateral direction, rather than a constant. Consequently, the frequency components of I(t,k) along lateral direction, against t, should also randomly distributed around zero frequency with a band width of BW [16], as illustrated in Fig. 4(A). Besides optical heterogeneity of the sample, BW is also determined by the A-line density of one B-scan. In our experiment, we captured 2000 A-line in one B-scan over 2.7 mm, which provided 1.35 μm intervals between adjacent A-scans.
Fig. 4.
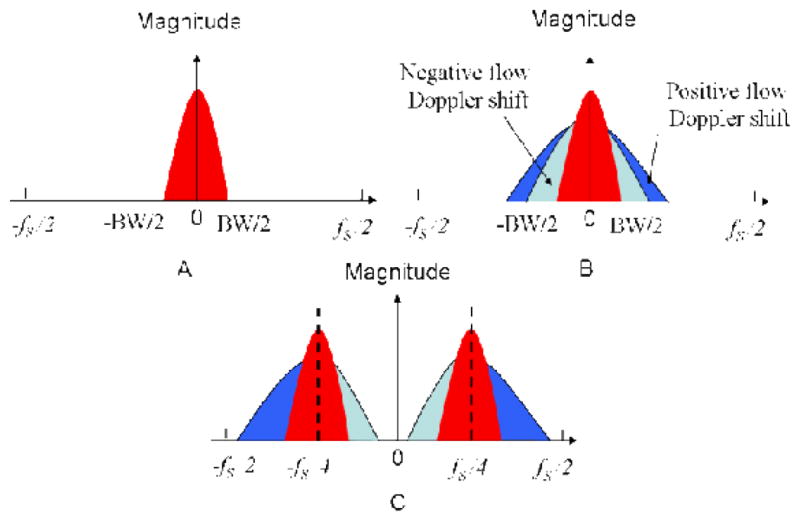
Signal bandwidth of time varying interference signal (a) real tissue (optically heterogeneous sample) with no moving particles; (b) real tissue (optically heterogeneous sample) with moving particles; (c) real tissue(optically heterogeneous sample) with carrier frequency modulation.
For in vivo experiments, one of the key issues is the sample movement, which brings significant Doppler shift into B-scan signals, causing serious artifacts to the final image. In this case, Eq. (1) should be present as following equation:
| (2) |
v is the velocity of the sample movement. Considering the direction of sample movement, the envelope of the spatial frequency components of the sample would broaden towards positive as well as negative frequency directions. Because the real valued characteristics of Eq. (2), the broadened frequency components caused by Doppler shift of the sample movements would also be symmetrical relative to the zero frequency, as shown in Fig. 4(B) (The blue part is the frequency components caused by negative Doppler shift and green part is that caused by positive Doppler shift.). To achieve full range FDOCT imaging, we need first adding a constant phase shift into adjacent A-lines by offsetting the incident beam of sample arm away from the pivot of the x-scanner to provide a modulation frequency, fc [12].
| (3) |
Where δ is the offset distance of the sample beam away from the pivot point on the x-scanner, and ω is the angular scanning frequency of the x-scanner during imaging.
Considering the optical heterogeneity of the real sample, the phase introduced by this modulation frequency should be 2πfcn(t)t. Then the equation can be expressed as follows:
| (4) |
Where fd = kv/π is the Doppler shift frequency caused by the sample movements. For in vivo full range FDOCT imaging, to obtain higher complex conjugate ratio, we need to consider the velocity directions. For the positive direction, the maximum tolerable sample movement of the system is determined by the sum of the frequency shifts caused by the sample movements, the introduced modulation frequency as well as the spatial frequency bandwidth due to the sample optical heterogeneity. This overall sum must satisfy the Nyquist theorem to make sure no wrapping problem occurred when using 47 kHz line scan rate of the InGaAs camera used. Consequently for the entire frequency plane (that include the positive and negative frequency space), the difference of modulation frequency and the Doppler shift frequency must be controlled to a value that is adequate to separate the two symmetrical frequency components of sample (see Fig. 4C). If the sample movement cannot meet these requirements, the movement artifacts will dominate the final OCT image according to Wang [16]. Based on the above analysis, the optimized modulation frequency should be fs/4 (fs system acquisition frequency) and the projection velocity tolerance range of the full range FDOCT system can be presented by
| (5) |
In our case, the system acquisition frequency is 47 kHz, spatial frequency bandwidth of our sample is ~ 2 kHz. The tolerance range of sample movement for our system is thus [−14.1 to +14.1] mm/s. note that this quoted value is the true sample movement velocity projected on the probe beam axis. To get the absolute velocity of sample movement, we need to further consider the Doppler angle between the incident beam and the velocity direction [15].
4. Testing of full range complex imaging
In order to test the capability of complex rejection for our high speed full range complex SDOCT, we applied the system described in Section 2 to image the finger nail of a healthy volunteer in our lab. Before imaging, the nail surface was purposely adjusted to be oriented below the zero-delay line. In this case, the complex conjugate mirror image could be used to test the performance of our system, i.e., its ability to reject it. In the experiment, the imaging rate was set at the maximal capacity of InGaAs camera used (see Fig. 1), i.e., at a rate of 47,000 A-scans per second. The B-scan imaging rate was set at 23 frames per second with each frame containing 2000 A-scans over about 2.7 mm on the sample. This translated to a spatial interval of ~1.35 μm between adjacent A-scans, which would provide a very good correlation between sequential A-scans. Before applying full range complex FDOCT algorithm to reject the mirror image, the autocorrelation, self-cross correlation and fixed camera noises inherent in the FDOCT were first eliminated or minimized by a method described in [16], in which the average spectra of all the spectral interferograms of each B-scan along x-direction at each wavelength was treated as the reference, which was then subtracted from the raw spectra captured by the camera. The subtracted spectra were rescaled into the equal k space by use of spline interpolation method. To obtain the final OCT image of the scanned sample, there are two ways to treat this rescaled real valued interference fringe spectra. One was is to directly apply the Fourier transformation along the k space value, i.e., the conventional FOCT approach. This will result in the structural OCT images with the complex conjugate mirror image left on the other side of the zero-delay line. Another way is that before performing the Fourier transformation along the k space value, the Hilbert transformation along B-scan direction is first applied to reconstruct the complex interferograms, i.e., the full range complex imaging [12]. This latter method results in the full range complex FDOCT image.
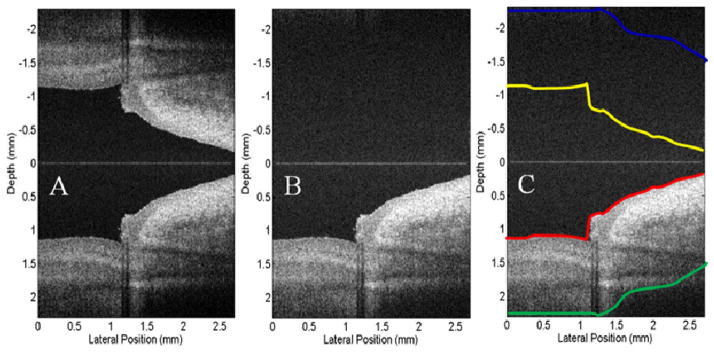
Fig. 5(A) shows the finger nail structure near the nail fold region of a human volunteer, using standard FDOCT algorithm, with complex conjugate mirror image appeared in the upper measurement region. Fig. 5(B) shows the resulted structural image, by applying the full range complex FDOCT algorithm on the same spectral fringe data as the Fig. 5(A). Figs. 5(A) and (B) demonstrate that by introducing a modulation frequency into the interferograms and applying Hilbert transformation along B-scan direction before Fourier transformation along each A-line, the complex conjugate mirror image was almost completely eliminated.
Fig. 5.
OCT images extracted from the real time videos of a fingernail near the nail fold region obtained from: (A) Standard FDOCT approach, (B) Full range complex FDOCT approach. The physical size shown is 2.7 × 4.4 mm2 (lateral × depth).
To assess the complex rejection efficiency of our system running at 47,000 A-scans per second, we calculated the average intensities within the mirror-image region and outside the mirror-image region, and used these values as the metric in this assessment. To calculate the averaged intensity values, we applied the edge detection method at the positive region of the structure image shown in Fig. 5(A) to obtain the anterior boundary and posterior boundary of the sample. This method is similar to the one that was presented by [14]. Briefly, the structure image was first blurred by using a Gaussian filter with a standard deviation of 4×4 pixels. And then an edge image was obtained by calculating the gradient of the blurred structure image. After that, the resulted edge image was converted to a binary image by setting a threshold. The first nonzero points of the binary image were subsequently chosen as the edges after the isolated small noise grains were eliminated. The final anterior boundary of the finger nail (see redline in Fig. 5C) was obtained upon fitting and smoothing the resulted edges.
The posterior boundary was obtained by setting a threshold to the blurred structure image. The threshold value here was chosen to be ~10 dB above the system noise floor. The OCT intensity was treated as the signal and set to be 1 if it is larger than the threshold; otherwise, it was treated as noise and set to be 0. Using this method, the structure image was converted to a binary image. The posterior boundary was obtained by the last nonzero points after the isolated small noise grains were eliminated. Again, the fitting and smoothing were applied to obtain this posterior boundary curve (see green line in Fig. 5C). After these steps as described above, two regions were finally obtained in the positive output plane (i.e., below the zero delay line as shown in Fig. 5): the signal region and the noise region. The signal region is the area sandwiched between anterior and posterior boundaries, while the noise region was the area outside the signal region.
Upon the signal and noise regions identified in the positive plane, we relayed them onto the negative plane (i.e., above the zero delay line) to test the complex rejection ratio of our system. This is illustrated in Fig. 5(C) by the yellow and blue curves. By now, we could calculate the average intensity values for the signal (between yellow and blue curves) and noise (outside the yellow and blue curves) regions in the negative plane. The results were 18.9 dB for the signal region and 18.5 dB for the noise region, indicating that the mirror image is almost completely rejected in the negative plane. In the positive plane, these values were 46.4 dB and 19.2 dB for the signal and noise regions, respectively, with the maximal signal strength of 72.8 dB at the position coordinates of (0.49, 2.28) mm. These quantitative signal-strength values demonstrate the capability of our fast speed FDOCT system working at 47 kHz line rate to reject the complex conjugate mirror images, thus the full range complex imaging can be achieved with minimal artifacts. This speed is much faster than the previous experiments ever reported. It is also worth noting that during imaging, the finger of the volunteer was simply placed under the imaging probe without any means to stabilize it.
5. Experimental results
Compared to conventional FDOCT system, full range complex FDOCT has two significant advantages, (1) the optical ranging, i.e., imaging depth is twice that of the conventional approach; (2) the sample can be placed around the zero delay line, where the highest sensitivity could be made of use for imaging. To better illustrate these two advantages, we performed two experiments using our fast speed full range complex FDOCT system described above. The 3D data cube captured by the CCD camera contains 1024 pixels in Z direction (A-scan), 2000 A-lines in lateral direction (B-scan), and 200 frames in elevation direction (C-scan), which took about 10 seconds at the frame rate of 20 Hz. The size of this data cube is 6×2.7×2.7 mm3 in air, which corresponds to a physical sample cube of ~4.4×2.7×2.7 mm3 (assuming the refractive index of tissue is ~1.35).
5.1 In vivo experiment
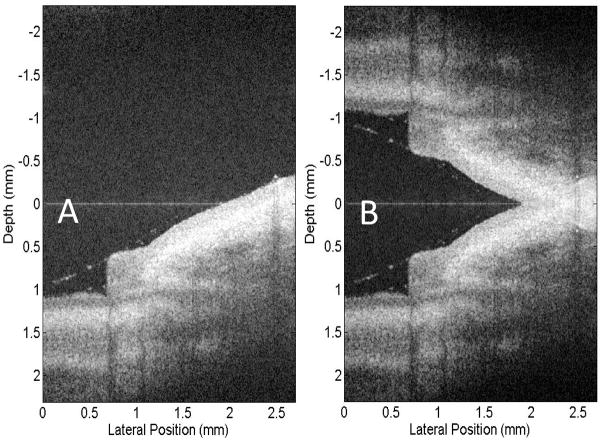
Figs. 6(A) and (B) present the imaging results obtained from a position of a fingernail near the nail fold region of a human volunteer. In this experiment we purposely tilted the finger surface relative to the B-scan direction so that the structural OCT image crossed over the zero-delay line. Also, we introduced an angle between the finger surface and C-scan (elevational) direction, which would make the place of the finger surface become higher and higher through the experiment. This situation is quite normal for in vivo applications. Fig. 6(A) and the associated movie show this process, in which the full range complex FDOCT images were obtained faithfully. In the beginning of this experiment, the finger was in the deep region of the positive side of the measurement range with little part of the finger crossed over to the negative frequency region of the measurement range. The position of the finger became higher and higher, and more and more parts of the finger crossed over the zero-delay line. At the end of the movie, most part of the finger was on the negative region of the measurement range. Throughout this process, the microstructures of the finger were always successfully reconstructed, even though the finger movement was evident during the experiment (see attached movie file). Here we also processed the same data cube using standard FDOCT, illustrated in Fig. 6(B). Because standard FDOCT method directly deals with the real valued functions, it cannot eliminate the mirror images. In this case, it is very hard to reconstruct the microstructures of the sample, because the position of the sample was already beyond the positive side of the measurement range (see the attached movie files). Compared to standard FDOCT method, the benefit of full range complex FDOCT method demonstrated here is the capability of doubling the measurement range, which is quite useful for in vivo experiment.
Fig. 6.
OCT images extracted from the real time videos of a fingernail near the nail fold region that placed across the zero-delay line: (A) Full range complex FDOCT approach, (B) FDOCT approach. The physical size shown is 2.7 × 4.4 mm2 (lateral × depth). [See the associated movies]
5.2 Ex vivo experiment
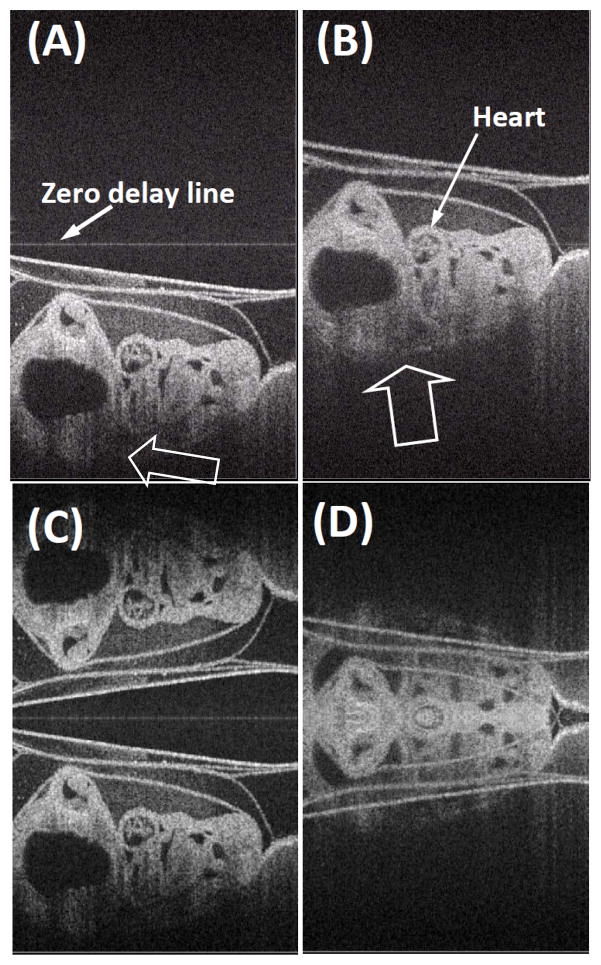
Next, we performed two ex vivo experiments on a motionless chicken embryo using our high speed full range complex FDOCT system. Before the experiments, we incubated the embryo about 3 days and then the embryo was euthanized with an arterial injection of pentobarbital (50 mg kg-1) and saturated KCl solution. The left column of Fig. 7 is the reconstructed OCT images obtained by keeping the embryo under the zero-delay line, while the right column shows the image obtained by placing the embryo over the zero-delay line. The top row images were obtained by the full range complex FDOCT method, while the bottom row images were obtained by the standard FDOCT approach. In the first experiment, i.e., keeping the sample under the zero-delay line, both the full range complex FDOCT approach and the standard FDOCT approach can reconstruct the microstructure of the chick embryo in most cases. However, towards end of imaging, as shown in the associated movies (A) and (C), only the full range complex FDOCT approach successfully interprets the microstructures of the embryo. This is because the complex conjugate mirror images were rejected in the full range complex FDOCT approach. In the second experiment, i.e., keeping the specimen across the zero-delay line, only the full range complex FDOCT approach can successfully reconstruct the microstructures of the embryo [Fig. 7(B)]. The microstructures obtained using standard FDOCT approach is completely deteriorated by the overlapping of its mirror images [Fig. 7(D)]. By comparing Figs. 7(A) and 7(B), one could clearly view the sensitivity advantage of full range complex FDOCT system around the zero-delay line. Although the conventional FDOCT could be used to obtain well reconstructed microstructures of the most parts of embryo in both sides of the zero-delay line, it sacrifices the sensitivity advantage near the zero delay line and also decreases the effective imaging depth. Thus this degradation of system sensitivity for the far field measurement range decreases the imaging contrast for microstructures located at deeper regions in the embryo, for example the microstructures pointed by the arrows in Fig. 7(A). However, if the embryo was placed across the zero-delay line, we could take the advantages of higher sensitivity of the system around the zero delay line. The image in Fig. 7(B) demonstrates the sensitivity advantage for imaging microstructures that cross the zero delay line. Because the system sensitivity around the zero delay line is high, the imaging contrast at the deep region of the embryo is enhanced, e.g., the microstructures pointed by arrows in Fig. 7(B), which would be otherwise invisible in Fig. 7(A). Consequently, it will be advantageous in practice if the highest sensitivity (as shown in Fig. 2) of the system around the zero delay line region is utilized to visualize the deep microstructures within the sample.
Fig. 7.
OCT images extracted from the real time videos of a chicken embryo. (A) and (C) were obtained from the experiment where the sample was placed under the zero-delay line. (A) Full range complex FDOCT approach, (C) FDOCT approach. (B) and (D) were obtained from the experiment that the sample placed cross the zero-delay line. (B) Full range complex FDOCT approach, (D) FDOCT approach. The physical size shown is 2.7 × 4.4 mm2 (lateral × depth). [See the associated movies]
6. Conclusion
In this article, we described and presented a high speed full range complex FDOCT system. By applying beam offset method to introduce a modulation frequency and optimizing the control software package, we demonstrated an imaging speed of 47,000 A-scans per second. To the best of our knowledge, this is the highest imaging speed ever reported. The high speed full range complex FDOCT system was then applied to in vivo and ex vivo imaging experiments. With these experiments, we demonstrated the superior performance of full range complex FDOCT imaging. Compared to conventional FDOCT, full range complex FDOCT is able to provide double measurement range and higher system sensitivity. Especially in the ex vivo experiments, we obtained almost all depth information of the microstructure of the chick embryo by using the high speed full range complex FDOCT system, demonstrating its great potential for practical imaging applications. Although we demonstrated the full complex imaging at 47 kHz A-scan rate, the system reported here has no limitations on the imaging speed, thus offers a useful tool to achieve volumetric imaging of living samples where the high sensitivity region near the zero delay line can be utilized to improve the imaging quality.
Acknowledgments
The work was supported in part by research grants from the the National Institutes of Health (R01EB009682, R01HL093140 and R01DC010201) and the American Heart Association (0855733G). The content is solely the responsibility of the authors and does not necessarily represent the official views of grant giving bodies.
References
- 1.Choma MA, Sarunic MV, Yang C, Izatt J. Sensitivity advantage of swept source and Fourier domain optical coherence tomography. Opt Exp. 2003;11:2183–9. doi: 10.1364/oe.11.002183. [DOI] [PubMed] [Google Scholar]
- 2.Leitgeb RA, Hitzenberger CK, Fercher A. Performance of Fourier domain vs. time domain optical coherence tomography. Opt Exp. 2003;11:889–94. doi: 10.1364/oe.11.000889. [DOI] [PubMed] [Google Scholar]
- 3.Häusler G, Lindner MW. Coherence radar and spectral radar - new tools for dermatological diagnosis. J Biomed Opt. 1998;3:21–31. doi: 10.1117/1.429899. [DOI] [PubMed] [Google Scholar]
- 4.Wojtkowski M, Kowalczyk A, Leitgeb R, Fercher A. Full range complex spectral optical coherence tomography technique in eye imaging. Opt Lett. 2002;27:1415–7. doi: 10.1364/ol.27.001415. [DOI] [PubMed] [Google Scholar]
- 5.Leitgeb RA, Hitzenberger CK, Fercher AF, Bajraszewski Phase-shifting algorithm to achieve high-speed long-depth-range probing by frequency-domain optical coherence tomography. Opt Lett. 2003;28:2201–3. doi: 10.1364/ol.28.002201. [DOI] [PubMed] [Google Scholar]
- 6.Gotzinger E, Pircher M, Leitgeb RA, Hitzenberger C. High speed full range complex spectral domain optical coherence tomography. Opt Exp. 2005;13:583–94. doi: 10.1364/opex.13.000583. [DOI] [PMC free article] [PubMed] [Google Scholar]
- 7.Targowski P, Gorczynska W, Szkulmowski M, Wojtkowski M, Kowalczyk Improved complex spectral domain OCT for in vivo eye imaging. Opt Commun. 2005;249:357–62. [Google Scholar]
- 8.Ma Z, Wang RK, Zhang F, Yao J. Arbitrary three-phase shifting algorithm to achieve full range spectral optical coherence tomography. Chin Phys Lett. 2006;23:366–9. [Google Scholar]
- 9.Yasuno Y, Makita S, Endo T, Itoh M, Yatagai Simultaneous B-M-mode scanning method for real time Fourier domain optical coherence tomography. Appl Opt. 2006;45:1861–5. doi: 10.1364/ao.45.001861. [DOI] [PubMed] [Google Scholar]
- 10.Wang RK. In vivo full range complex Fourier domain optical coherence tomography. Appl Phys Lett. 2007;90:054103. [Google Scholar]
- 11.Creath K. Phase-measurement interferometry techniques. Prog Opt. 1988;26:349–393. [Google Scholar]
- 12.An L, Wang RK. Use of a scanner to modulate spatial interferograms for in vivo full-range Fourier-domain optical coherence tomography. Opt Lett. 2007;32:3423–3425. doi: 10.1364/ol.32.003423. [DOI] [PubMed] [Google Scholar]
- 13.Leitgeb Rainer A, Michaely Roland, Lasser Theo, Chandra Sekhar S. Complex ambiguity-free Fourier domain optical coherence tomography through transverse scanning. Opt Lett. 2007;32:3453–3455. doi: 10.1364/ol.32.003453. [DOI] [PubMed] [Google Scholar]
- 14.Mujat M, Chan R, Cense B, Park B, Joo C, Akkin T, Chen T, de Boer J. Retinal nerve fiber layer thickness map determined from optical coherence tomography images. Opt Express. 2005;13:9480–9491. doi: 10.1364/opex.13.009480. [DOI] [PubMed] [Google Scholar]
- 15.Werkmeister René M, Dragostinoff Nikolaus, Pircher Michael, Götzinger Erich, Hitzenberger Christoph K, Leitgeb Rainer A, Schmetterer Leopold. Bidirectional Doppler Fourier-domain optical coherence tomography for measurement of absolute flow velocities in human retinal vessels. Opt Lett. 2008;33:2967–2969. doi: 10.1364/ol.33.002967. [DOI] [PubMed] [Google Scholar]
- 16.Wang RK. Fourier domain optical coherence tomography achieves full range complex imaging in vivo by introducing a carrier frequency during scanning. Phys Med Biol. 2007;52:5897–5907. doi: 10.1088/0031-9155/52/19/011. [DOI] [PubMed] [Google Scholar]


