

Abstract
Territoriality in animal populations creates spatial structure that is thought to naturally buffer disease invasion. Often, however, territorial populations also include highly mobile, non-residential individuals that potentially serve as disease superspreaders. Using long-term data from the Serengeti Lion Project, we characterize the contact network structure of a territorial wildlife population and address the epidemiological impact of nomadic individuals. As expected, pride contacts are dominated by interactions with neighbouring prides and interspersed by encounters with nomads as they wander throughout the ecosystem. Yet the pride–pride network also includes occasional long-range contacts between prides, making it surprisingly small world and vulnerable to epidemics, even without nomads. While nomads increase both the local and global connectivity of the network, their epidemiological impact is marginal, particularly for diseases with short infectious periods like canine distemper virus. Thus, territoriality in Serengeti lions may be less protective and non-residents less important for disease transmission than previously considered.
Keywords: African lion, contact rates, epidemiological modelling, network model, territoriality, wildlife disease
1. Introduction
Populations living in small, spatially distinct groups are thought to be less vulnerable to disease invasion than species that form large groups [1,2]. However, in many territorial animal populations, some individuals travel widely as either temporary or chronic dispersers (e.g. birds, wolves, and mice [3–5]). If infected during an outbreak, these nomads can serve as superspreaders, infecting many individuals if they have numerous contacts [6,7] or connecting distant parts of a spatially structured population through long-range movements (e.g. seasonal dispersal of juvenile raccoons and jackals in rabies spread [8,9]).
Network models representing such complex contact patterns can provide valuable insights into the relationship between socio-ecology and disease dynamics [7,10,11]. Small-world networks are a particularly well-studied class of networks that combine two ubiquitous features of social, natural and engineered systems: local clustering (an individual's contacts tend to contact each other) and short path lengths (any two randomly selected individuals are just a few network steps apart [12,13]). Lattice networks are simple networks that consist of individuals (nodes) that are connected exclusively to nearby nodes. While lattice networks are highly clustered like small-world networks, they typically have very long path lengths. Traditional small-world measures cannot be calculated for disconnected networks; in these instances, ‘economic’ small-world metrics (i.e. efficiency statistics) can be used [14] and are useful for sparsely connected populations, such as territorial wildlife. In epidemiology, small-world contact networks tend to experience faster and larger outbreaks than comparable lattice networks [13,15]. Clustering produces strong saturation effects and wavelike epidemics [10], while short path lengths enable large-scale synchronized epidemics [16–18]. Disease-control strategies in small world populations must therefore include measures both to prevent long-distance dispersal and to ensure intensive local containment.
While much is known about heterogeneity in human contact patterns [7,19,20], the epidemiological structure of wildlife populations is poorly understood [21,22]. Only a few free-ranging wildlife study systems provide sufficient data for estimating contact patterns (but see [2,23–25]). The long-term dataset of the Serengeti Lion Project (SLP) is a uniquely rich source of such data, with decades of daily observations of African lion behaviour and movement [26].
Here, we estimate the contact network underlying the spread of directly transmitted infectious diseases within the Serengeti lion population. To do this, we estimate basic contact and movement parameters from limited (but relatively rich) empirical data sets and then feed these values into a mathematical model that simulates contact patterns and disease transmission between groups of lions. This model allows extrapolation from a geographically and temporally restricted dataset to long-term contact and disease dynamics throughout the Serengeti lion population. We use this data-driven model to characterize and then manipulate the network structure of the Serengeti population to study the roles of nomads and prides in driving disease dynamics for a range of infectious diseases. We test whether (i) territoriality produces lattice-like contact networks (in which contacts are exclusively local), and whether (ii) nomads make the network small world by linking prides across long distances. We show that the population structure of Serengeti lions is more connected than originally thought (and hence non-lattice), while the structural and epidemiological significance of nomads depends on the nature of the disease but is generally lower than anticipated.
2. Methods
2.1. Lion social system
Lions live in gregarious groups (prides) composed of related females and their dependent offspring [27]. Prides are territorial and infrequently contact their neighbours [28]; inter-pride encounters can be deadly [29–31]. When prides grow too large, young females split off and form a neighbouring pride [32] and are more tolerant of their non-pride relatives [33]. Coalitions of territorial males can reside in more than one pride [34] and distribute their time between their various prides [31]. By contrast, nomads (i.e. non-residential lions: mostly young dispersing males, but also some females and older males) do not maintain a territory and move great distances through the ecosystem [31]. Pride lions, resident male coalitions and nomads occasionally interact during mating, territorial defence and at kills.
2.2. Data sources
In order to estimate lion social network parameters, we extracted information from 22 years of the 45-year SLP study (1985–2007), using the highest resolution data available for prides, territorial males and nomads. Although several of our parameters were estimated during different time periods, lion movement and contact patterns have remained stable across decades [33,35,36], thus these estimates can be merged in a single model. We measured lion demographic structure and contact patterns from data collected between 1985 and 1992. The time, location and identity of each lion and descriptions of any interactive behaviour were recorded for sightings of 250–275 individually recognized individuals from 21 to 25 prides (totalling 12 121 individual lion sightings). These data were concurrent with a detailed study involving 35 four-day continuous follows of pride females [37,38]; lion population size was statistically homogeneous from 1985 to 1992 (for details, see [26]).
To quantify movement patterns of nomads we used data from three GPS-collared nomads in the Serengeti, the locations of which were recorded two to five times per day for periods up to nine months between 2005 and 2007 (for an example of one nomad, see figure 1), and from seven other nomads that were tracked with VHF collars for 7–28 months between 1989 to 1992. To characterize the rate at which Serengeti territorial males switched between prides, we used behavioural observations of 10 VHF-collared males that were simultaneously resident in two or more prides between 1985 and 2004.
Figure 1.

Comparison of actual and simulated lion populations with illustrations of territory, contact and transmission networks. (a) Irregular background shapes represent 70% kernel pride territories; nodes represent pride centroids [58]; edges represent neighbouring prides. (b) Simulated lion territory network with nodes (prides) and edges indicating neighbouring territories. (c) Daily locations of a GPS-collared nomad in Serengeti National Park (SNP) and Ngorongoro Conservation Area (NCA) in 2006–2007. Spatio-temporal locations for two-week intervals (represented by month then day in the legend) are represented by shades of grey. (d) Simulated nomad with grey shades representing daily locations for the same temporal scale (two-week intervals). (e) Simulated territory network where the red box represents the same spatial scale as figure 1b. (f) Simulated contact network for both nomads and prides where dark blue edges represents nomad-mediated contacts, green, cyan and red edges represent contacts at territory distances one, two or greater than two, respectively. (g) Simulated transmission network showing only infected prides and contacts during which transmission occurred.
2.3. Parameter estimation
For most model parameters described in the subsections below, we characterized the entire distribution of values rather than single summary statistics (table 1). Unless otherwise specified, we used maximum likelihood estimation (MLE) to fit the parameters for seven candidate distributions (Poisson distribution and discretized exponential, normal, lognormal, power law, truncated power law, and gamma distributions), and then applied the Akaike Information Criterion (AIC) to select the most appropriate distribution.
Table 1.
Demographic, contact and epidemiological parameters for Serengeti lion prides and nomads.
| estimated valuesa | reference | |
|---|---|---|
| demographic parameters | ||
| A, area of ecosystem | 10 000 km2 | SLP data |
| Np, no. of prides in ecosystem | 180 | SLP data |
| Xp, pride sizes (number of females and cubs over three months old) | Xp ∼ Gamma (k, θ) with k = 2.226 (0.636), θ = 4.707(1.243) (mean pride size = 10.48) | SLP data |
| η, fraction of prides sharing males | 0.117 (s.e. = 0.078) | SLP data |
| ς, rate at which coalitions switch prides | 0.25 (0.12) switches per day | SLP data |
| Mneigh, neighbouring prides model |
 b; α = 1.483 (0.225), β = −0.386(0.041) (mean number neighbouring prides = 7.36) b; α = 1.483 (0.225), β = −0.386(0.041) (mean number neighbouring prides = 7.36) |
SLP data |
| Ψ, proportion of prides recently ‘split off’ | 0.063 (s.e. = 0.021) | SLP data |
| NN, number of nomads | 180 | SLP data |
| XN, nomad group sizes | XN ∼ Λ(μ, σ) with μ = 0.292 (0.065), σ = 0.446 (0.046) (mean group size = 1.51) | SLP data |
| Mnomad, nomad migration model; horizontal (x) and vertical (y) displacements in km per two weeks are given by gamma distributions | Dispx∼γ(kx, θx) with kx = 2.9913, θx = 1.0767c; Dispy ∼ γ(ky, θy) with ky = 3.5242, θy = 1.0114d | M. Craft (2005–2007, unpublished data) |
| contact parameters | ||
| Cp, rate of pride–pride contacts | 4.55 (0.573) contacts per two weeks | SLP data |
| Mcontact, contact weighting model |
 ;
α = 3.265 (0.371); βd = 1.698 (0.264); βs = 0.696(0.220) ;
α = 3.265 (0.371); βd = 1.698 (0.264); βs = 0.696(0.220) |
SLP data |
| CN, per pride rate of pride–nomad contacts | 7.136 (1.018) contacts per two weeks | SLP data |
| G, pride group size during contactf; G′= log(G + 1) | G′ ∼ N(μG′, σG′) with μG′ = α+ β · Xp, σG′ =0.232 (0.022); α = 0.447 (0.057), β = 0.014 (0.004) (mean group size = 3.65) | SLP data |
| epidemiological parameters | ||
| ɛ, incubation period (days) | ɛ ∼ Exp (λ) with λ = 1/7 | [59] |
| ι, infectious period (days) | ι ∼ Exp(λ) with λ =1/140 to 1/14 | n.a. |
| T, per contact transmission probability | 0.04 | n.a. |
aUnless otherwise indicated, values are means and numbers in parentheses are standard deviations. s.e. indicates standard error.
bSAB = the no. of pride centroids located in the union of two regions: (i) the semicircle with straight-edge centred at A that runs through B, and (ii) the semicircle with straight-edge centred at B that runs through A (see electronic supplementary material, figure SA3).
cHorizontal displacement is the difference between randomly chosen right and left displacements, both distributed γ(kx, θx).
dSimilarly, vertical displacement is the difference between randomly chosen variables, both distributed γ(ky, θy).
ewc(A,B) is the estimated probability that pride A will contact pride B per daylight hour of observation of A; dt(A,B) is the territory distance between the prides.
fTo correct for increasing variance in group size with increasing pride size, we transformed group size by G′= log(G + 1).
2.3.1. Pride sizes and locations
Pride sizes were calculated as the number of females and cubs over three months old; pride sizes followed a gamma distribution (Xp) (table 1; see electronic supplementary material, figure SA1a). By extrapolating lion densities from the woodland region of the 2000 km2 study area [26] to the rest of the 10 000 km2 ecosystem (A) with similar habitat, we estimated a total of 180 prides (Np). The boundaries of each pride territory was approximated by its 70 per cent kernel over a 2 year period [35]; the average distance between prides was approximated by the Euclidean distances between territory centroids (conceptual centre of mass, or the centre of an irregular territory [36]). We considered two prides to be neighbours if their territories overlapped, touched or were not separated by another pride territory (figure 1a). This gives rise to a territory network where nodes represent prides and edges connect neighbouring prides (figure 1b,e). We define the territory network distance to be the shortest path between any two prides in the territory network.
2.3.2. Pride–pride contact rates
Lion prides are fission–fusion societies where lions associate in temporary subsets and frequently contact all members of their pride. However, very small cubs (less than three months) only associate with their mother [31,39] and were never observed to participate in any pride-to-pride contacts. We defined a potential disease contact to be an interaction in which lions from two different prides (or a pride lion and a nomad) come within 1 m of each other (e.g. close proximity, chases, fights) or eat from the same food source within a short period of time (sequential or simultaneous feeding). From the empirical sightings data, there were 36 pride–pride contacts per 1294 hours of daylight observation, translating to 4.55 contacts per two weeks initiated by each pride (Cp). We found comparable contact estimates from focal-follow data and found no significant differences between day and night contact rates (see electronic supplementary material, appendix B).
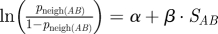
We performed multivariate logistic regression analysis to determine which of the following factors significantly affect the likelihood that any two prides (A and B) will come in contact: (i) Euclidean distance between the centroids of the pride territories (xdist), (ii) territory network distance between prides (xnet), (iii) the number of lions in pride A (xnum), and (iv) whether or not the two prides had originated from the same pride within the last 2 years (xsplit). Only territory network distance and recent pride split (relatedness) had significantly non-zero coefficients (p < 0.0001 and p = 0.0019, respectively; see electronic supplementary material, appendix C) and significant effects in likelihood ratio tests (p < 0.0001 and p = 0.0078, respectively), giving rise to the logistic model Mcontact (table 1). We note that Euclidean distance correlates significantly with network distance, and is a significant predictor of contact rates when considered alone. The probability of contacts between prides is highest for closely related prides that are immediate neighbours, and lowest for unrelated prides that are distant from each other in the territory network. We also estimated the fraction of neighbouring prides that split from one another (Ψ) (table 1).
2.3.2.1. Neighbouring prides
To determine the probability that two prides will have neighbouring territories (pneigh(AB)), we evaluated various models, including Euclidean distance between pride centroids and other geometric relationships (see electronic supplementary material, appendix D), and chose the model with the lowest AIC (Mneigh) (table 1). In other words, we found a model (Mneigh) that generates a geometric organization of prides that is statistically (see electronic supplementary material, appendix D) and visually similar to the empirical system (compare figure 1b,e with figure 1a).
2.3.2.2. Contact group size
Any given inter-pride contact involves one or more lions from each pride. Using linear regression, we found that the number of lions in a contact group (G) from a single pride depends significantly on the size of that pride (p = 0.003), with an average of 3.65 lions per pride participating in each contact (see electronic supplementary material, appendix D).
2.3.3. Territorial males
During the study period, 88.3 per cent of territorial coalitions resided with a single pride and the remaining 11.7 per cent associated with two prides (η). For the two-pride coalitions, the 10 radio-collared territorial males switched between prides on average once every 4.0 days (ς).
2.3.4. Nomadic lions
Based on records of individually identified nomads in the study area, we estimated NN = 180 total nomads in the ecosystem partitioned into groups with a mean group size of 1.5 individuals, where the group size (XN) follows an approximately lognormal distribution (see the electronic supplementary material, figure SA1b). From the empirical sightings data, nomads contact prides at a uniform rate approximating 7.136 contacts per two-week period (CN).
At small timescales, nomad displacements from GPS radio collar data showed high variance owing to occasional long-range movements, while at long time scales, displacements resembled Brownian motion (random movements). The data statistically resembled a type of Lévy random walk, specifically, two independent variance gamma (VG) processes [40,41] which correspond to movement with north–south and east–west orientations (Mnomad) (table 1; see electronic supplementary material, appendix E). An example of a simulated nomad's movement is shown in figure 1d. The distributions of 24-hour displacements for the three GPS-collared nomads do not differ significantly (Kruskal–Wallis p = 0.1078) nor do they differ significantly from pooled displacements of seven other VHF-collared nomads (see electronic supplementary material, figure SA5a). The x and y-displacements of a model nomad simulated using Mnomad were not statistically different from the pooled displacements of the three GPS-collared nomads (two-sample Kolmogorov–Smirnov (K–S) test, x-displacement: p = 0.5856, y-displacement: p = 0.9894; see electronic supplementary material, figure SA5b).
2.4. Simulating contact networks and disease transmission
We developed a simulation-based model of lion contact patterns and the consequent spread of disease via those contacts [42]. For the analyses described below, we used point estimates of mean parameter values as given in table 1.
2.4.1. Initial conditions
In the model, Np prides with pride sizes Xp are placed at random locations in an A km2 planar region. Pairs of prides are assigned as neighbours according to model Mneigh; these adjacencies form the edges of the territory network (figure 1e). The resulting distributions of number of neighbouring prides per pride are statistically similar to those calculated from the study population (bootstrap K–S test: p = 0.533, see electronic supplementary material, appendix D). A fraction of neighbouring pairs are randomly selected to have recently split (Ψ) and to share territorial males (η). Each of NN nomad groups with group size XN is initially assigned to the territory of a randomly selected pride.
2.4.2. Contacts among pride and nomad groups
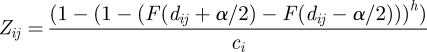
The rate of contacts between two prides is given by Cp and Mcontact; these probabilities are used to stochastically create networks that are then considered fixed for the duration of a disease simulation. Specifically, when a pride initiates a contact, the other pride is selected using (normalized) probabilities given by a logistic function of their territory distance and whether they recently split (Mcontact). To determine the contact group size (G) for each interacting pride, we sample G′ from a normal distribution with a mean μG′ and standard deviation σG′, and calculate G = exp (G′) − 1 (table 1; see electronic supplementary material, figure SA6). Territorial males and nomads are treated separately from prides of females and cubs. If a territorial coalition of males is associated with two prides, it will switch between prides with probability μ = 1 − exp(ς h) where h is a small time step and ς is the rate at which territorial males switch prides. In any small time step h, the nomads will migrate from the territory of the current pride (i) to that of another pride (j) with a probability given by
 |
2.1 |
where F() is the cumulative distribution function for displacement over a two-week period; dij the distance between the centroids of territories i and j; α the average pride territory width ( ); and ci a normalizer. Each nomad group is assumed to contact the local pride at rate (CN) while only a subset of the pride (G) is involved in contacts with nomads or other prides.
2.4.3. SEIR infectious disease dynamics
We model disease dynamics on the contact network using a stochastic SEIR (susceptible–exposed–infectious–recovered) model in a closed population without demographics (no births, deaths or migration) and assume that the population is epidemiologically naive (i.e. there is no immunity to the invading disease; see electronic supplementary material, appendix H; [42]) For each run of the model, we generated a new lion territory network, used the mean parameter values given in the estimated values column of table 1, and randomly chose an initial infected pride. We previously performed a sensitivity analysis of the model to changes in all of the demographic, contact and epidemiological parameters listed in table 1 [42]. Notably, we varied the proportion of prides sharing males from 0 to 0.35, the territorial male movement rate from never to every other day, and the daily distances travelled by nomads from 0 to 7 km; and we found that the disease dynamics proved robust to such variation ([42], fig. S2). In addition, we assessed the impact of nomad movement patterns on disease dynamics by increasing the nomad migration rate to unrealistically high values and removing nomads altogether; and these extreme perturbations did not substantially alter the disease dynamics ([43], ch. 2, fig. 7).
The results described below are based on 2925 simulated epidemics: 325 simulations at each recovery rate between 0.1 to 0.9 in steps of 0.1, and because recovery rate is the inverse of infectious period this corresponds to mean infectious periods between two and 20 weeks. Because interacting groups tend to be small and contacts are often prolonged and interactive, we assume that each lion contacts every lion from the other group during the interaction (density dependence). The transmissibility parameter T is the probability that disease transmission occurs during a contact between an infected and susceptible lion. We set T = 0.04, which is the transmissibility value where nomads cause the highest proportion of transmission events. Thus, any apparent impact of nomads is an upper estimate of their epidemiological significance.
2.4.4. Generating disease-specific contact networks
The contact networks along which pathogens spread depend on the mode of transmission and the duration of infectiousness. In this study, we have focused on contacts such as close proximity (fighting, mating) and sequential feeding (displacing other lions and then immediately feeding on the same carcass) that can lead to the transmission of respiratory and droplet-borne diseases (such as canine distemper virus, feline herpes virus, or feline calicivirus). To address the impact of the infectious period (and hence various infectious diseases), we generated different contact networks across a range of recovery rates. During its infectious period, a pride will contact other prides at the rate proportional to  , where
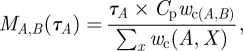
  is the estimated probability that pride A will contact pride B per daylight hour of observation of A. (Mcontact; for a detailed discussion of pride infectious periods, see electronic supplementary material, appendix H.) The number of contacts from pride A to pride B over the infectious period of A is a Poisson random variable with mean
 |
2.2 |
where τA is the random infectious period of A. We generated a directed static network of contacts between prides by generating an infectious period τA from an exponential distribution for each pride A; generating a sequence of random values {cA,B} from the Poisson (MA,B(τA)) distribution for each pair of prides A and B; and creating a directed link from pride A to B if cAB > 0.
Contacts mediated by nomadic lions were modelled by simulating a random walk of a nomad group from pride to pride over an exponentially distributed infectious period. If a nomad group visited both prides A and B during its infectious period, an undirected link was created between A and B. This procedure was repeated for each nomad group X; an example of a contact network illustrating pride–pride and pride–nomad–pride contacts are shown in figure 1f.
2.5. Estimating small-world properties
To determine the extent to which the contact networks possessed small-world properties, we generated networks with and without nomadic lions while varying the recovery rate. Specifically, we created 20 random populations, and for each one, simulated 10 networks at each population/recovery combination. To assess the impact of network size on small world properties [12], we also created four larger hypothetical networks of 900 prides and, for each one, simulated 25 networks at each population/recovery combination.
The defining properties of small-world networks are high clustering and small characteristic path lengths [13]. The lion networks can consist of multiple disconnected components (i.e. some pairs of prides are not connected by any path through the contact network). Since the traditional small world metrics cannot handle multiple components, we instead calculated network efficiency which gauges ‘how well information propagates over the network’ [14]. Small-world networks have the unique property of being both locally and globally efficient [44]. Global efficiency increases as path length decreases while local efficiency increases with clustering. Specifically, the global efficiency of a network R is given by
 |
2.3 |
where dA,B is the shortest path between prides A and B and N is the number of prides in the network. Local efficiency measures the redundancy of connections and is defined Elocal(A): = E(RA), where RA is the subgraph that includes all neighbours of A and any edges connecting those neighbours to each other (but not A itself). Our results are in terms of the mean local efficiency,
| 2.4 |
Since disease transmission through contact networks loosely resembles information transmission (for example, through neural networks, social networks, communication networks and transportation systems), these quantities should reflect global and local epidemiological vulnerability [14].
3. Results
3.1. Neighbouring prides and nomad migration drive contact patterns
The Serengeti lion population is a mix of pride-to-pride and transient nomad-to-pride contacts. Prides are classified as neighbours if their territories abut and/or do not have any other pride territories located between them (Mneigh, figure 1a,b). This produces a territory network that strongly influences contact patterns (Mcontact, figure 1e), but is not equivalent to the actual contact network along which disease spreads (figure 1f). The probability of contact between any two prides falls off sharply with territory distance (Mcontact). The contact network for a given set of prides and a specified disease will be dominated by edges between neighbouring prides, but will not necessarily include all such edges or exclude edges between more distant prides (figure 1f).
Nomads tend to move short distances punctuated by occasional long-range moves (see electronic supplementary material, appendix E, figure 1c,d). As they roam, they occasionally encounter pride lions and thereby have opportunities to catch and spread disease. A nomad-mediated contact between two prides A and B is a sequence of two encounters, one between pride A and a nomad group followed by another between the same nomad group and pride B. Remarkably, the average distance between prides involved in nomad-mediated contacts (that could potentially lead to disease transmission) is considerably less than that between prides involved in direct infectious contacts (figure 2). This discrepancy decreases slightly as recovery rate decreases, since longer infectious periods provide more opportunities for nomads to migrate and thereby contact more distant prides.
Figure 2.

Average Euclidean distance (kilometres) connecting prides involved in infectious contacts (figure 1f) across a range of different recovery rates; this is shown for pride–pride and nomad-mediated pride contacts. This figure is based on the Serengeti-sized ecosystem (180 prides) with 200 simulations at each of the eight recovery rates (total of 1600 runs). Values are averages across all edges in the network.
Thus nomads fail to provide geographical shortcuts for a spreading disease, and in turn make poor candidates for superspreading. By contrast, prides are surprisingly well connected. One explanation is that prides that are considered ‘neighbours’ can actually be located quite far apart, especially lions that reside in low-density habitats. Secondly, although a pride is five and 30 times more likely to contact a neighbouring pride (from which it did not share a recent split) than a pride at territory distance two or three, respectively, such long-distance contacts serve to connect distant prides.
3.2. Lion contact networks are small world
Pride–pride networks—which are largely (but not exclusively) driven by the underlying lattice-like territory networks—turn out to be a small world. Values of global efficiencies (path length) are comparable to values classified as small world by Latora & Marchiori [14] (i.e. 0.28 to 0.69), even when nomad-mediated contacts are excluded (figure 3, prides only). The local efficiency, however, is lower than other empirical networks mentioned in Latora & Morchiori [14] (i.e. 0.26 to 0.8) as a result of the highly directed structure of our networks.
Figure 3.

(a) Global and (b) local efficiencies for both a Serengeti-sized (180 prides) and Enlarged hypothetical network of 900 prides, with and without nomads. For each network, and at each recovery rate, 200 simulations were run. The Neighbouring prides only network is Serengeti-sized and excludes all pride–pride contacts between non-neighbouring prides. It has a local efficiency identical to the Prides only networks and thus is not included in the local efficiency graph.
To test whether the small-world property stems from direct contacts among non-neighbouring prides, we set the probability of contact to zero for all non-neighbouring prides and generated a range of networks. The resulting planar networks had significantly lower global efficiency (figure 3, neighbouring prides only) and identical local efficiency to a network without nomads (figure 3, prides only). This suggests that direct contacts between non-neighbouring prides, while rare, yield global connectivity and contribute to the ‘small worldliness’ of lion networks.
Although the pride–pride networks are already small world, nomads further increase the local and global efficiency of the population (figure 3, prides + nomads). Intuitively, in all scenarios, efficiency declines as recovery rate increases (i.e. as infectious period decreases) simply because each infected lion has less time to make contacts. Direct contacts among non-neighbouring prides approximately double global efficiency (compared to the network consisting only of neighbouring prides), thereby transforming the pride–pride network from a planar graph into a small-world network; while nomads increase global efficiency by roughly 50 per cent, they do not qualitatively alter the network structure of the population. Although nomads have a much more pronounced effect on local efficiency, local efficiency is not expected to have significant epidemiological repercussions. The observed global efficiencies run counter to our prior expectations that (i) pride–pride contacts themselves would be almost exclusively local (not small world). and (ii) long-range contacts via nomads would therefore transition the population from a planar network into a small world network. Below, we show that this relatively modest impact of nomads on network structure translates into a similarly modest epidemiological impact (figure 4c).
Figure 4.

Epidemiological impact of nomads. (a) Probability of an epidemic and (b) average prevalence in an epidemic versus recovery rates both with and without nomads at T = 0.04. Insets: differences between epidemic probabilities in runs with and without nomads. Each point in these figures is calculated from 325 random SEIR simulations at the stated recovery rate, assuming the point estimated parameter values given in the second column of table 1. Probabilities in (a) are fraction of simulated outbreaks that reach at least 30% of prides in the ecosystem; average prevalences in (b) are mean fractions of prides infected across such epidemics; and differences are simply each blue value minus the corresponding green value. (c) Estimated sources of transmission to prides. Values indicate proportion of transmission events to prides from nomads, neighbours (directly adjacent prides: d = 1), prides two steps away in the territory network (d = 2), prides three steps away in the territory network (d = 3), and ‘Other’ that consists of territorial males and prides at territory distances greater than 3.
In the hypothetical larger network of 900 prides, global efficiency is considerably lower, since path lengths are larger (figure 3a, enlarged). The ecosystem becomes large relative to the geographical scale of contacts between lions, and the geographical nature of the contact network thus becomes more obvious. As recovery rate increases, there is less time for contacts so the network becomes sparser. The enlarged pride-only network has global efficiency on par with the smaller (planar) network restricted to neighbouring pride interactions: in this context, the longer-range pride–pride contacts are short relative to the expanse of the ecosystem. The addition of nomads increases the global efficiency to a range comparable to other small world networks [14], but still lower than that of the smaller population, both with and without nomads (figure 3a, enlarged: prides + nomads). Intuitively, the local structure of the network does not change with the overall size of the network (figure 3b), and hence local efficiency is not strongly affected by ecosystem size.
3.3. Infectious disease dynamics
Once a disease is introduced onto the contact network, the resulting transmission network is the set of edges and nodes along which a disease actually spreads (figure 1g). We used stochastic SEIR simulations to test the hypothesis that nomads only marginally increase the efficiency of disease transmission through the population. Indeed, nomads made only modest impacts on disease dynamics. Both the average prevalence and probability of an epidemic increase as recovery rates decrease and are only slightly enhanced when nomads are included in the network (figure 4a,b). Nomads have the greatest impact on the probability and prevalence of an epidemic at recovery rates around 0.5 (one month infectious period). The SEIR simulations show that transmission is mostly pride–pride; with neighbouring prides accounting for more than 50 per cent of transmissions and nomads only accounting for 5–10% of transmissions (while the combined impact of territorial males and prides at territory distances greater than three is negligible; figure 4c). The impact of nomads increases slightly as recovery rate decreases (infectious period lengthens).
4. Discussion
We previously used a network-based model to (i) investigate sampling and scaling issues from typical wildlife samples, and (ii) study a fatal 1993–1994 outbreak of canine distemper virus (CDV) among Serengeti lions [42]. Although the data suggested that the 1993–1994 outbreak was probably fuelled by multiple hosts, our analysis suggested that the lion population was sufficiently well connected to allow outbreaks of CDV-like infectious diseases to percolate through the entire lion population, even without multiple introductions from other species. Here, we have more deeply investigated the nature of this connectedness—the relative roles of prides and nomads—and its implications for a broader range of diseases. We approached this study with the naive hypothesis that (i) territorial animals that are averse to between-group interactions would have lattice-like contact networks with high clustering and long path lengths, and (ii) migrating groups probably play a crucial role in forging long-range connectivity by shortening path lengths. Instead, we found that occasional long-range contacts between non-neighbouring prides (at territory distances greater than one) are sufficient to make the network small world (shorten path lengths), even without considering nomads. Although nomads make up approximately 40 per cent of the epidemiological units in the population (approx. 119 groups of nomads versus 180 prides) and travel long distances, they do not qualitatively alter the structure of the network or, consequently, the fate of a disease outbreak.
The moderate epidemiological impacts of nomads vary slightly with recovery rate. For long infectious periods (low recovery rates), direct contacts between prides will themselves sustain large epidemics, thus leaving little room for nomads to make a significant impact. The impact of nomads is greatest for diseases with infectious periods lasting approximately one month. For example, feline calicivirus (FCV) is a highly contagious upper respiratory infection spread by direct contact [45] that is epidemic in the Serengeti lion population [46]. Half of infected domestic cats still shed calicivirus more than 75 days after initial infection [47]. By contrast, CDV in domestic dogs has a relatively short infectious period of approximately two weeks [48], during which there is little time for nomads to move between distant territories. Consequently, we would expect nomads to play a slightly more important epidemiological role in FCV outbreaks than CDV outbreaks (figure 4c). Most probably, nomads rarely serve as superspreaders, in contrast to previous suggestions for the 1993–1994 CDV outbreak [49]. This result is consistent with evidence that the fatal CDV epidemic was probably fuelled by multiple spillovers from other carnivore hosts such as jackals and hyenas rather than propagated by lions themselves [50].
Although our estimates of movement patterns by nomadic groups and shared territorial males are based on a relatively small sample of lions, our major findings—that pride-to-pride contacts form a small-world network and the additional nomad group contacts contribute only marginally to the epidemiological vulnerability of the population—seem robust. Two assumptions of the model merit further investigation. First, we assume that all pride lions older than three months have an equal probability of participating in a disease-transmitting contact event throughout the year. However, if enough data were available, we might see that contacts rates vary with age, by season (wet or dry) or by year (e.g. an El Niño year). These heterogeneities in contact rates could be modelled using weighted edges. Second, we assume that the lion population is immunologically naive and that prides move through each disease class as a unit. This will not be the case for endemic or recurrent epidemic diseases in which epidemiological history influences disease emergence and dynamics within and between prides.
Small-world statistics—clustering coefficient and average path length—are widely used to characterize the social and epidemiological structure of human and wildlife populations [12,13,21,51], but they have important limitations. Efficiency statistics, which measure similar quantities, are more versatile and provide a common framework for characterizing local and global properties of a network [14]. Specifically, they measure the efficiency with which information, disease, or other entities can transmit through a network while allowing for disconnected networks, weighted edges and other structural complexities. Because our lion networks can be disconnected, particularly for diseases with short infectious periods, we used local and global efficiency to measure the pride–pride and nomad-mediated connectivity of the population. The global efficiency estimates for the lion population corresponded with the predicted epidemiological vulnerability of the population (figure 3). However, the small-world property is strongly influenced by the size of the population. As the size of the ecosystem increased, its global efficiency decreased (that is, average path length increased) and the structural importance of nomads increased. This suggests that the small size of the Serengeti lion population may inherently limit the potential impact of nomads. In other words, territorial species in smaller populations (rare or endangered species) may not be as affected by nomads as group-living species living in larger populations.
Three other factors contribute to the surprising lack of epidemiological significance of nomadic lions. First, the pride–pride network can already efficiently transmit disease leaving little opportunity for nomads to play pivotal epidemiological roles. The infrequent but critical long-range contacts among resident prides in the Serengeti stems, in part, from temporary forays into areas of high food abundance following the wildebeest migration [37]. Thus, this result may only apply to populations that rely heavily on migratory prey, and/or occupy a relatively limited geographical area in which contacts between distant groups are feasible. Second, nomads move slowly relative to pride–pride disease transmission and therefore only slightly enlarge the geographical radius of connectivity. In other words, direct pride–pride transmission can produce epidemic waves that can move at least as fast as nomads migrate. Third, nomad groups tend to be significantly smaller than subgroups involved in interpride contacts (mean nomad group size is 1.5 whereas mean pride subgroup size is 3.7); and here we have assumed that the probability of disease transmission during a contact depends on the numbers of lions involved.
Territoriality has diverse consequences for the spread and control of several livestock and wildlife diseases. European badgers regularly transmit bovine TB to cattle and are highly territorial. In the UK, badger culling decreases bovine TB transmission locally but increases transmission to adjacent areas, probably through increased dispersal (although studies in Ireland show conflicting results; [52–54]). Thus, it seems that a stable territorial system (in the absence of culling) is relatively protective against disease spread. By contrast, territorial antelopes have higher macroparasite levels than non-territorial ones, probably owing to increased exposure to accumulated parasites in contaminated soil [55]. In this case, territoriality is a risk factor for disease. Although territoriality in Serengeti lions might provide an epidemiological buffer for very mildly contagious diseases, such protection appears to be quite limited.
Network models can identify high-risk populations to target for disease control [56,57]. Since direct pride–pride transmission rather than nomad-mediated transmission appears to be the driving epidemiological force within the Serengeti lion population, disease control efforts should focus on the more numerous, group-living, territorial pride members rather than nomads. However, this may not be the case for other territorial species, or even lions in other ecosystems, that have different species densities, total population size, and/or habitat constraints.
Acknowledgements
Thanks to M. Anderson, A. Mosser, and C. Souther for raw data or help with data extraction. We thank A. Pusey, A. Dobson, S. Cleaveland, K. Hampson, D. Haydon, M. Kaare, T. Lembo, E. Ernest, and members of the Boyd Orr Center for discussion and useful comments. Thanks to the Santa Fe Institute for providing a working visit for M. Craft and L. A. Meyers. This research was supported by NSF grants (DEB-0343960, DEB-0749097, DEB-0308486, DEB-0710070, EF-0225453, OISE-0804186) with additional funding from Lincoln Park Zoo, Sigma Xi, the U of MN's Graduate School and EEB Department, NIH grant (NIH 1-K01-AI-0914400-01) in support of E. Volz, and a grant from the James F. McDonnell Foundation to L. A. Meyers.
References
- 1.Altizer S., et al. 2003. Social organization and parasite risk in mammals: integrating theory and empirical studies. Annu. Rev. Ecol. Evol. Syst. 34, 517–547 10.1146/annurev.ecolsys.34.030102.151725 (doi:10.1146/annurev.ecolsys.34.030102.151725) [DOI] [Google Scholar]
- 2.Cross P. C., Lloyd-Smith J. O., Getz W. M. 2005. Disentangling association patterns in fission-fusion societies using African buffalo as an example. Anim. Behav. 69, 499–506 10.1016/j.anbehav.2004.08.006 (doi:10.1016/j.anbehav.2004.08.006) [DOI] [Google Scholar]
- 3.Greenwood P. J., Harvey P. H. 1982. The natal and breeding dispersal of birds. Annu. Rev. Ecol. Syst. 13, 1–21 10.1146/annurev.es.13.110182.000245 (doi:10.1146/annurev.es.13.110182.000245) [DOI] [Google Scholar]
- 4.Lidicker W. Z., Stenseth N. C. 1992. To disperse or not to disperse: who does it and why? In Animal dispersal: small mammals as a model (eds Stenseth N. C., Lidicker J. W. Z.), pp. 21–36 London, UK: Chapman & Hall [Google Scholar]
- 5.Mech L. D. 1987. Age, season, distance, direction, and social aspects of wolf dispersal from a Minnesota pack. In Mammalian dispersal patterns: the effects of social structure on population genetics (eds Chepko-Sade B. D., Halpin Z. T.), pp. 55–74 Chicago, IL: University of Chicago Press [Google Scholar]
- 6.Lloyd-Smith J. O., Schreiber S. J., Kopp P. E., Getz W. M. 2005. Superspreading and the effect of individual variation on disease emergence. Nature 438, 355–359 10.1038/nature04153 (doi:10.1038/nature04153) [DOI] [PMC free article] [PubMed] [Google Scholar]
- 7.Meyers L. A., Pourbohloul B., Newman M. E. J., Skowronski D. M., Brunham R. C. 2005. Network theory and SARS: predicting outbreak diversity. J. Theoret. Biol. 232, 71–81 10.1016/j.jtbi.2004.07.026 (doi:10.1016/j.jtbi.2004.07.026) [DOI] [PMC free article] [PubMed] [Google Scholar]
- 8.Loveridge A. J., Macdonald D. W. 2001. Seasonality in spatial organization and dispersal of sympatric jackals (Canis mesomelas and C. adustus): implications for rabies management. J. Zool. 253, 101–111 10.1017/S0952836901000097 (doi:10.1017/S0952836901000097) [DOI] [Google Scholar]
- 9.Russell C. A., Real L. A., Smith D. L. 2006. Spatial control of rabies on heterogeneous landscapes. PLoS ONE 1, e27. 10.1371/journal.pone.0000027 (doi:10.1371/journal.pone.0000027) [DOI] [PMC free article] [PubMed] [Google Scholar]
- 10.Keeling M. 2005. The implications of network structure for epidemic dynamics. Theoret. Popul. Biol. 67, 1–8 10.1016/j.tpb.2004.08.002 (doi:10.1016/j.tpb.2004.08.002) [DOI] [PubMed] [Google Scholar]
- 11.Meyers L. A. 2007. Contact network epidemiology: bond percolation applied to infectious disease prediction and control. Bull. (New Series) Am. Math. Soc. 44, 63–86 10.1090/S0273-0979-06-01148-7 (doi:10.1090/S0273-0979-06-01148-7) [DOI] [Google Scholar]
- 12.Humphries M. D., Gurney K. 2008. Network ‘small-world-ness’: a quantitative method for determining canonical network equivalence. PLoS ONE 3, e0002051. 10.1371/journal.pone.0002051 (doi:10.1371/journal.pone.0002051) [DOI] [PMC free article] [PubMed] [Google Scholar]
- 13.Watts D. J., Strogatz S. H. 1998. Collective dynamics of ‘small-world’ networks. Nature 393, 440. 10.1038/30918 (doi:10.1038/30918) [DOI] [PubMed] [Google Scholar]
- 14.Latora V., Marchiori M. 2003. Economic small-world behavior in weighted networks. Eur. Phys. J. B Condensed Matter and Complex Systems 32, 249–263 10.1140/epjb/e2003-00095-5 (doi:10.1140/epjb/e2003-00095-5) [DOI] [Google Scholar]
- 15.Keeling M. J., Rohani P. 2008. Modeling infectious diseases in humans and animals. Princeton, NJ: Princeton University Press [Google Scholar]
- 16.Keeling M. J., Eames K. T. D. 2005. Networks and epidemic models. J. R. Soc. Interface 2, 295–307 10.1098/rsif.2005.0051 (doi:10.1098/rsif.2005.0051) [DOI] [PMC free article] [PubMed] [Google Scholar]
- 17.Kuperman M., Abramson G. 2001. Small world effect in an epidemiological model. Phys. Rev. Lett. 86, 2909. 10.1103/PhysRevLett.86.2909 (doi:10.1103/PhysRevLett.86.2909) [DOI] [PubMed] [Google Scholar]
- 18.Moore C., Newman M. E. J. 2000. Exact solution of site and bond percolation on small-world networks. Phys. Rev. E 62, 7059. 10.1103/PhysRevE.62.7059 (doi:10.1103/PhysRevE.62.7059) [DOI] [PubMed] [Google Scholar]
- 19.Mossong J. l., et al. 2008. Social contacts and mixing patterns relevant to the spread of infectious diseases. PLoS Med. 5, e74. 10.1371/journal.pmed.0050074 (doi:10.1371/journal.pmed.0050074) [DOI] [PMC free article] [PubMed] [Google Scholar]
- 20.Read J. M., Eames K. T. D., Edmunds W. J. 2008. Dynamic social networks and the implications for the spread of infectious disease. J. R. Soc. Interface 5, 1001–1007 10.1098/rsif.2008.0013 (doi:10.1098/rsif.2008.0013) [DOI] [PMC free article] [PubMed] [Google Scholar]
- 21.Krause J., Croft D., James R. 2007. Social network theory in the behavioural sciences: potential applications. Behav. Ecol. Sociobiol. 62, 15–27 10.1007/s00265-007-0445-8 (doi:10.1007/s00265-007-0445-8) [DOI] [PMC free article] [PubMed] [Google Scholar]
- 22.Wey T., Blumstein D. T., Shen W., Jordan F. 2008. Social network analysis of animal behaviour: a promising tool for the study of sociality. Anim. Behav. 75, 333–344 10.1016/j.anbehav.2007.06.020 (doi:10.1016/j.anbehav.2007.06.020) [DOI] [Google Scholar]
- 23.Godfrey S., Bull C., James R., Murray K. 2009. Network structure and parasite transmission in a group living lizard, the gidgee skink, Egernia stokesii. Behav. Ecol. Sociobiol. 63, 1045–1056 10.1007/s00265-009-0730-9 (doi:10.1007/s00265-009-0730-9) [DOI] [Google Scholar]
- 24.Grear D. A., Perkins S. E., Hudson P. J. 2009. Does elevated testosterone result in increased exposure and transmission of parasites? Ecol. Lett. 12, 528–537 10.1111/j.1461-0248.2009.01306.x (doi:10.1111/j.1461-0248.2009.01306.x) [DOI] [PubMed] [Google Scholar]
- 25.Porphyre T., Stevenson M., Jackson R., McKenzie J. 2008. Influence of contact heterogeneity on TB reproduction ratio R0 in a free-living brushtail possum Trichosurus Vulpecula population. Veterinary Res. 39, 31. 10.1051/vetres:2008007 (doi:10.1051/vetres:2008007) [DOI] [PubMed] [Google Scholar]
- 26.Packer C., Hilborn R., Mosser A., Kissui B., Borner M., Hopcraft G., Wilmshurst J., Mduma S., Sinclair A. R. E. 2005. Ecological change, group territoriality, and population dynamics in Serengeti lions. Science 307, 390–393 10.1126/science.1105122 (doi:10.1126/science.1105122) [DOI] [PubMed] [Google Scholar]
- 27.Packer C., Gilbert D. A., Pusey A. E., O'Brieni S. J. 1991. A molecular genetic analysis of kinship and cooperation in African lions. Nature 351, 562–565 10.1038/351562a0 (doi:10.1038/351562a0) [DOI] [Google Scholar]
- 28.Packer C., Lewis S., Pusey A. E. 1992. A comparative analysis of non-offspring nursing. Anim. Behav. 43, 265–281 10.1016/S0003-3472(05)80222-2 (doi:10.1016/S0003-3472(05)80222-2) [DOI] [Google Scholar]
- 29.Grinnell J., Packer C., Pusey A. E. 1995. Cooperation in male lions: kinship, reciprocity or mutualism? Anim. Behav. 49, 95–105 10.1016/0003-3472(95)80157-X (doi:10.1016/0003-3472(95)80157-X) [DOI] [Google Scholar]
- 30.McComb K., Pusey A., Packer C., Grinnell J. 1993. Female lions can identify potentially infanticidal males from their roars. Proc. R. Soc. Lond. B 252, 59–64 10.1098/rspb.1993.0046 (doi:10.1098/rspb.1993.0046) [DOI] [PubMed] [Google Scholar]
- 31.Schaller G. B. 1972. The Serengeti lion; a study of predator–prey relations. Chicago, IL: University of Chicago Press [Google Scholar]
- 32.Pusey A. E., Packer C. 1987. The evolution of sex-based dispersal in lions. Behaviour 101, 275–310 10.1163/156853987X00026 (doi:10.1163/156853987X00026) [DOI] [Google Scholar]
- 33.VanderWaal K. L., Mosser A., Packer C. 2009. Optimal group size, dispersal decisions and postdispersal relationships in female African lions. Anim. Behav. 77, 949–954 10.1016/j.anbehav.2008.12.028 (doi:10.1016/j.anbehav.2008.12.028) [DOI] [Google Scholar]
- 34.Bygott J. D., Bertram B. C. R., Hanby J. P. 1979. Male lions in large coalitions gain reproductive advantages. Nature 282, 839–841 10.1038/282839a0 (doi:10.1038/282839a0) [DOI] [Google Scholar]
- 35.Mosser A., Fryxell J. M., Eberly L., Packer C. 2009. Serengeti real estate: density versus fitness-based indicators of lion habitat quality. Ecol. Lett. 12, 1050–1060 10.1111/j.1461-0248.2009.01359.x (doi:10.1111/j.1461-0248.2009.01359.x) [DOI] [PubMed] [Google Scholar]
- 36.Mosser A., Packer C. 2009. Group territoriality and the benefits of sociality in the African lion, Panthera leo. Anim. Behav. 78, 359–370 10.1016/j.anbehav.2009.04.024 (doi:10.1016/j.anbehav.2009.04.024) [DOI] [Google Scholar]
- 37.Packer C., Scheel D., Pusey A. E. 1990. Why lions form groups: food is not enough. Am. Nat. 136, 1–19 10.1086/285079 (doi:10.1086/285079) [DOI] [Google Scholar]
- 38.Scheel D., Packer C. 1991. Group hunting behaviour of lions: a search for cooperation. Anim. Behav. 41, 697–709 10.1016/S0003-3472(05)80907-8 (doi:10.1016/S0003-3472(05)80907-8) [DOI] [Google Scholar]
- 39.Packer C., Pusey A. E., Eberly L. E. 2001. Egalitarianism in female African lions. Science 293, 690–693 10.1126/science.1062320 (doi:10.1126/science.1062320) [DOI] [PubMed] [Google Scholar]
- 40.Glasserman P. 2004. Monte Carlo methods in financial engineering. New York, NY: Springer [Google Scholar]
- 41.Madan D. B., Carr P. P., Chang E. C. 1998. The variance gamma process and option pricing. Eur. Finance Rev. 2, 79–105 10.1023/A:1009703431535 (doi:10.1023/A:1009703431535) [DOI] [Google Scholar]
- 42.Craft M. E., Volz E., Packer C., Meyers L. A. 2009. Distinguishing epidemic waves from disease spillover in a wildlife population. Proc. R. Soc. B 276, 1777–1785 10.1098/rspb.2008.1636 (doi:10.1098/rspb.2008.1636) [DOI] [PMC free article] [PubMed] [Google Scholar]
- 43.Craft M. E. 2008. Predicting disease dynamics in African lion populations, pp. 1–126 PhD thesis, University of Minnesota, Saint Paul, MN [Google Scholar]
- 44.Latora V., Marchiori M. 2001. Efficient behavior of small-world networks. Phys. Rev. Lett. 87, 198701. 10.1103/PhysRevLett.87.198701 (doi:10.1103/PhysRevLett.87.198701) [DOI] [PubMed] [Google Scholar]
- 45.Gaskell R. M., Dawson S., Radford A. D. 2006. Feline respiratory disease. In Infectious diseases of the dog and cat, vol. 3 (ed. Greene C. E.), pp. 145–154 Philadelphia, PA: WB Saunders [Google Scholar]
- 46.Packer C., Altizer S., Appel M., Brown E., Martenson J., O'Brien S. J., Roelke-Parker M., Hofmann-Lehmann R., Lutz H. 1999. Viruses of the Serengeti: patterns of infection and mortality in African lions. J. Anim. Ecol. 68, 1161–1178 10.1046/j.1365-2656.1999.00360.x (doi:10.1046/j.1365-2656.1999.00360.x) [DOI] [Google Scholar]
- 47.Radford A. D., Coyne K. P., Dawson S., Porter C. J., Gaskell R. M. 2007. Feline calicivirus. Veterinary Res. 38, 319–335 10.1051/vetres:2006056 (doi:10.1051/vetres:2006056) [DOI] [PubMed] [Google Scholar]
- 48.Greene C. E., Appel M. J. 2006. Canine Distemper. In Infectious diseases of the dog and cat, vol. 3 (ed. Greene C. E.), pp. 25–27 Philadelphia, PA: WB Saunders [Google Scholar]
- 49.Roelke-Parker M. E., et al. 1996. A canine distemper virus epidemic in Serengeti lions (Panthera leo). Nature 379, 441–445 10.1038/379441a0 (doi:10.1038/379441a0) [DOI] [PMC free article] [PubMed] [Google Scholar]
- 50.Craft M. E., Hawthorne P. L., Packer C., Dobson A. P. 2008. Dynamics of a multihost pathogen in a carnivore community. J. Anim. Ecol. 77, 1257–1264 10.1111/j.1365-2656.2008.01410.x (doi:10.1111/j.1365-2656.2008.01410.x) [DOI] [PubMed] [Google Scholar]
- 51.Sundaresan S., Fischhoff I., Dushoff J., Rubenstein D. 2007. Network metrics reveal differences in social organization between two fission–fusion species, Grevy's zebra and onager. Oecologia 151, 140–149 10.1007/s00442-006-0553-6 (doi:10.1007/s00442-006-0553-6) [DOI] [PubMed] [Google Scholar]
- 52.Carter S. P., Delahay R. J., Smith G. C., Macdonald D. W., Riordan P., Etherington T. R., Pimley E. R., Walker N. J., Cheeseman C. L. 2007. Culling-induced social perturbation in Eurasian badgers Meles meles and the management of TB in cattle: an analysis of a critical problem in applied ecology. Proc. R. Soc. B 274, 2769–2777 10.1098/rspb.2007.0998 (doi:10.1098/rspb.2007.0998) [DOI] [PMC free article] [PubMed] [Google Scholar]
- 53.Donnelly C. A., et al. 2006. Positive and negative effects of widespread badger culling on tuberculosis in cattle. Nature 439, 843–846 10.1038/nature04454 (doi:10.1038/nature04454) [DOI] [PubMed] [Google Scholar]
- 54.Woodroffe R., et al. 2009. Bovine tuberculosis in cattle and badgers in localized culling areas. J. Wildl. Dis. 45, 128–143 [DOI] [PubMed] [Google Scholar]
- 55.Ezenwa V. O. 2004. Host social behavior and parasitic infection: a multifactorial approach. Behav. Ecol. 15, 446–454 10.1093/beheco/arh028 (doi:10.1093/beheco/arh028) [DOI] [Google Scholar]
- 56.Bansal S., Pourbohloul B., Meyers L. A. 2006. A comparative analysis of influenza vaccination programs. PLoS Med. 3, e387. 10.1371/journal.pmed.0030387 (doi:10.1371/journal.pmed.0030387) [DOI] [PMC free article] [PubMed] [Google Scholar]
- 57.Pourbohloul B., Meyers L. A., Skowronski D. M., Krajden M., Patrick D. M., Brunham R. C. 2005. Modeling control strategies of respiratory pathogens. Emerg. Infect. Dis. 11, 1249–1256 [DOI] [PMC free article] [PubMed] [Google Scholar]
- 58.Mosser A. 2008. Group territoriality of the African lion: behavioral adaptation in a heterogeneous landscape. PhD thesis, University of Minnesota, MN, USA [Google Scholar]
- 59.Appel M. 1987. Canine distemper virus. In Virus infections of carnivores (ed. Appel M. J. G.), pp. 132–159 New York, NY: Elsevier Science [Google Scholar]