Abstract
We study the mechanics of pull-off of a barnacle adhering to a thin elastic layer which is bonded to a rigid substrate. We address the case of barnacles having acorn shell geometry and hard, calcarious base plates. Pull-off is initiated by the propagation of an interface edge crack between the base plate and the layer. We compute the energy release rate of this crack as it grows along the interface using a finite element method. We also develop an approximate analytical model to interpret our numerical results and to give a closed-form expression for the energy release rate. Our result shows that the resistance of barnacles to interfacial failure arises from a crack-trapping mechanism.
Keywords: barnacles, crack, energy release rate
1. Introduction
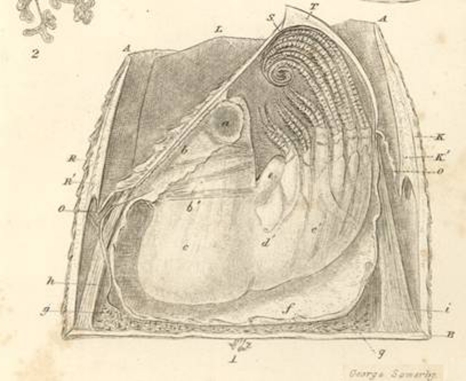
Barnacles are small marine invertebrates (crustaceans). Systematic study of barnacles started with Charles Darwin, who spent 8 years collecting, classifying and carrying out microscopic studies [1]. Figure 1 shows one of the sketches from his monograph depicting the acorn barnacle Balanus tintinnabulum in cross section. Barnacles attach to submerged surfaces, including rocks, lobsters and whales, and are persistent foulants of man-made structures such as piers and ship hulls. Fouling by barnacles and other marine plants and animals can substantially increase propulsive fuel consumption and maintenance costs [2,3]; therefore, there is a great need to develop strategies to prevent the settlement and growth of organisms like barnacles on ship and other marine surfaces. There are essentially three strategies. The first is to use toxic coatings such as tributyltin (TBT)-based paints or organic booster biocides [2,4]. However, TBT coatings can cause serious environmental damage [5]. The adverse effects of organic booster biocides on living organisms were summarized by Evans et al. ([2], see table 3). The second strategy is to use non-toxic anti-biofouling surfaces to reduce intermolecular interaction. Two main classes of such coatings are: (i) a low-surface energy release coating made of non-polar, low modulus, hydrophobic elastomer such as poly(dimethylsiloxane) (PDMS) [6]; (ii) a surface resistant to protein adsorption and cell adhesion, made of hydrophilic polymers with low polymer/water interfacial energy like polyethylene glycol [7]. The third strategy is to use surface architecture to reduce the settlement of marine foulants, and possibly reduce adhesion between the biofoulant and the surface. For example, Schumacher et al. [8] engineered hierarchical surface structures with microscale pillars and ridges, inspired by shark skin. By tuning the aspect ratio of the topographical features, they can reduce the settlement of marine foulants such as algal zoospores and barnacles. Efimenko et al. [9] recently developed surface topographies with hierarchical wrinkles of different length scales, which were also shown to have better settlement resistance than smooth coatings.
Figure 1.
A drawing showing the anatomy of a barnacle in cross section (Balanus tintinnabulum) in Darwin [1].
Barnacles bond to surfaces by secreting proteins which cure into a thin layer of adhesive plaque or cement. The biochemical properties of barnacle cement have been investigated [10–12], and are described in a recent review by Kamino [13]. How the adhesive cures is still not fully understood. Recent work of Dickinson et al. [14] suggested that cement polymerization may be a specialized form of wound healing similar to blood clotting. The structure of the thin (approx. 1 µm) adhesive layer has been shown to be a fibrillar [14–17] protein with secondary structure exhibiting characteristics of amyloid-folded (antiparallel β-sheet) proteins in Balanus amphitrite [17]. Above the proteinaceous cement layer in many barnacles is a calcified base plate, imparting further mechanical rigidity to the adhesive interface. The compliance of base plates for the barnacle B. amphitrite was recently measured by Ramsay et al. [18]. Finally, the exterior shell structure of many species of barnacles has been demonstrated to be mechanically robust owing to a combination of shell mineralization and architectural geometry of the interlocking plates [19,20].
In this paper, we study the fracture mechanics of barnacle adhesion on release coatings. Specifically, we treat the geometric case of an acorn-shaped barnacle with a hard calcarious base plate. A common method to test the effectiveness of a fouling-release coating is to determine the force needed to pull a rigid cylindrical flat punch bonded to a thin layer of elastomer [21–23]. The rigid flat punch or stud is often referred to as a pseudo-barnacle and the thin elastic layer represents the release coating. Pull-off occurs by the propagation of an interface crack initiating from the edge of the punch. Data from these tests are often interpreted using Kendall's expression [24] for the force Fc required to detach a rigid flat cylindrical punch from a thin elastomer layer on a rigid substrate [21–23], i.e.
 |
1.1a |
where a is the radius of the punch, K the bulk modulus of the elastic layer, Wad the work of adhesion of the barnacle–coating interface and h the layer thickness. One of the difficulties with Kendall's model is that the force is proportional to the square root of the bulk modulus, which is infinite for incompressible materials.1 This difficulty arises because the compliance of the layer C is estimated by the expression
| 1.1b |
which becomes increasingly inaccurate as the thickness of the layer decreases. A much more accurate approximation for the compliance was used by Lakrout & Singer [25] to study the pull release of a cylinder stud epoxied to a silicone coating. Their energy release rate is based on a formula developed by Shull & Crosby (SC) [26]. In the limit of a very thin incompressible layer, i.e. a/h ≫1, the SC formula predicts that the pull-off force is given by
| 1.2 |
where ω = 32/9 is a numerical constant. The SC formula removes the singularity in Kendall's theory as the bulk modulus is replaced by E, the Young modulus of the layer. However, because this formula is obtained by curve fitting to the finite element results of Ganghoffer & Gent [27], the pull-off force is off by a numerical factor in the limit of very thin layers. According to the exact analysis of Yang & Li (YL) [28], for very thin layers that are perfectly bonded to the punch, the numerical constant ω should be π/2.
Despite the difficulty with Kendall's model (e.g. K = ∞ for incompressible materials), pull-release experiments using rigid studs showed that the pull-off force scales reasonably well with  [21,29]. This paradoxical result can be explained by a recent work of Chung & Chaudhury [29], who pointed out that the incompressible constraint in the thin elastic layer will lead to cavitation on the punch–layer interface, which is also observed by Kohl & Singer in an earlier work [22]. Based on this idea, they proposed that the pull-off force is given by:
 |
1.3 |
which is identical to equation (1.1a) except that the bulk modulus K in equation (1.1a) is replaced by 1.65E in equation (1.3), thus avoiding the mathematical difficulty of an infinite pull-off force for incompressible materials.
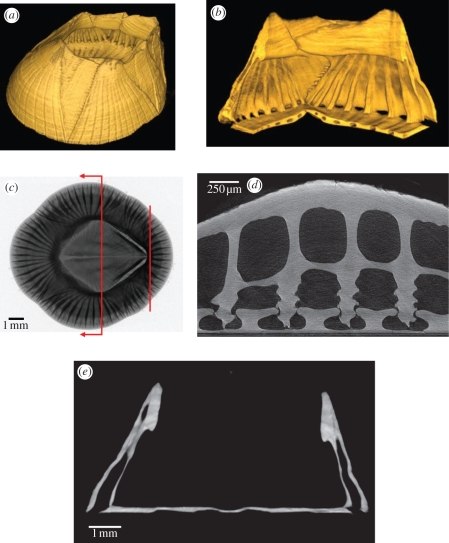
As shown in figure 1, acorn barnacles have a shell-like structure whose interior is partially occupied by soft tissues. In contrast, the form and structure of the B. amphitrite shell is shown in figure 2. A volume-rendered tomogram of the exterior showing the parietes and radii is shown in figure 2a, while a cut-away of the interior in figure 2b shows the sheath, inner lamina, the thin calcarious base and radial channels in the base. An X-ray radiograph (figure 2c) of a live barnacle shows that the barnacle shell is approximately axisymmetric. Furthermore, overlaid lines in figure 2c indicate the approximate regions for the tomography slices (shown in figure 2d,e) of live barnacles adhering to a flat substrate.
Figure 2.
X-ray radiograph and tomograms of Balanus amphitrite showing the structure of the shell. (a) Volume-rendered tomogram overview of a barnacle shell. (b) Volume renderings of a live barnacle's shell showing a quarter section from the interior with an elliptical cutout in the base to highlight the channels in the base. (c) Radiograph of a live barnacle with lines indicating the approximate regions shown in (d) and (e). (d) Tomogram two-dimensional secant slice reconstruction showing the outer lamina, longitudinal canals, longitudinal septum and inner lamina above, and the interlocking parietes and base plate structures below in a live barnacle. (e) Tomogram two-dimensional thick transverse section reconstruction, near the mid-section of a live barnacle, showing the shell cross section (the operculum has been removed for clarity). Data are from two representative live individuals and one shell. (Online version in colour.)
B. amphitrite has a rather ingenious joint system around the periphery, similar to dovetail joints, attaching the parietes to the base. Description of these buttressed, dovetail structures, their interlocking features and the strength of various barnacle shells are well described in the papers of Murdock & Currey [20] and Barnes et al. [19]. While musculature is certainly involved, the presence of this rigid buttressing system can be easily demonstrated (figure 2d). The magnitude of the mechanical contribution of the shell structure will certainly far exceed that of the musculature, which is neglected in this work.
The cross section in figure 2e shows the basic design of the barnacle parietal and base plates and forms the basis of the model to be presented. The operculum has been removed for clarity. The parietes contain hollow longitudinal channels, and the interlocking buttresses are located at the base of the stiffening ribs shown in figure 2b. The shell wall typically thickens in the sheath around the top of the shell.
These figures suggest that certain details of the release process may not be captured by modelling the barnacle as a rigid cylindrical flat punch and that a more accurate model is to treat the barnacle as a hollow shell capped with a thin base plate (figure 3). While this simplified geometry (hollow cylindrical punch) does not capture all the architectural features of a real barnacle, such as the longitudinal and radial channels in the parietal plates and base plate, angled sides and interlocking interior buttresses (figure 2b,d,e), it is a geometry that captures the most relevant aspects of the shell structure while allowing analytical evaluation of the release fracture mechanics problem.
Figure 3.
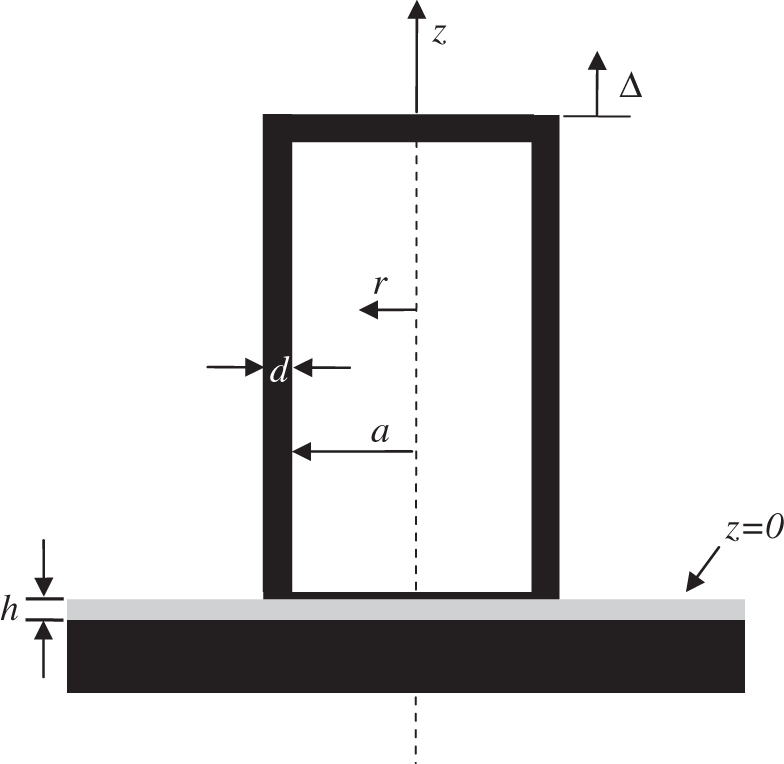
Geometry of the barnacle model. The thickness of the base plate is t (not shown in figure).
Some aspects of the analytical problem can be informed from the existing experimental data. Recent experiments by Ramsay et al. [18] reported on direct measurements of base plate compliance of the barnacle B. amphitrite. As the soft tissue has very low modulus and does not fully occupy the shell's interior, its effect on the deformation of the shell and the base plate can be neglected. Therefore, it is treated as a material with zero elastic modulus. Our approach is similar to Chung & Chaudhury [29], who modelled the barnacle as a thin plate attached to a soft elastic punch, but without an outer shell. Using this model, they obtained a semi-empirical expression for the pull-off force which provided a good fit for their experimental data. However, they did not provide details on how the energy release rate varies with crack length. In this work, we replace the soft elastic punch, in the study of Chung & Chaudhury [29], with a stiff elastic shell and perform a detailed analysis on the release mechanics.
The plan of this paper is as follows: we present a model of pull-release in §2. Analytical and numerical results for the energy release rate are also given in this section. In §3, we discuss and compare the prediction of different barnacle pull-release models. Section 4 summarizes the results of this work.
2. Modelling barnacle adhesion
2.1. Adhesion model
For the purpose of this paper, we will consider the side plates and base plate as a homogeneous solid. The barnacle can be viewed as an axis-symmetric circular conical shell with height b and a base of radius a. The conical shell has a uniform thickness d. The bottom of the conical shell is covered with a base plate of uniform thickness t. The Young modulus and Poisson's ratio of the barnacle and the base plate are denoted by Eb and νb, respectively. The base plate is assumed to adhere perfectly to the top surface of a flat layer of incompressible elastic material with Young's modulus E and thickness h. The bottom surface of this elastic layer is bonded to a rigid substrate.
We consider the problem of pull-release where a vertical displacement Δ is applied to the conical shell. Owing to axisymmetry, the force F resulting from this applied displacement is also vertical. To simplify the analysis further, we replace the conical shell by a cylindrical shell or tube of thickness d with inner radius a. The bottom of this tube is covered with a circular plate of radius R = a + d and thickness t. A vertical displacement Δ is applied to the top of the tube to pull the barnacle off. With respect to a cylindrical coordinate system (r, θ, z; figure 3), the base plate occupies the region 0 ≤ r < a, 0 ≤ z ≤ t; while the elastic layer occupies the region 0 ≤ r < ∞, −h ≤ z < 0.
As the modulus of the barnacle is much larger than the elastic layer, the elastic tube (a + d < r < a, z > 0) can be considered to be approximately rigid. Therefore, the outside edge of the tube at r = a + d can be considered as the front of an exterior circular interface crack, which occupies the region r > a + d, z = 0. At sufficiently large applied displacement or load, this external crack will grow along the interface and eventually reach the thin base plate. As the plate is very thin, it carries very little strain energy, so the maximum energy release rate is anticipated to occur near the edge r = a + d. The energy release rate will decrease dramatically as the interface crack moves into the region occupied by the base plate. As a result, the crack will be trapped until it reaches the location where the energy release rate is a minimum. As a result, larger displacement must be applied to further propagate the crack.
Our primary goal is to compute the energy release rate of a crack which has initiated from the edge with its front located at r = c, where 0 ≤ c < a + d. The crack is loaded by a vertical displacement Δ as shown in figure 4.
Figure 4.
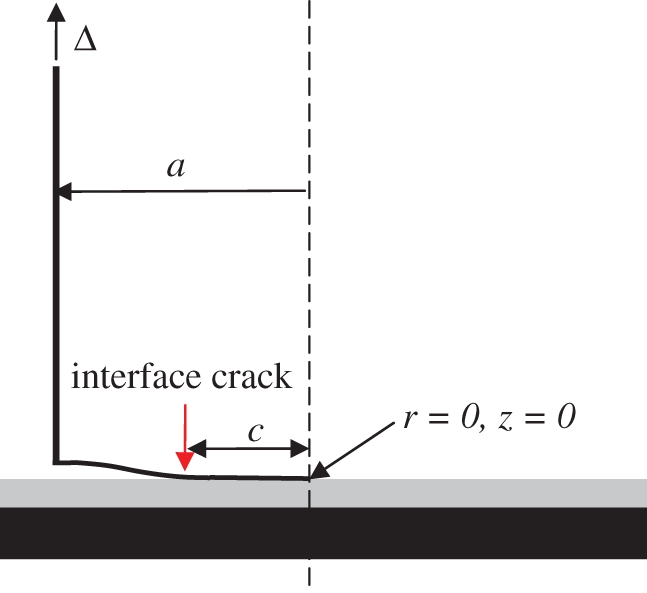
The base plate between a + d and c is pull-off from the interface owing to the applied displacement Δ. The interface crack occupies the region where c ≤ r < a + d. (Online version in colour.)
Crack growth takes place in two regions. In region 1, the crack starts at the edge r = a + d, and grows inwards until it reaches the thin base plate. In this region the crack front lies in a ≤ r ≤ a + d. In region 2, the crack grows on the interface between the base plate and the release layer. In this region, we can define an effective crack length a − c. This assumption, together with dimensional analysis, allows us to write the energy release rate in the form:
 |
2.1a |
where
 |
2.1b |
In equation (2.1b), D is the bending rigidity of the plate. The dimensionless parameter ɛ is a ratio of the stiffness of the elastic layer to the stiffness of the plate.2 The energy release rate in both regions will be determined using a finite element method (FEM). Note that the special case of ɛ → ∞ corresponds to the rigid punch solution of Lakrout & Singer [25]. Typically, the release coating is made of elastomers with modulus of about E = 3 MPa and thickness h from 0.2 to 4 mm. The size of the barnacle, a, may range from 1.5 to 5 mm. Base plate stiffness D has been measured for laboratory-grown B. amphitrite barnacles [18] and was found to range between 0.0002 and 0.008 Nm, with most measurements having D < 0.003 Nm (37 of 43 measurements). An estimate of the effective modulus of the base plate was made from these values and the measured thickness of each base plate; the estimate was 3–6 GPa without considering the hollow structure and assuming νb = 0.3. The ratio of base plate thickness, t, to shell radius, a, ranged between 2.5 and 5 per cent. Using equation (2.1b), the range of the dimensionless parameter ɛ is from 10−3 to 100.
In the following, we derive an analytical expression for the energy release rate in region 2. We achieve this by treating the elastic layer as an elastic foundation of stiffness k. The stiffness of the foundation is an unknown parameter which is used to fit finite element results. The solution of our analytical model will be given below. This solution will be compared with the finite element result given in a later section.
2.2. Analytical model for energy release rate in region 2
The governing equations for the deflection of the plate, w(r), are:
| 2.2a |
| 2.2b |
where L is the linear differential operator defined by
| 2.2c |
Equation (2.2a) states the detached plate surfaces are traction-free. Equations (2.2a) and (2.2b) are solved with the boundary conditions:
| 2.2d |
| 2.2e |
Equation (2.2d) states that a vertical displacement Δ is applied to the edge of the plate at r = a. Also, the slope of the deflection at r = a is 0 as it is attached to the shell there. Equation (2.2e) is due to symmetry.
The general solution of equation (2.2a) is
| 2.3a |
where η is the normalized distance defined by
 |
2.3b |
The general solution of equation (2.2b) is given in Timoshenko & Woinowsky-Krieger [30],
| 2.4 |
where ‘ber’, ‘bei’, ‘ker’ and ‘kei’ are Kelvin functions of order zero. The functions ker and kei are singular at η = 0 leading to unbounded displacement and shear force at the origin. As these quantities are bounded, b3 = b4 = 0. Also, the boundary condition (2.2e) is automatically satisfied as
| 2.5 |
In summary, there are six unknowns d1, d2, d3, d4, b1, b2 and two equations resulting from the boundary condition (2.2d). Four additional equations are needed to solve for these unknowns. These equations are obtained by imposing the continuity of w, dw/dr, d2w/dr2, d3w/dr3 at r = c. After some tedious calculations, we found
| 2.6a |
| 2.6b |
 |
2.6c |
| 2.6d |
| 2.6e |
| 2.6f |
where  , ϕ1 (η) ≡ ber(η), ϕ2 (η) ≡ bei(η) and a prime denotes differentiation with respect to η. To simplify notations, we use
  to denote
  in equation (2.6d). The same notation is used for ϕi and higher derivatives in equations (2.6c–f).
Equations (2.6a–f) can be solved exactly to give the deflection. To derive the energy release rate G, we used the fact that the total strain energy of the system (plate + elastic layer) Γ is FΔ/2, where F is the total shear force applied at the plate edge, r = a . For a circular plate, F = 2πaQ, where Q is the shear force per unit length, and is found to be,
 |
2.7 |
The total shear force F at r = a is found by letting η = a in equation (2.7),
| 2.8 |
The energy release rate is
 |
2.9 |
Substituting equation (2.8) into (2.9), we found
 |
2.10 |
where  . The solution for d1 is (using the symbolic tool in Matlab)
| 2.11 |
where A and B are given by
| 2.12a |
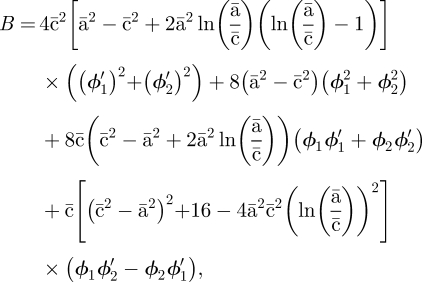 |
2.12b |
where
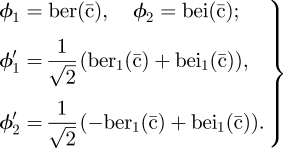 |
2.13 |
Substituting equation (2.11) into (2.10) and using equations (2.12a) and (2.12b), the energy release rate is found to be
| 2.14 |
where
| 2.15a |
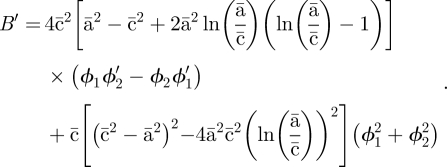 |
2.15b |
We end this section by pointing out the following interesting result, the energy release rate equation (2.14) becomes much simpler for a very stiff foundation, i.e.
 |
2.16 |
For this case, we use the asymptotic behaviour of the Kelvin functions [31] to obtain the leading behaviours of A, B, A′ and B′ and substitute these results into equation (2.14) to compute the energy release rate. In this limit, the energy release rate is found to be
 |
2.17 |
Equation (2.17) can also be obtained by solving the problem of a circular plate in contact with a rigid substrate. It should be noted that Wan [32] has studied the adhesive contact between a flat rigid punch and a circular thin film. Both bending and stretching deformations were included in his work. In the limit of an unstretchable elastic plate, Wan's solution and ours agree.
Although it is possible to carry out a similar analysis for ɛ → ∞, which corresponds to the limit of an infinitely stiff plate (i.e. rigid punch or stud), the foundation model in this limit is not a good approximation; the energy release rate for this case should be given by the SC or YL model.
2.3. Numerical determination of the energy release rate
To study the accuracy of our analytical model and to determine the energy release rate in region 1, we determine the energy release rate using FEM. Our FEM model is based on the full geometry which is shown in figure 3. Specifically, the base plate is modelled as an isotropic linear elastic continuum with Young's modulus Eb and Poisson's ratio νb = 0.3. The barnacle shell is modelled as an elastic continuum and the base plate is assumed to be perfectly bonded to the elastic tube. The elastic layer is incompressible and its lower surface is perfectly bonded to a rigid half space. Details of the FEM are given in the electronic supplementary material. The energy release rate is determined using two methods, which gives consistent results. The first method computes G by evaluating the path independent J integral [33]. The second, less accurate method, computes G using changes in global strain energy owing to crack extension.
2.4. Results
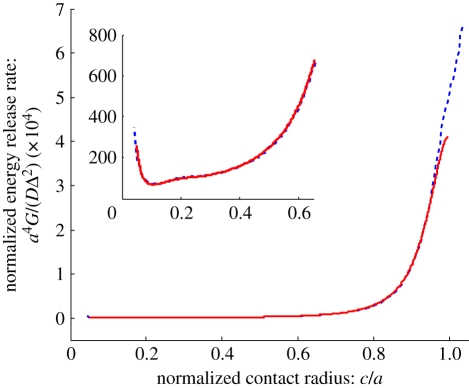
To test our analytical solution, we consider two limiting cases: the first corresponds to a thin layer and the second a thick layer. In the first case, h/a = 0.1. The normalized energy release rate  for this case is plotted against the normalized contact radius c/a in figure 5. When c = a + d, the crack front is at the outer edge of the shell. Complete detachment occurs when c = 0. The dashed line in figure 5 is the finite element result. The analytical result (equation (2.14)) is given by the solid line. The agreement between the two results is extremely good in the region c/a < 0.9. The analytical result underestimates the energy release rate for shorter cracks, which is expected since plate theory breaks down in this regime for stiff foundations, i.e. thin layers. It should be noted that the analytical result is obtained by treating k or β = kh/E as a fitting parameter. Recall that k is the foundation stiffness which we assumed to be independent of contact radius. This assumption is consistent with our numerical result where β = 2.955. Figure 5 shows that the energy release rate is very high for short cracks (i.e. in region 1) then decreases rapidly as the crack extends into the region covered by the base plate.
Figure 5.
Normalized energy release rate  versus normalized contact radius c/a for h/a = 0.1. The dashed line is obtained using the FEM and the solid line is given by the analytical solution (2.14) with
  . A zoom-in of the same curve for small contact is given in the insert. (Online version in colour.)
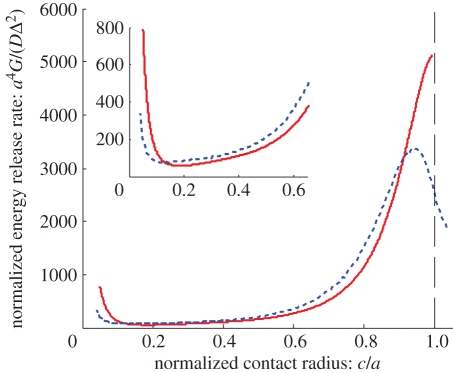
The energy release rate for a very thick release layer (unlikely in practice) is shown in figure 6. The finite element solution is shown by the dashed line; the solid line represents the analytical result (equation (2.14)). Even in this limit where the foundation model is not expected to be accurate, the agreement between equation (2.14) and the numerical results are quite good. For example, the relative error is less than 35 per cent for 0.1 < c/a < 0.9. Note that the energy release rate still drops quickly as the crack moves into regime 2.
Figure 6.
Normalized energy release rate  versus normalized contact radius c/b for h/a = 2.0. The dashed line is obtained using the FEM and the solid line is given by the analytical solution with β = kh/E = 7.351 (see equation (2.14)). A closer view of the curve for small contact radius is given in the insert. (Online version in colour.)
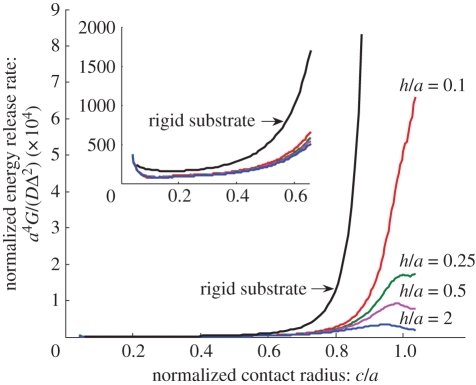
Figure 7 plots the FEM energy release rate versus crack length for different thickness ratios h/a. The case where the substrate is rigid, equation (2.17), is shown in the figure as a solid black line. Note that equation (2.17) provides an upper bound for the energy release rate. Figure 7 shows that the energy release rate for short cracks is very sensitive to the thickness ratio h/a. As the crack extends, this sensitivity to the thickness ratio decreases substantially. In the long crack regime, equation (2.17) can be used as a crude estimate for the energy release rate.
Figure 7.
Normalized energy release rate  versus normalized contact radius c/a for h/a = 0.1, 0.25, 0.5 and 2. The case where the substrate is rigid (k → ∞) is also plotted for comparison using equation (2.17). (Online version in colour.)
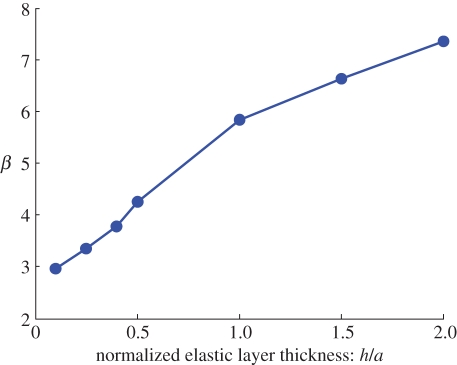
Finally, the normalized foundation stiffnesses β = kh/E for different h/a are plotted in figure 8. For the parameters used in our calculations, the analytical results using these normalized foundation stiffnesses provide very good approximations to our numerical results. Note that we have assumed that the fitting parameter β = kh/E depends only on h/a, that is, it is a property of the elastic layer, although theoretically it can also be dependent on 64D/Ea3, which we assume to be a small number.
Figure 8.
The parameter β = kh/E versus the layer thickness h/a. Data are obtained for ɛa/h = 64D/Ea3 = 0.0229. (Online version in colour.)
3. Force- versus displacement-controlled test: pull-off force
In this section we discuss the prediction of the different barnacle pull-release models in the literature. We first compare the Kendall model with the SC or YL model, since they are the same models for the same test. These models will be compared with a cavitation model proposed by Chung & Chaudhury [29] (see §1). Comparison is also made between our model and these previous models. However, it must be noted that our model is based on different geometry, so it is not surprising that our results are different from these models.
In the literature on barnacle release little is said about the differences between force- versus displacement-controlled testing. In a force-controlled test, pull-off is typically associated with the unstable propagation of the interface crack, whereas in a displacement-controlled test, crack growth can be stable after the peak force (e.g. the pull-off force in a load-controlled test). Here we consider two extreme cases: loading machines that are either perfectly compliant (force-controlled) or infinitely stiff (displacement-controlled).
As an example, consider Kendall's model. Imagine the scenario where an interface crack has propagated and the punch is in partial contact with the elastic layer. Let c be the contact radius (0 < c ≤ a), where a is the punch radius. This case is equivalent to a rigid punch of radius c in contact with the same elastic layer. As the energy release rate G is independent of the compliance of the loading device, it is
| 3.1 |
where we have used equation (1.2) to relate the punch displacement Δ to the applied force F. Assuming that the interface has a constant work of adhesion Wad, the condition of crack growth is G = Wad. According to equation (3.1), in a force-controlled test, the crack initiates at c = a when
 |
3.2 |
which is equation (1.1a). Equation (3.1) states that, for a fixed force, the energy release rate increases with decreasing c (crack grows inwards as c decreases); therefore, pull-off occurs at crack initiation. In a displacement-controlled test, the condition G = Wad implies that
 |
3.3 |
Note that the energy release rate is independent of the punch radius in a displacement-controlled test. However, once the critical displacement (or the critical force) is reached, any further increase in displacement will cause unstable crack growth; therefore, pull-off occurs once the crack initiates for both displacement- and force-controlled tests.
The predictions are quite different if the expression of SC is used to compute the energy release rate. For very thin layers (a/h≫1), the energy release rate is
| 3.4a |
where we have used
| 3.4b |
Recall ω = 32/9 is a numerical constant. Enforcing the fracture criterion G = Wad, the pull-off force is found to be
 |
3.5 |
Note that in a force-controlled test, the energy release rate increases rapidly with decreasing c; therefore, crack growth in a force-controlled test is unstable and pull-off occurs when c = a. In a displacement-controlled test, the displacement needed to satisfy the condition G = Wad is
 |
3.6 |
Crack growth is stable in this case since the energy release rate reduces as c decreases. To quantify this, let Δa ≡ a − c denote the amount of crack growth, using equations (3.4a), (3.6) and the condition G = Wad, we found
| 3.7 |
where Δc is the displacement needed to initiate the crack growth. Equation (3.7) shows that it is necessary to increase the applied displacement to grow the crack. The dependence of the force Fs on the crack increment can be obtained using equations (3.7) and (3.4b),
 |
3.8 |
Thus, the peak force in a displacement-controlled test occurs at crack initiation, then decreases rapidly with increasing crack increment.
In summary, Kendall's model predicts that crack growth is unstable for both load- and displacement-controlled tests, whereas the SC model predicts that crack growth is unstable in a load-controlled test but stable in a displacement-controlled test. The pull-off load (e.g. the peak load in a displacement-controlled test) for these models scales with material and geometrical parameters in very different ways. Specifically, Kendall's model predicts that  , which implies that the pull-off stress is independent of the punch radius and is inversely proportional to the square root of the layer thickness. The SC or YL model, however, predicts that Fc ∝ a3/h3/2, which means that the pull-off stress is proportional to a/h3/2. The additional factor of a/h in the SC or YL models suggest that the pull-off stress in these models is much more sensitive to variations in geometry than Kendall's model.
As mentioned in §1, the pull-off force obtained by Chung & Chaudhury [29] is similar to Kendall's but with K replaced by 1.65E. It is interesting to point out that, Yang & Li [28] considered the special case where both the punch–layer and the layer–substrate interfaces are frictionless. For this case, they show that the pull-off force is given by
 |
3.9 |
which is the same as Kendall's model except that the bulk modulus K is replaced by the 8E/3. These results show that pull-off force in the punch problem is, not surprisingly, very sensitive to lateral constraints. Lateral constraint is not nearly as severe in our model owing to the thin plate geometry.
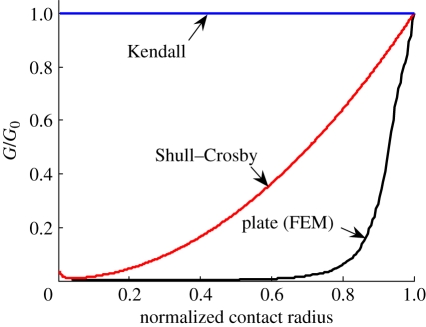
In our model, interface crack growth under displacement control is very stable owing to the rapid decrease in energy release rate as the crack advances. This feature is quite different from predictions of the rigid punch model. For example, in Kendall's model (see equation (3.1)), the energy release rate is independent of crack length, whereas our model shows that it decreases rapidly with crack length. The SC model predicts that the energy release rate decreases as the crack grows, which qualitatively agrees with our model (but is actually significantly different as shown in figure 9). Direct comparison of our model with the rigid punch model is difficult because the geometries are different, which leads to different parameters controlling the energy release rate. This is further complicated by the fact that K → ∞ in the Kendall model for incompressible coatings. A simple way to avoid some of these difficulties is to plot the normalized energy release rate, G/G0 versus the normalized contact radius, where G0 is the energy release rate needed to initiate crack growth in each model. Note that G0 can be very different for different models, but such a plot will allow us to gain insight on how the energy release rate varies with crack length in a displacement-controlled test. These normalized energy release rates are plotted in figure 9. Figure 9 shows that the energy release rate of our model decreases much faster than that predicted by the SC model.
Figure 9.
Variation of energy release rate as crack advances using Kendall's, SC model and our FEM result when h/a = 0.1. Energy release rate is normalized by the value when crack front is at the contact edge. The normalized contact radius for rigid punch model (Kendall, SC) is c/a, where a is the punch radius. For our model, it is c/(a + d) (figure 3). (Online version in colour.)
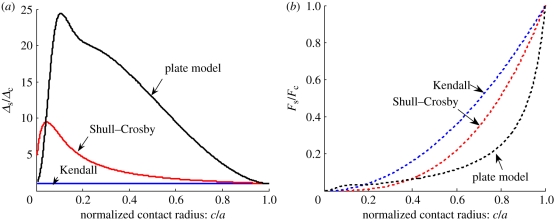
In force control, our numerical result showed that crack growth is unstable, that is, pull-off occurs once the crack initiates from the edge. The force and displacement in a displacement-controlled test for different models in shown in figure 10. As in figure 9, we normalize both Δs and Fs by their crack-initiation values, i.e. Δc and Fc. We emphasize that there are significant differences in Δc and Fc for different models. For example, assuming Wad ≈ 1 J m−2, D = 2 × 10⁻³ Nm, E = 3 MPa, h = 0.3 mm and a = 3 mm, the pull-off force Fc predicted by our model is about 2.9 N, while Fc is 20 N for the SC model (equation (1.2)) and 5 N using the modified Kendall model derived by Chung & Chaudhury (equation (1.3)). For simplicity, our result in figure 10 is obtained by assuming that the crack initiates at c = a, which allow us to use the analytical solution of regime 2 to compute the force and displacement. The pull-off force using this approximation is:
 |
3.10 |
where  is the normalized radius of the base plate,
  , D the bending rigidity of the base plate and k the stiffness of the elastic foundation. In the example mentioned above, we estimate k (≈30 MPa mm−1) according to the results in figure 8.
Figure 10.
(a) Displacement needed to drive crack propagation Δs as a function of contact radius c, when h/a = 0.1. Data are normalized by Δc, i.e. the displacement needed to initiate crack propagation. (b) Force needed to drive crack propagation, Fs as a function of normalized contact radius c/a when h/a = 0.1. The force is normalized by its value when c = a, i.e. Fc. The decrease in Fs as crack advances indicates that crack growth is unstable under force control. (Online version in colour.)
4. Summary and discussion
Instead of modelling the barnacle as a rigid flat punch or stud, we model it as a thin shell capped by a thin plate. We carried out a detailed finite element analysis to determine the energy release rate of an interface crack as it grows from the edge of the barnacle shell towards its centre. Under displacement control, the energy release rate of a crack growing from the edge decreases rapidly and reaches a minimum near the centre of the plate. Also, in a displacement-controlled test, the energy release rate decreases as the thickness of the elastic layer increases. A closed-form solution for the energy release rate based on a plate resting on an elastic foundation is derived and is found to be a good approximation to our finite element calculations for most situations of practical interest. Our model and our results differ from previous treatments, which model the barnacle as a rigid cylindrical flat punch. Comparison of different models is given in §3. We believe that Kendall's model is not intended for incompressible elastomers and that the SC or YL models provide a much more accurate description for pull-release if the interfaces were perfectly bonded and the barnacle can be modelled as a rigid punch. However, as pointed out by Chung & Chaudhury [29], interfacial cavitation usually occurs in pull-release experiments using rigid studs (see [23]); as a result, the SC or YL models are not a good approximation because they are derived based on a perfectly bonded interface.
Our model suggested that barnacles with calcarious base plates use a crack-trapping mechanism to enhance their adhesion. The thin plate geometry makes it difficult to dislodge even on a low-energy surface. Because the energy release rate drops rapidly once the interface crack moves under the base plate, the interface crack will be trapped near the edge of the plate. Once trapped, the large displacement required to drive the crack (or bending the base plate) will cause severe bending of the base plate; this may cause the crack to deflect into the base plate and break the plate instead of propagating along the interface. This mode of failure is often observed in experiments, and in fact has made it difficult to obtain fracture energy or critical removal stresses from barnacle release experiments [23,34]. Singer et al. [23] studied the removal process of wild-type barnacles, B. improvisus, from silicone foul-release coatings using a force-controlled stud pull tester. Release experiments were performed while observations of the interfacial fracture process were made through transparent substrates using video microscopy. They found that pull-off typically resulted in the fracture of the barnacle base plate, after initiation of a peeling process from the periphery of the barnacle. They attributed this fracture behaviour to stronger adhesion in the centre of the barnacle base plate. Our study independently suggests that underlying mechanism for this behaviour lies in the crack-trapping process described by the analytical model developed and presented above.
An example of a fractured (yet intact) barnacle interface obtained by X-ray tomography of a live barnacle specimen is shown in figure 11. It is interesting to note that this type of damage is repairable by the animal. Further, we note that attempts to remove barnacles from surfaces (in the laboratory or from a ship or boat surface, for example) often results in the base plate remaining behind. The barnacles shown in the figures in our paper, B. amphitrite, exhibit shell structures including rib-stiffened interior architecture where the base plate joins the side plates (figure 2b,d). We note that the fracture of the shell in this region is not probably simply owing to tearing of the soft connective tissues connecting the plates in the interior of the shell (as shown in the elegant drawing in figure 1), but instead results from the fracture mechanics conditions inherent to the barnacle geometry and described by our model. However, the mechanics of failure at this junction is beyond the scope of this paper and we hope to address it in a future work.
Figure 11.
X-ray tomogram showing a perspective view from the bottom of a barnacle base plate showing a crack-arresting fracture pattern. In this case, the fracture occurred through the adhesive and into the mineralized base plate structure. The fracture pattern follows stiffening structures found within the barnacle shell (as shown in the upper left portion of figure 2). (Online version in colour.)
In our analysis, we have assumed that the work of adhesion is a material constant. This assumption is justified only if the adhesive is spatially homogeneous. If this is not the case, then the fracture condition G = Wad will still be correct, except that Wad will depend on the crack position (i.e. the crack length).
Fouling-release coatings are designed with the aim of allowing detachment of hard foulants like barnacles from hydrodynamic stresses acting under normal operating conditions. External loadings on barnacles are dependent on the vessel velocity [35]. As it is unlikely that the barnacle shell or the base plate creeps, the effect of pull rate on release mechanics is controlled primarily by the viscoelastic properties of the substrate and interfacial rate processes. Maugis & Barquins [36] have shown that interfacial rate processes can be accounted for by a work of adhesion Wad that depends on the crack growth rate, which in our case is v ≡ −dc/dτ, where τ denotes time. Using our notation, the result of Maugis & Barquins [36] can be expressed as:
| 4.1 |
where  is the thermodynamic work of adhesion or the critical energy release rate at very slow crack growth rates, v* is a characteristic speed where
  and n is a fitting parameter. Lakrout & Singer [25] have carried out pull tests on rigid cylindrical flat punches bonded to a thin layer of elastomer using different loading rates and showed good correlations of their data to equation (4.1). There is no difficulty in extending the present theory to include interfacial rate effects, which may indeed affect release mechanics [37]. Specifically, the loading rate effect can be incorporated in the applied energy release rate G by treating the displacement Δ in equation (2.14) as a function of time, e.g. Δ = Δ(τ). The pull-off force can be computed using the equation G = Wad(v), where Wad(v) is given by equation (4.1) and v ≡ −dc/dτ. The problem becomes much more complicated if bulk viscoelasticity of the substrate is involved and is beyond the scope of this paper.
Figure 2 shows that the base plate is perforated with channels. For mathematical simplicity, we did not include these channels in our model. However, our analysis suggested that barnacles may employ a second crack-trapping mechanism to resist detachment. At the periphery, the thickness of the base plate underneath these channels can be reduced by as much as 80 per cent at the growing edge of the barnacle (figure 2). Since the bending stiffness of a plate is proportional to the third power of its thickness, an 80 per cent reduction in plate thickness can cause a substantial reduction in the local energy release rate. Thus, an interface crack will be trapped at the outer edge of these channels. We speculate that barnacle's structure contributes to the mechanical function of resisting crack growth and hence impeding their removal from surfaces.
Finally, we note that these results apply to barnacles with a base plate. Many species of barnacles (e.g. Balanus eburneus, see table 1 of [19]) do not have base plate and hence our result cannot be applied to these species.
Acknowledgements
C.Y.H. and R.L. are supported by the US Department of Energy, Office of Basic Energy Science, Division of Material Sciences and Engineering under Award (DE-FG02-07ER46463). K.J.W. and R.K.E. acknowledge the support of Office of Naval Research and the Naval Research Laboratory's basic research programme. R.K.E. gratefully acknowledges the use of a high resolution Skyscan 1172 at Micro Photonics Inc. (Allentown, PA, USA). C.Y.H., R.L. and K.J.W. enjoy discussions with Anand Jagota at Lehigh University.
Footnotes
Elastomers such as PDMS are practically incompressible, with Poisson's ratio very close to 0.5.
ɛ is obtained by noting that the maximum displacement of a clamped circular plate of radius a subjected to a uniform pressure p is pa4/64D. The same pressure acting on a thin unconstrained layer of thickness h will cause a displacement of ph/E.
References
- 1.Darwin C. R. 1854. A monograph on the sub-class Cirripedia, with figures of all the species. The Balanidæ, (or sessile cirripedes); the verucidae, etc., vol. 2 London, UK: The Ray Society [Google Scholar]
- 2.Evans S. M., Birchenough A. C., Brancato M. S. 2000. The TBT ban: out of the frying pan into the fire? Mar. Pollut. Bull. 40, 204–211 10.1016/S0025-326X(99)00248-9 (doi:10.1016/S0025-326X(99)00248-9) [DOI] [Google Scholar]
- 3.Yebra D. M., Kiil S., Dam-Johansen K. 2004. Antifouling technology—past, present and future steps towards efficient and environmentally friendly antifouling coatings. Prog. Org. Coat. 50, 75–104 10.1016/j.porgcoat.2003.06.001 (doi:10.1016/j.porgcoat.2003.06.001) [DOI] [Google Scholar]
- 4.Voulvoulis N., Scrimshaw M. D., Lester J. N. 1999. Review: alternative antifouling biocides. Appl. Organometall. Chem. 13, 135–143 (doi:10.1002/(SICI)1099-0739(199903)13:3<135::AID-AOC831>3.0.CO;2-G) [DOI] [Google Scholar]
- 5.Ellis D. V., Pattisina L. A. 1990. Widespread neogastropod impsex: a biological indicator of global contamination. Mar. Pollut. Bull. 21, 248–253 10.1016/0025-326X(90)90344-8 (doi:10.1016/0025-326X(90)90344-8) [DOI] [Google Scholar]
- 6.Swain G. W., Schultz M. P. 1996. The testing and evaluation of non-toxic antifouling coatings. Biofouling 10, 187–197 10.1080/08927019609386279 (doi:10.1080/08927019609386279) [DOI] [PubMed] [Google Scholar]
- 7.Krishnan S., Weinman C. J., Ober C. K. 2008. Advances in polymers for anti-biofouling surfaces. J. Mater. Chem. 18, 3405–3413 10.1039/b801491d (doi:10.1039/b801491d) [DOI] [Google Scholar]
- 8.Schumacher J. F., Aldred N., Callow M. E., Finlay J. A., Callow J. A., Clare A. S., Brennan A. B. 2007. Species-specific engineered antifouling topographies: correlations between the settlement of algal zoospores and barnacle cyprids. Biofouling 23, 307–317 10.1080/08927010701393276 (doi:10.1080/08927010701393276) [DOI] [PubMed] [Google Scholar]
- 9.Efimenko K., Finlay J., Callow M. E., Callow J. A., Genzer J. 2009. Development and testing of hierarchically wrinkled coatings for marine antifouling. Appl. Mater. Interfaces 5, 1031–1040 10.1021/am9000562 (doi:10.1021/am9000562) [DOI] [PubMed] [Google Scholar]
- 10.Berglin M., Gatenholm P. 2003. The barnacle adhesive plague: morphological and chemical differences as a response to substrate properties. Coll. Surf. B: Biointerfaces 28, 107–117 10.1016/S0927-7765(02)00149-2 (doi:10.1016/S0927-7765(02)00149-2) [DOI] [Google Scholar]
- 11.Naldrett M. J. 1993. The importance of sulphur crosslinks and hydrophobic interactions in the polymerization of barnacle cement. J. Mar. Biol. Assoc. UK 73, 689–702 10.1017/S0025315400033221 (doi:10.1017/S0025315400033221) [DOI] [Google Scholar]
- 12.Walker G. 1972. Biochemical composition of cement of 2 barnacle species, Balanus hemeri and Balanus crenatus. J. Mar. Biol. Assoc. UK 52, 429–435 10.1017/S0025315400018786 (doi:10.1017/S0025315400018786) [DOI] [Google Scholar]
- 13.Kamino K. 2008. Underwater adhesive of marine organisms as the vital link between biological science and material science. Mar. Biotechnol. 10, 111–121 10.1007/s10126-007-9076-3 (doi:10.1007/s10126-007-9076-3) [DOI] [PubMed] [Google Scholar]
- 14.Dickinson G. H., Vega I. E., Wahl K. J., Orihuela B., Beyley V., Rodriquez E. N., Everett R. K., Bonaventura J., Rittschof D. 2009. Barnacle cement: a polymerization model based on evolutionary concepts. J. Exp. Biol. 212, 3499–3510 10.1242/jeb.029884 (doi:10.1242/jeb.029884) [DOI] [PMC free article] [PubMed] [Google Scholar]
- 15.Sullan R. M. A., Gunari N., Tanur A. E., Yuri C., Dickinson G. H., Orihuela B., Rittschof D., Walker G. C. 2009. Nanoscale structures and mechanics of barnacle cement. Biofouling 25, 263–275 10.1080/08927010802688095 (doi:10.1080/08927010802688095) [DOI] [PubMed] [Google Scholar]
- 16.Wiegemann M., Watermann B. 2003. Peculiarities of barnacle adhesive cured on non-stick surfaces. J. Adh. Sci. Technol. 17, 1957–1977 10.1163/156856103770572070 (doi:10.1163/156856103770572070) [DOI] [Google Scholar]
- 17.Barlow D. E., Dickinson G. H., Orihuela B., Kulp J. L., Rittschof D., Wahl K. J. 2010. Characterization of the adhesive plaque of the barnacle Balanus amphitrite: amyloid-like nanofibils are a major component. Langmuir 26, 6549–6556 10.1021/la9041309 (doi:10.1021/la9041309) [DOI] [PubMed] [Google Scholar]
- 18.Ramsay D. B., Dickinson G. H., Orihuela B., Rittschof D., Wahl K. J. 2008. Base plate mechanics of the barnacle Balanus amphitrite (=Amphibalanus amphitrite). Biofouling 24, 109–118 10.1080/08927010701882112 (doi:10.1080/08927010701882112) [DOI] [PubMed] [Google Scholar]
- 19.Barnes H., Read R., Topinka J. A. 1970. The behavior on impaction by solids of some common cirripedes and relation to their normal habitat. J. Exp. Mar. Biol. Ecol. 5, 77–87 10.1016/0022-0981(70)90030-4 (doi:10.1016/0022-0981(70)90030-4) [DOI] [Google Scholar]
- 20.Murdock G. R., Currey J. D. 1978. Strength and design of shells of the two ecologically distinct barnacles, Balanus balanus and Semibalanus (Balanus) balanoides (cirripedia). Biol. Bull. 155, 169–192 10.2307/1540874 (doi:10.2307/1540874) [DOI] [Google Scholar]
- 21.Brady R. F., Jr, Singer I. L. 2000. Mechanical factors favoring release from fouling release coatings. Biofouling 15, 73–81 10.1080/08927010009386299 (doi:10.1080/08927010009386299) [DOI] [PubMed] [Google Scholar]
- 22.Kohl J. G., Singer I. L. 1999. Pull-off behavior of epoxy bonded to silicone duplex coatings. Progr. Org. Coatings 36, 15–20 10.1016/S0300-9440(98)00074-5 (doi:10.1016/S0300-9440(98)00074-5) [DOI] [Google Scholar]
- 23.Singer I. L., Kohl J. G., Patterson M. 2000. Mechanical aspects of silicone coatings for hard foulant control. Biofouling 16, 301–309 10.1080/08927010009378453 (doi:10.1080/08927010009378453) [DOI] [Google Scholar]
- 24.Kendall K. 1971. The adhesion and surface energy of elastic solids. J. Phys. D Appl. Phys. 4, 1186–1195 10.1088/0022-3727/4/8/320 (doi:10.1088/0022-3727/4/8/320) [DOI] [Google Scholar]
- 25.Lakrout H., Singer I. L. 2002. Debonding behavior of a glued cylindrical stud from a silicone layer after crack initiation. In Proc. of the 25th Annual Meeting of the Adhesion Society, Orlando, FL, 10–14 February 2002, pp. 165–167 Blacksburg, VA: The Adhesion Society [Google Scholar]
- 26.Shull K. R., Crosby A. J. 1997. Axisymmetric adhesion tests of pressure sensitive adhesives. J. Eng. Mat. Tech. 119, 211–215 10.1115/1.2812246 (doi:10.1115/1.2812246) [DOI] [Google Scholar]
- 27.Ganghoffer J. F., Gent A. N. 1995. Adhesion of a rigid punch to a thin elastic layer. J. Adhesion 48, 75–84 10.1080/00218469508028155 (doi:10.1080/00218469508028155) [DOI] [Google Scholar]
- 28.Yang F., Li J. C. M. 2001. Adhesion of a rigid punch to an incompressible elastic film. Langmuir 17, 6524–6529 10.1021/la010409h (doi:10.1021/la010409h) [DOI] [Google Scholar]
- 29.Chung J. Y., Chaudhury M. K. 2005. Soft and Hard adhesion. J. Adhesion 81, 1119–1145 10.1080/00218460500310887 (doi:10.1080/00218460500310887) [DOI] [Google Scholar]
- 30.Timoshenko S., Woinowsky-Krieger S. 1959. Theory of plates and shells, 2nd edn, pp. 265–266 McGraw-Hill Book Company [Google Scholar]
- 31.Abramowitz M., Stegan I. E. 1972. Handbook of mathematical functions. Applied Mathematics Series 55 Washington, DC: US Department of Commerce, National Bureau of Standards [Google Scholar]
- 32.Wan K. T. 2002. Adherence of an axisymmetric flat punch onto a clamped circular plate: transition from a rigid plate to a flexible membrane. ASME J. Appl. Mech. 69, 110–116 10.1115/1.1433477 (doi:10.1115/1.1433477) [DOI] [Google Scholar]
- 33.Rice J. R. 1968. A path independent integral and the approximate analysis of strain concentration by notches and cracks. J. Appl. Mech. 35, 379–386 [Google Scholar]
- 34.Becka A., Loeb G. 1984. Ease of removal of barnacles from various polymeric materials. Biotechnol. Bioeng. 26, 1245–1251 10.1002/bit.260261015 (doi:10.1002/bit.260261015) [DOI] [PubMed] [Google Scholar]
- 35.Schultz M. P., Kavanagh C. J., Swain G. W. 1999. Hydrodynamic forces on barnacles: implications on detachment from fouling-release surfaces. Biofouling 13, 323–335 10.1080/08927019909378388 (doi:10.1080/08927019909378388) [DOI] [Google Scholar]
- 36.Maugis D., Barquins M. 1978. Fracture Mechanics and the adhesion of viscoelastic bodies. J. Appl. Phys. 11, 1989–2023 [Google Scholar]
- 37.Kavanagh C. J., Quinn R. D., Swain G. W. 2005. Observations of barnacle detachment from silicones using high-speed video. J. Adhesion 81, 843–868 10.1080/00218460500189331 (doi:10.1080/00218460500189331) [DOI] [Google Scholar]


