Abstract
Background
Angiopoietin-2 is expressed in prostate cancer (PCa) bone, liver, and lymph node metastases, whereas, its competitor angiopoietin-1 has limited expression in these tissues. Therefore, we hypothesized that the inhibition of angiopoietin-2 activity in PCa metastasis (removed) will impede angiogenesis, tumor growth and alter bone response in vivo.
Methods
To test our hypothesis we used L1–10, a peptide-Fc fusion that inhibits interactions between angiopoietin-2 and its receptor tie2. We blocked angiopoietin-2 activity using L1–10 in established subcutaneous and intra-tibial LuCaP 23.1 xenografts. We then determined the effect of L1–10 on survival, tumor growth, serum PSA, proliferation, microvessel density, and angiogenesis-associated gene expression in subcutaneous tumors. We also determined serum PSA, tumor area and bone response in intra-tibial tumors.
Results
The administration of L1–10 decreased tumor volume and serum PSA, and increased survival in SCID mice bearing subcutaneous LuCaP 23.1 tumors. Histomorphometric analysis, showed a further significant decrease in tumor epithelial area within the L1–10-treated LuCaP 23.1 subcutaneous tumors (p=0.0063). There was also a significant decrease in cell proliferation (p=0.012), microvessel density (p=0.012), and a significant increase in ANGPT-2 and HIF-1α mRNA expression (p≤0.05) associated with L1–10 treatment. Alternatively, in LuCaP 23.1 intra-tibial tumors L1–10 treatment did not significantly change serum PSA, tumor area or bone response.
Conclusions
Our results demonstrate that inhibiting angiopoietin-2 activity impedes angiogenesis and growth of LuCaP 23.1 PCa xenografts. Based on these data, we hypothesize that angiopoietin-2 inhibition in combination with other therapies may represent a potential therapy for patients with metastatic disease.
Keywords: Angiopoietin-2, Angiogenesis, L1–10, Prostate cancer
Introduction
A solid tumor metastasis requires vasculature to survive and grow [1, 2]. The reactive stroma and its associated vasculature are integral to the survival and growth of tumor epithelial cells at a metastatic site. In addition, the development and maintenance of tumor vasculature is supported by stromal elements and the tumor itself. Angiogenesis is controlled by angiogenic growth factors. Angiopoietin-1 and angiopoietin-2 are angiogenic growth factors that are ligands for the endothelial cell-specific receptor tyrosine kinase tie2. Angiopoietin-2 may revert vessels to a more plastic state, loosening cell-matrix and cell-cell contacts, allowing access to angiogenic inducers, e.g. VEGF in tumors [3]. Angiopoietin-1 helps maintain mature vessels and induce normalization of neovessels [4]. Since prostate cancer (PCa) metastases express VEGF, the co-expression of angiopoietin-2 and VEGF in a hypoxic environment might lead to endothelial cell migration and angiogenesis [3, 5–7].
While chemotherapeutic strategies show some promise, there is at present no effective therapy for castration-resistant metastatic PCa that substantially prolongs survival. The inhibition of angiogenesis has been considered for some time as a target for therapeutic approaches for hormone-resistant metastatic PCa [8]. Differences in microvessel density and angiopoietin-2 expression in PCa cell lines and metastases show that PCa displays angiogenic heterogeneity [9, 10]. Nevertheless, angiopoietin-2 expression has been correlated to histological grade, vascular density, metastases, and outcome in PCa [11]. We previously demonstrated that angiopoietin-2 is expressed in PCa bone, liver, and lymph node metastases [9], whereas, its competitor angiopoietin-1 has negligible expression, shifting the angiogenic balance towards the pro-angiogenic angiopoietin-2. Thus, we hypothesized that inhibition of angiopoietin-2 activity in PCa metastasis will impede angiogenesis and tumor growth in vivo.
L1–10 is a peptide-Fc fusion that inhibits the interaction between angiopoietin-2 and its receptor tie2 [12]. A similar peptide-Fc fusion L1–7(N) has shown efficacy in the treatment of human Colo205 tumors in mice [13]. The selectivity of L1–10 for angiopoietin-2 allowed us to focus specifically on the biology of angiopoietin-2 in PCa tumors.
In the present study, we have evaluated the effects of L1–10 on subcutaneous and intra-tibial LuCaP 23.1 PCa xenografts. Our data show that treatment with L1–10 inhibits the growth of subcutaneous LuCaP 23.1 tumors and decreases serum prostate specific antigen (PSA). In addition, L1–10 significantly reduced tumor-cell proliferation and microvessel density, and significantly increased angiogenesis-associated gene expression (ANGPT-2 and HIF-1α). In the bone microenvironment L1–10 had less of an effect, decreasing serum PSA and tumor area, although not significantly. Interestingly the effects of L1–10 in the bone included a subtle increase in bone formation and a decrease in osteoclast numbers. Based on our results, we hypothesize that blocking angiopoietin-2 may impede angiogenesis and the growth of established PCa metastases in man and accordingly, further exploration of this factor is warranted.
Materials and Methods
Reagents
L1–10 is a peptide-Fc fusion which was obtained from Amgen Inc. (Seattle, WA). L1–10 a specific inhibitor of angiopoietin-2, inhibits interactions between tie2 and human or mouse angiopoietin-2 [12].
Subcutaneous Tumor Formation
Male SCID Beige mice, 6–8 weeks of age, were subcutaneously implanted with LuCaP 23.1 xenograft (established from a lymph node metastasis) tumor bits on the right flank as described previously [14, 15]. Tumor volumes were measured twice weekly (calculated as LxHxWx0.5236) and mice were weighed weekly. Once tumor volumes reached 100 mm3, animals were randomized into two groups. Enrolled animals were dosed twice weekly for six weeks with either control Human IgG (n=10) or with L1–10 (n=10), 4 mg/kg via a dorsal subcutaneous injection. Blood samples were drawn from animals weekly for determination of serum prostate specific antigen (PSA) levels (IMx Total PSA assay, Abbott Laboratories, Abbott Park, IL). BrdU (80 mg/kg) was administered via intraperitoneal injection prior to sacrifice. The subcutaneous tumors were fixed in formalin and embedded in paraffin for immunohistochemistry. A portion of the tumor was flash frozen and stored at −80°C for RNA isolation.
Intra-tibial Tumor Formation
Male SCID Beige mice, 4–6 weeks of age, were injected intra-tibially with 2×10⁵ LuCaP 23.1 cells. Once serum PSA levels reached 5–10 ng/mL, animals were randomized into one of two groups. Enrolled animals were dosed three times a week for six weeks with either control Human IgG (n=10) or L1–10 (n=10), 4 mg/kg via a dorsal subcutaneous injection. Blood for serum PSA levels and body weights were obtained once weekly. Three weeks post enrollment and prior to sacrifice, all mice were radiographed with a Model MX-20 Laboratory radiography System (Faxitron X-Ray Corp., Wheeling, IL). Bone mineral density (BMD) was measured using a PIXImus Lunar densitometer (GE Healthcare, Waukesha, WI). Tibiae samples were all fixed in 70% EtOH, dehydrated in 100% EtOH, infiltrated and embedded in a methyl methacrylate medium (83% methyl methacrylate, 16.5% Nonylphenyl-polyetheyleneglycol Acetate, 0.5% N,N-Dimethylaniline, and 4 mg/mL Benzoyl Peroxide (Sigma)).
RNA Isolation
Total RNA was isolated from up to 100 mg of homogenized LuCaP 23.1 tumors using STAT 60 (Tel-Test, Friendswood, TX) with Phase Lock Gel Heavy 2.0 Tubes (Eppendorf, Hamburg, Germany) according to the manufacturer’s instructions. The RNA concentration was determined using the GenQuant II RNA/DNA calculator (Pharmacia, Piscataway, N.J.).
q-PCR
cDNA was generated from 1 µg total RNA using the Advantage® RT-for-PCR kit (Clontech, Mountain View, CA) with random hexamers according to the manufacturer’s instructions. Real-time q-PCR was performed using a Rotor-Gene® 3000 (Corbett Research, Sydney, Australia) using Platinum® SYBER® Green qPCR SuperMix-UDG (Invitrogen, Carlsbad, CA). Primers were selected using Primer 3 Input (v. 0.4.0) and designed to span intron-exon boundaries (Table 1). Expression levels were determined using the 2−ΔΔCt method normalized against RPL13a (human) or Rpl13a (mouse) expression.
Table 1.
| Human Primers |
Sequence | Annealing Temp. (°C) |
|---|---|---|
| ANGPT1 | Forward: 5’ ATGGACTGGGAAGGGAACCGAGC 3’ Reverse: 5’ GGGGCCACAAGCATCAAACCACC 3’ |
69 |
| ANGPT2 | Forward: 5’ TAAGCAGCATCAGCCAACCAGGAAA 3’ Reverse: 5’ TTTGTGTTCTGCCTCTGTGGATAGTA 3’ |
69 |
| VEGFa | Forward: 5’ CCTGTGTGCCCCTGATGCGATG 3’ Reverse: 5’ GCTTTCGTTTTTGCCCCTTTCCCT 3’ |
69 |
| HIF-1α | Forward: 5’ GCACAGAAGCAAAGAACCCATTTTC 3’ Reverse: 5’ GGCAGTGGTAGTGGTGGCATTAG 3’ |
69 |
| RPL13a | Forward: 5’ CCTGGAGGAGAAGAGGAAAGAG 3’ Reverse: 5’ TTGAGGACCTCTGTGTATTTGTCAA 3’ |
60 |
| Mouse Primers | ||
| Angpt1 | Forward: 5’ GATGGACTGGGAAGGGAACCGAG 3’ Reverse: 5’ CGAACCACCAACCTCCTGTTAGCA 3’ |
69 |
| Angpt2 | Forward: 5’ TTAGCACAAAGGATTCGGACAATGAC 3’ Reverse: 5’ TCTGGTAGTGTAGGCAGGCATTTAG 3’ |
69 |
| Vegfa | Forward: 5’ GTGAGCCTTGTTCAGAGCGGAGA 3’ Reverse: 5’ CGGTGACGATGATGGCGTGGTG 3’ |
69 |
| Hif-1α | Forward: 5’ TTACCTTCATCGGAAACTCCAAAGC 3’ Reverse: 5’ ACTGGGACTGTTAGGCTGGGAAAA 3’ |
69 |
| Rpl13a | Forward: 5’ AGTTTGCTTACCTGGGGCGTCTG 3’ Reverse: 5’ TCCACATTCTTTTCTGCCTGTTTCCG 3’ |
69 |
Bone histomorphometry
Five-micron serial sections of mouse tibiae were cut on a Leica RM2165 microtome (Leica Microsystems, Milton Keynes, UK) with a tungsten-carbide blade, deplasticized in 2-methoxyethyl acetate and stained using a modified Goldner trichrome for histomorphometric analysis and mounted in Permount (Fisher Scientific, Pittsburgh, PA). Analysis of the Goldner trichrome stained sections was performed in the area 0.525–1.225 mm below the growth plate [15, 16]. The percentage of bone volume in tissue volume (BV/TV), bone surface to bone volume (BS/BV), percentage of tumor volume in tissue volume (TuV/TV), trabecular thickness in µm (Tb.Th), trabecular number per mm (Tb.N), and trabecular spacing in µm (Tb.Sp) were determined. To demonstrate alkaline phosphatase activity, slides were incubated in an alkaline-dye mixture (30 mL solution of fast blue BB salt (0.8 mg/mL) in 0.1 M Tris buffer plus 0.3 mL naphthol ASTR phosphate and N,N,n-dimethyl-formamide (0.265 g/mL) (Sigma-Aldrich)) in the presence of 10 mg MgCl2 (pH 9). To demonstrate acid phosphatase activity, slides were incubated in an aqueous coupling azo dye mixture (solution of 1 mL NaNO2 (40 mg/mL), 1 mL pararosaniline (50 mg/mL), 0.25 mL of 12 M HCl; added to a 23 mL 0.1 M acetate buffer in 0.3 mL naphthol ASTR phosphate and N,N-dimethyl-formamide (0.265 g/mL) substrate (Sigma-Aldrich)) in the presence of 57.5 mg sodium tartrate (pH 4). Image analysis was conducted using an Olympus BX41 microscope and attached Retiga 1300 camera (QImaging, Surrey, BC, Canada) using Bioquant Nova Prime software, version 6.50.10 (R&M Biometrics, Nashville, TN).
Subcutaneous Xenograft Histomorphometry
To determine the subcutaneous tumor epithelial area and necrotic area, three five-micron sections, each one hundred microns apart were stained with hematoxylin & eosin. The tumor epithelial and necrotic areas were analyzed using Bioquant Nova Prime software, version 6.50.10 (R&M Biometrics).
Immunohistochemistry
To assess cell proliferation, five-micron formalin fixed paraffin-embedded LuCaP 23.1 sections were stained using an anti-BrdU immunohistochemistry kit (Zymed, San Francisco, CA). Positively and negatively staining tumor cell nuclei were counted in five fields at 200X magnification. To assess microvessel density five-micron tissue sections were deparaffinized and antigen retrieved in 10 mM citrate buffer (pH 6). The slides were incubated with 3% H2O2, blocked with an avidin/biotin blocking solution (Vector Laboratories Inc. Burlingame, CA) and then a 5% chicken/goat/horse serum solution. The sections were incubated with rat anti-mouse CD34 antibody (5 µg/mL (ab8158, Abcam, Cambridge, UK)). Negative control slides were incubated with rat IgG at the same concentration. All slides were then incubated with rabbit anti-rat biotinylated secondary antibody (10 µg/mL (ab6733, Abcam)), developed using the Vectastain ABC kit (Vector Laboratories Inc.) and stable DAB (Invitrogen Corp.), counterstained with hematoxylin, dehydrated and mounted with Cytoseal XYL (Richard-Allan Scientific, Kalamazoo, MI). After scanning at low magnification for microvessel hotspots, blood vessels were counted in three representative fields of each tissue section at 200× magnification. A blood vessel was defined as any immunostained endothelial cell or endothelial cell cluster separated from adjacent vessels. For fluorescent immunohistochemistry five-micron sections of formalin fixed paraffin embedded LuCaP 23.1 xenografts were deparaffinized, antigen retrieved in 10 mM citrate buffer (pH 6) and blocked with 5% chicken/goat/horse serum. The sections were then incubated with the following primary antibodies: rat monoclonal CD34 (ab8158, Abcam; 5 µg/mL), or rat IgG (5 µg/mL) as negative control; and mouse monoclonal α smooth muscle actin (M0851, Dako North America, Inc., Carpinteria, CA; 3.5 µg/mL), or mouse monoclonal MOPC-21 (3.5 µg/mL) as negative control. For imaging, samples were incubated with the following secondary antibodies: Alexa fluor 488 (A-11006, Invitrogen; 5 µg/mL), and Alexa fluor 546 (A-1130, Invitrogen; 5 µg/mL). Sections were cover slipped with ProLong® Gold antifade reagent with DAPI (Invitrogen). Imaging was performed on an Olympus BX41 microscope using Q-capture 2.90.1 software.
Statistical Analysis
Statistical analyses of the results were performed using Prism software (Prism Graphpad, San Diego, CA). Significance of differences was evaluated using paired and unpaired Student's t tests as appropriate, with p values ≤ 0.05 indicating statistical significance.
Results
L1–10 decreases tumor growth in LuCaP 23.1 subcutaneous tumors
We have previously shown that there are considerably greater levels of angiopoietin-2 than angiopoietin-1 in PCa metastases [9]. Therefore, we first examined whether our model, LuCaP 23.1, mimics the situation in human metastasis. Our results showed that there were higher levels (22.89 fold ± 2.76 SEM) of angiopoietin-2 than angiopoietin-1 mRNA transcripts in subcutaneously grown LuCaP 23.1 tumors (n=9) (data not shown).
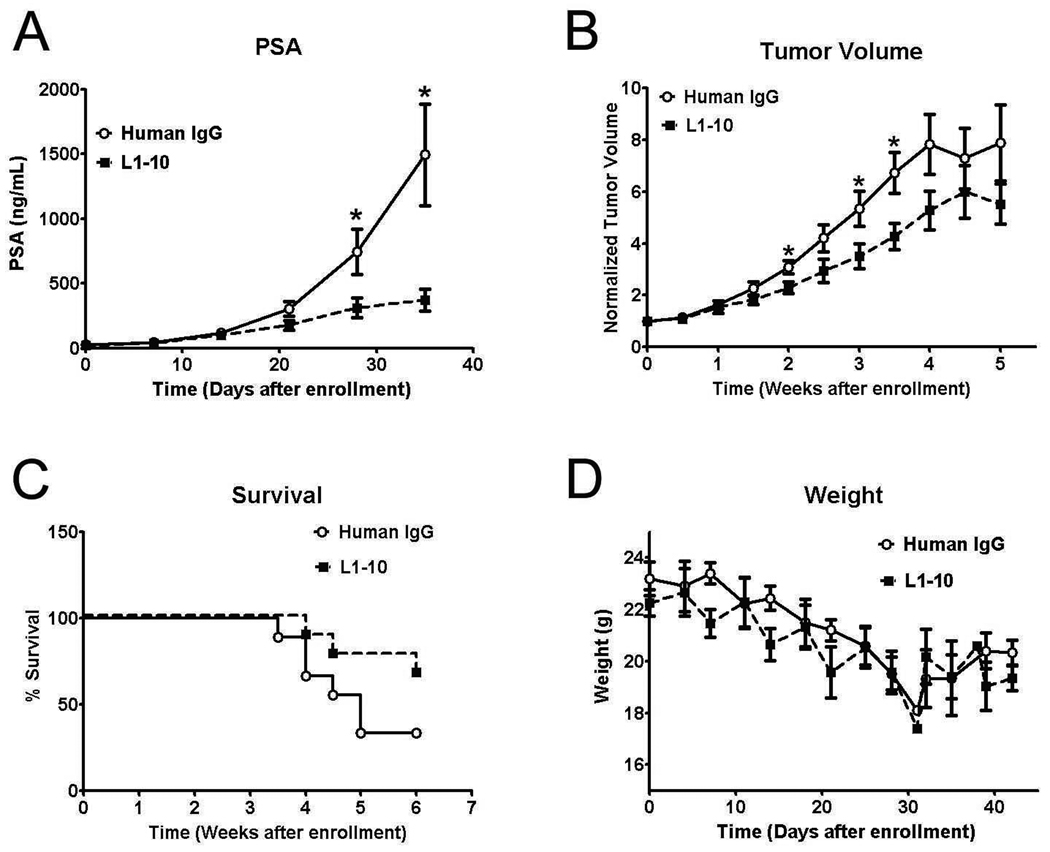
Treatment with L1–10 resulted in a reduction in serum PSA levels in comparison to the control group (Figure 1A), with a significant decrease in serum PSA (p<0.05) by week four after enrollment. Tumor volume was also significantly decreased by L1–10 treatment at different time points during the study (p<0.05) with significance being lost at the end of the study (Figure 1B). The loss of significance is most likely due to the small number of animals remaining in the control arm of the study after week four, as animals were sacrificed once tumors reached 1 g. The loss of animals in both arms of the study is visible in Figure 1C, where the survival curve for the control arm starts to dip considerably after week four, with the difference between the two groups approaching significance using a Log-rank Mantel-Cox test (p=0.0737). Subcutaneous LuCaP 23.1 tumors cause decreases in weight of the experimental animals, and the treatment of the LuCaP 23.1 subcutaneous tumors with L1–10 had no effect on these decreases (Figure 1D). One animal was excluded from each arm of the study as necrosis in the tumor tissue negated analysis.
Figure 1. L1–10 decreases tumor volume and serum PSA while improving survival in subcutaneous LuCaP 23.1 tumor xenografts.
(A) Serum PSA levels in control and L1–10 treated animals bearing LuCaP 23.1 subcutaneous tumors. (B) Subcutaneous LuCaP 23.1 tumor volume in control and L1–10 treated animals. (C) Survival in SCID mice with subcutaneous LuCaP 23.1 tumors. (D) Weight of subcutaneous LuCaP 23.1 tumors in control and L1–10 treated animals. For all experiments: control (n=9) and L1–10 treated (n=9) animals were sacrificed when tumors reached 1g in size. Results are plotted as mean ± SEM. * indicates significance (p<0.05).
Histomorphometric analysis of the LuCaP 23.1 subcutaneous tumors
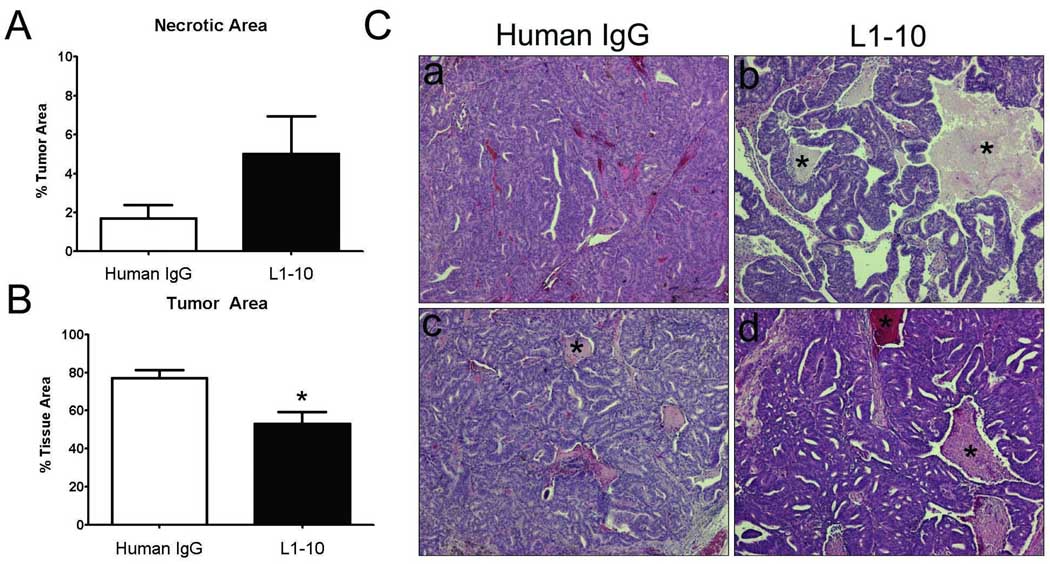
There was a more pronounced difference between the serum PSA levels when compared to tumor volumes in L1–10 vs. control LuCaP 23.1 subcutaneous xenografts. To determine if there was a greater loss of the epithelial portion of the LuCaP 23.1 subcutaneous tumors as a % of total tumor volume we analyzed each tumor xenograft using Bioquant Nova Prime software. We determined that there was an increase in necrotic area as a % of tumor area in the L1–10 treated LuCaP 23.1 vs. control tumors (p=0.13) (Figure 2A). Additionally, we determined that there was a significant loss of the epithelial portion of the L1–10 treated LuCaP 23.1 subcutaneous tumors when compared to control tumors (p=0.0063) (Figure 2B). The remaining difference between the two groups was most likely due to an increase in the stromal portion of the L1–10 treated animals. This significant decrease in the epithelial portion of the LuCaP 23.1 subcutaneous tumors is in addition to the significant differences observed in tumor volume between the L1–10 treated and control tumors. Examples of the subcutaneous tumors are shown in Figure 2C.
Figure 2. Histomorphometric analysis reveals a decrease in tumor area and an increase in necrotic regions of L1–10 treated LuCaP 23.1 subcutaneous xenografts.
(A) Histomorphometric analysis of necrotic area as a % of tumor area in control and L1–10 treated LuCaP 23.1 subcutaneous tumors. (B) Histomorphometric analysis of tumor area in control and L1–10 treated LuCaP 23.1 subcutaneous tumors * (p=0.0063). (C) Representative images of control and L1–10 treated LuCaP 23.1 subcutaneous tumors. * Highlights necrotic regions. For all experiments: control (n=9) and L1–10 treated (n=9). Results are plotted as mean ± SEM.
L1–10 decreases epithelial cell proliferation in LuCaP 23.1 subcutaneous xenografts
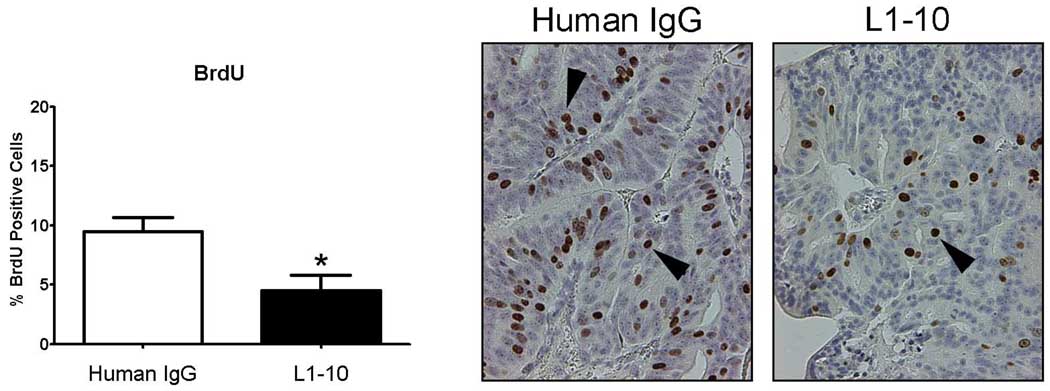
As we observed decreases in serum PSA, tumor volume and tumor area as a % of tissue area, we questioned whether L1–10 treatment influenced tumor cell proliferation. BrdU staining was significantly decreased in the L1–10 (9.5 ± 3.5) vs control (4.7 ± 4.1) treated LuCaP 23.1 subcutaneous tumors (p=0.012), virtually halving the number of BrdU positive cells (Figure 3).
Figure 3. L1–10 decreased epithelial cell proliferation in LuCaP 23.1 subcutaneous xeonografts.
A graph of % BrdU positive cells in control and L1–10 treated LuCaP 23.1 subcutaneous tumors * (p=0.012). Arrows highlight BrdU positive nuclei. Control (n=9) and L1–10 treated (n=9). Results are plotted as mean ± SEM.
L1–10 decreases microvessel density and alters angiogenesis-associated gene expression in LuCaP 23.1 subcutaneous xenografts
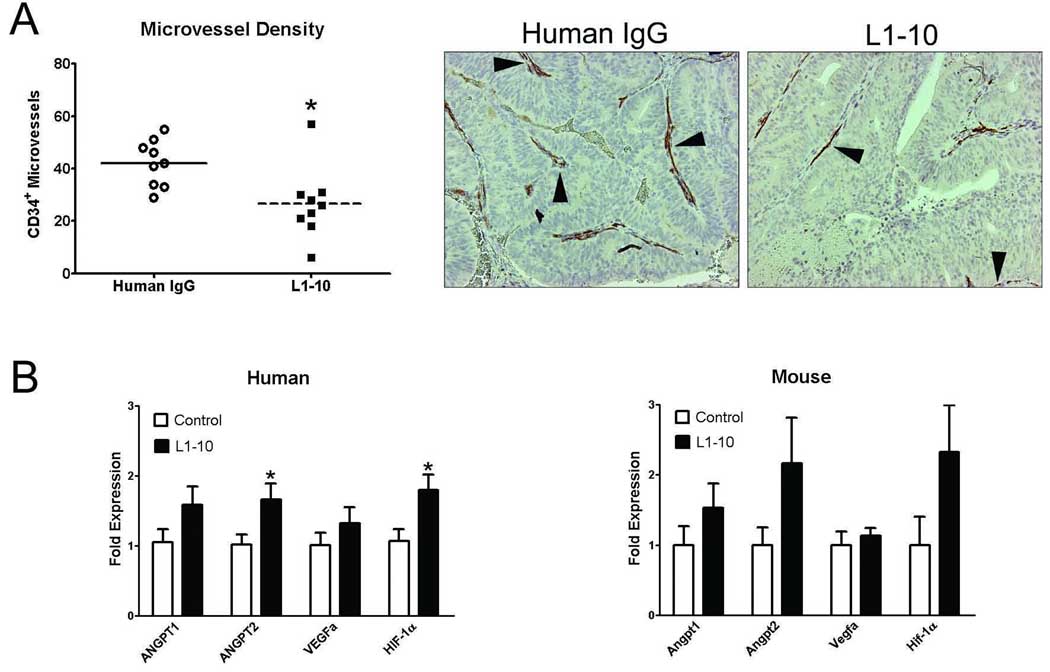
To determine if inhibition of angiopoietin-2 activity by L1–10 will impede angiogenesis in PCa tumors, we assessed microvessel density in the LuCaP 23.1 subcutaneous tumors by immunohistochemistry. Microvessel density was significantly decreased in the L1–10-treated LuCaP 23.1 tumors when compared to control tumors (8.9 ± 4.6 vs. 14.3 ± 2.9, p=0.012) (Figure 4A).
Figure 4. L1–10 decreased microvessel density in LuCaP 23.1 subcutaneous xeonografts and alters angiogenesis-associated gene expression.
(A) Microvessel density in control and L1–10 treated LuCaP 23.1 subcutaneous tumors * (p=0.012). Arrows indicate CD34 positive vessels in representative tumor samples. (B) Angiogenesis-associated gene expression (human epithelial and mouse stromal) in control and L1–10 treated LuCaP 23.1 subcutaneous tumors * (p≤0.05). mRNA expression was calculated relative to RPL13a mRNA expression and then normalized to angiopoietin-1 mRNA expression. For all experiments: control (n=9) and L1–10 treated (n=9). Results are plotted as mean ± SEM.
We hypothesized that if angiopoietin-2 activity was blocked, the lack of microvessels would lead to a hypoxic response documented by an increase in hypoxia-associated genes. We observed increases in human ANGPT1, ANGPT2, VEGFa and HIF-1α (angiopoietin-1, angiopoietin-2, vascular endothelial growth factor a, and hypoxia inducible factor 1α) mRNA expression in L1–10 vs. control LuCaP 23.1 subcutaneous tumors. However, a significant difference (p≤0.05) was only observed in ANGPT2 and HIF1-α mRNA expression (Figure 4B). The stroma of the LuCaP 23.1 xenografts is mouse derived therefore we assessed the expression of mouse Angpt1, Angpt2, Vegfa and Hif-1α mRNA expression. The expression of Angpt1, Angpt2 and Hif-1α mRNA increased with little to no change observed in Vegfa mRNA expression however, none of the changes were statistically significant (Figure 4B).
Blocking angiopoietin-2 activity does not alter tumor microvessel maturation in LuCaP 23.1 xenografts
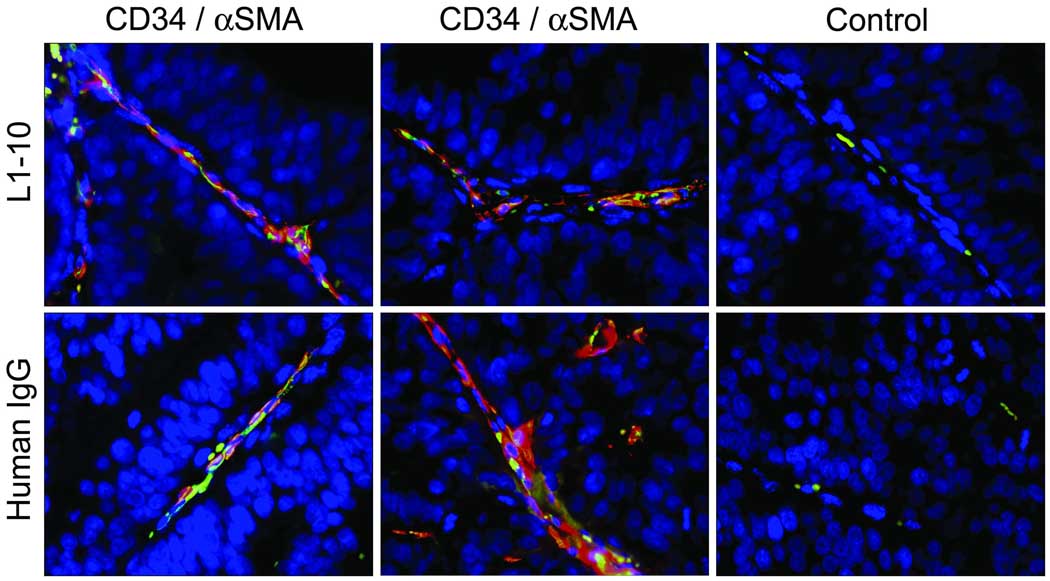
Angiopoietin-2 induces reversion of vessels to a more plastic immature state, whereas angiopoietin-1 helps maintain mature vessels by promoting interaction between endothelial cells and surrounding support cells e.g. pericytes [17]. We investigated the maturation state of the microvessels by staining the LuCaP 23.1 subcutaneous tumors for endothelial cells with anti-CD34 antibody and pericytes with anti-α smooth muscle actin (αSMA). We did not observe any visual difference in αSMA coverage of CD34 positive microvessels between the two groups (Figure 5).
Figure 5. No difference in α smooth muscle actin (αSMA) was observed in the vessels of control and L1–10 treated LuCaP 23.1 subcutaneous xeonografts.
Representative images of the immunohistochemical co-localization of CD34 (green), αSMA (red), control Rat IgG, and MOPC-21 antibodies in L1–10 (n=4) and control (n=4) treated LuCaP 23.1 subcutaneous tumors.
Tumor growth and bone response are altered in L1–10 treated LuCaP 23.1 intra-tibial tumors
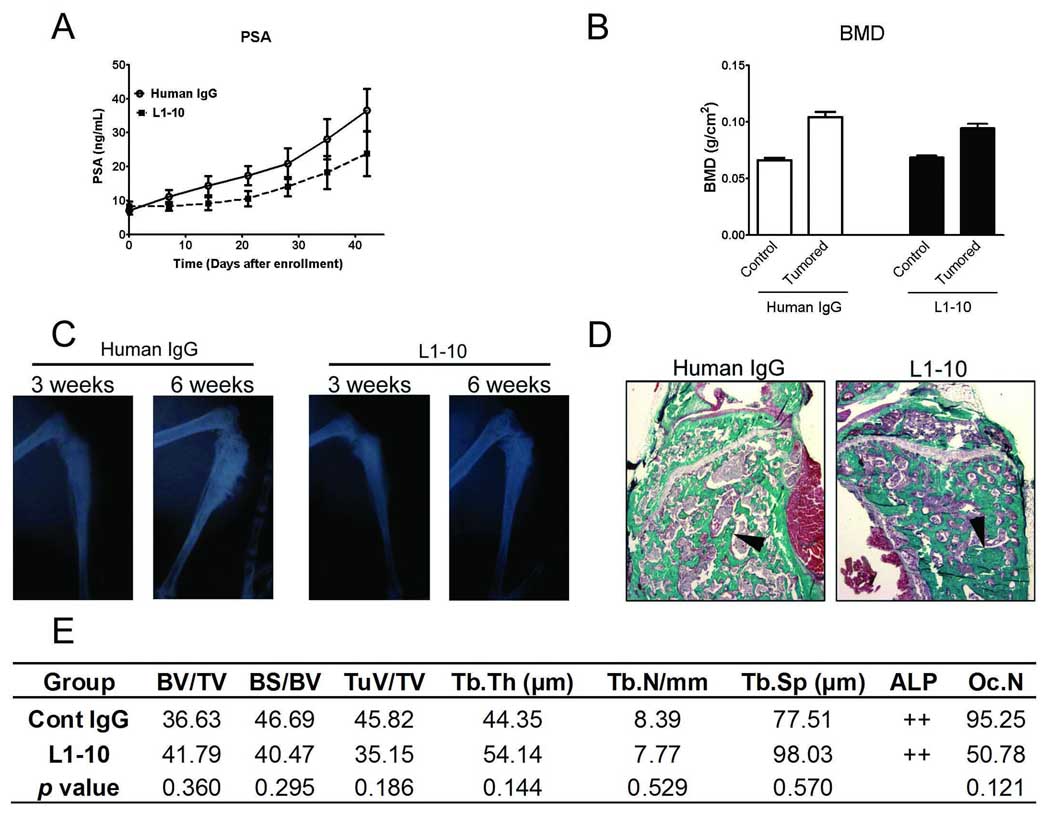
PCa has a proclivity to go to bone and the tumor microenvironment alters tumor behavior, therefore we set out to determine the effect of L1–10 treatment on LuCaP 23.1 growth in the bone. In a previous study, we observed differences in tumor response in subcutaneous tumors vs. bone. Docetaxel administered every two weeks significantly inhibited the growth of subcutaneous LuCaP 23.1. However, the effectiveness of docetaxel as a single drug against growth of LuCaP 23.1 in the bone was insignificant [18]. Therefore, we increased the frequency of L1–10 administration from twice a week to three times a week in this experiment. To monitor tumor burden in the tibiae, serum PSA levels were measured in animals bearing LuCaP 23.1 tumors. There was a trend toward reduced serum PSA levels in the L1–10 treated animals when compared to the control group, over the course of the study (Figure 6A). There were no differences in animal weights between the two groups (data not shown).
Figure 6. Tumor growth and bone response are altered in L1–10 treated LuCaP 23.1 intra-tibial tumors.
(A) Serum PSA levels in animals bearing LuCaP 23.1 intra-tibial tumors in control and L1–10 treated animals. (B) Bone mineral density (BMD) of LuCaP 23.1 control (left tibia) and tumored (right tibia) of control and L1–10 treated tumors. (C) Radiographs of the right tumored tibiae of a representative animal from the control and L1–10 treated group after three and six weeks. (D) Mineralized tibiae were harvested 6 weeks after tumor injection and embedded in methyl methacrylate. Five micron sections were stained with Goldner's trichrome stain. In tumor-bearing animals the tumor replaced the marrow and promoted trabecular bone growth. Arrows highlight osteoblastic bone. (E) Bone histomorphometry of Goldner’s trichrome stained tumored tibiae. For all experiments: control (n=8) and L1–10 (n=9). Results are plotted as mean ± SEM. * indicates significance (p<0.05).
LuCaP 23.1 tumors in the bone have an osteoblastic phenotype [14]. Bone response was determined using a number of parameters. There were no visible changes between the groups over the course of the study. Bone mineral density (BMD) was not significantly different in the L1–10 vs. control LuCaP 23.1 intra-tibial tumors (Figure 6B). However BMD and radiographs clearly revealed an increase in bone in the LuCaP 23.1 tumored tibiae over the course of the study (Figure 6C).
To further examine potential effects on the bone we used bone histomorphometry (Figure 6D). A number of histomorphometric parameters were assessed (Figure 6E). None of the parameters assessed showed significant differences. However, the percentage of tumor volume in tissue volume (TuV/TV) was decreased in L1–10 vs. control LuCaP 23.1 intra-tibial tumors (35.15 ± 19.41 vs. 45.82 ± 10.26, p=0.186). Additionally, osteoclast numbers (OcN) were also decreased in L1–10 vs. control LuCaP 23.1 intra-tibial tumors (50.78 ± 39.50 vs. 95.25 ± 69.70, p=0.121). One animal was excluded from the L1–10 treated arm and two animals from the control arm as one sample had no obvious tumor in the bone and two samples had tumor growth outside of the bone at time of sacrifice limiting our ability to interpret the results for these two samples.
DISCUSSION
Our previous findings that angiopoietin-2 is expressed in clinical samples of PCa bone and soft tissue metastases, with limited expression of angiopoietin-1, suggests that angiopoietin-2 promotes angiogenesis in PCa metastases [9]. LuCaP 23.1 is an androgen-sensitive, PSA producing PCa xenograft [14]. The LuCaP 23.1 tumors also express an excess of angiopoietin-2 over angiopoietin-1 making it an excellent model to test the effect of the angiopoietin-2 inhibitor L1–10 on PCa tumor growth and microvessel response.
L1–10 blocks both mouse and human interactions between angiopoietin-2 and the tie2 receptor in endothelial cells. This allowed us to examine the effects of blocking tumor and stromal derived angiopoietin-2 in the LuCaP 23.1 PCa xenograft model. The LuCaP 23.1 subcutaneous tumors we treated with L1–10 were established tumors over 100 mm3 in size. As angiopoietin-2 promotes microvessel outgrowth from mature vessels, we did not expect to decrease original tumor volume, but to limit new vessel formation promoted by angiopoietin-2, and consequently, tumor growth.
Although L1–10 did decrease tumor volume, we observed a slight discordance between the decrease in serum PSA levels and tumor volume in the L1–10 treated subcutaneous tumors. The larger decreases in PSA vs. tumor volume might have been due to changes in the tumor vasculature rather than a decrease in tumor epithelial cell number. However, the subcutaneous xenograft histomorphometry that determined tumor epithelial and necrotic area showed that there were fewer viable tumor epithelial cells present in the L1–10 treated LuCaP 23.1 subcutaneous tumors. Therefore the loss of the epithelial portion of the tumor in concert with the decrease in tumor volume would explain the significant differences in serum PSA between the L1–10 and control treated subcutaneous tumors.
The histomorphometric differences between the L1–10 and control subcutaneous tumors were in part due to an increase in the percentage of necrotic areas in the L1–10 treated tumors. This may be due to an inability of phagocytic cells to effectively clear dead cells from the tumor. There was also an increase in the stromal component of the L1–10 treated tumors relative to control [19]. There also appeared to be an increase in ‘blood islands’ on occasions. These data, in concert with a halving of cell proliferation in the L1–10-treated LuCaP 23.1 subcutaneous tumors, demonstrate the significant effect of L1–10 on tumor growth in the LuCaP 23.1 subcutaneous xenografts. Additionally, survival (based upon animals being sacrificed when tumors reached 1 g), was improved in the animals administered L1–10.
Our hypothesis was that L1–10 would decrease tumor growth and viability through the inhibition of angiogenesis leading to hypoxia and cell death. L1–10 had a significant effect on microvessel density demonstrating that blocking angiopoietin-2 inhibits angiogenesis in the LuCaP 23.1 subcutaneous tumors. Furthermore, the concomitant increase in the expression of human and mouse angiogenesis-associated transcripts suggest that the loss of microvessel outgrowth caused an increase in hypoxia in the subcutaneous LuCaP 23.1 xenograft cells.
During tumor angiogenesis, endothelial cells, mesenchymal cells and tumor cells secrete angiopoietin-2, resulting in pericyte dissociation from pre-existing vessels. As a result, the endothelial cells can migrate, proliferate and assemble into tubes from preexisting vessels in the presence of VEGF. When the balance favors angiopoietin-1 over angiopoietin-2 in the microenvironment, angiopoietin-1 can recruit pericytes to these immature vessels, stabilizing the vessel walls and promoting vessel maturation [20]. Differences in pericyte coverage have been observed in solid tumors [20, 21]. We did not observe any differences in αSMA coverage of CD34 positive vessels in the LuCaP 23.1 subcutaneous tumors suggesting that there were no immature vessels present. We hypothesize that the vessel maturation might be relatively quick in the LuCaP 23.1 xenografts limiting our ability to capture CD34 positive microvessels without αSMA coverage in the control animals. While we did not evaluate it in our study, blocking angiopoietin-1 in addition to the angiopoietin-2 could further potentiate the decrease in tumor microvessel density we observed in the LuCaP 23.1 xenografts employing angiopoietin-2 blockade alone [4].
There was a weaker tumor response in the bone microenvironment when compared to subcutaneous tumors. There is some evidence that PCa tumors in the bone environment do not respond as effectively to some therapies [18]. This could be for a number of reasons including, but not limited to the availability of the drug, increased tumor resistance, or differences in blood vessels in the bone microenvironment. Even though we increased the treatment frequency, we observed only a limited effect of L1–10 on PSA and tumor area in the LuCaP 23.1 tumors in the bone. As stated above the limited effect could be due to a number of reasons. However, we hypothesize that the tumor size influenced the response of the intra-tibial LuCaP 23.1 tumor cells to the angiogenesis inhibitor. The subcutaneous LuCaP 23.1 tumors were established tumors of approximately 100 mm3 in size. Blood vessel growth is only required once the tumor reaches a diameter of approximately 0.4 mm3 [22]. Therefore, L1–10 impacts tumor growth in the established LuCaP 23.1 subcutaneous xenografts, but the intra-tibial tumors being extremely small, may have limited requirements for new vessel formation and therefore do not demonstrate significant impact from exposure to an angiogenesis inhibitor.
In conclusion, our results demonstrate that inhibiting angiopoietin-2 activity impedes angiogenesis and tumor growth of LuCaP 23.1 PCa xenografts. Based on these data, we hypothesize that angiopoietin-2 inhibition in combination with other treatments may represent a potential therapy for patients with metastatic disease.
Acknowledgements
These studies were supported by the National Institutes of Health P50CA097186. CM is a recipient of the Career Development Award from the Pacific Northwest Prostate Cancer SPORE. We would like to thank Lisha Brown and Tiffany Pitts for technical advice.
References
- 1.Folkman J, Greenspan HP. Influence of geometry on control of cell growth. Biochim Biophys Acta. 1975;417:211–236. doi: 10.1016/0304-419x(75)90011-6. [DOI] [PubMed] [Google Scholar]
- 2.Folkman J. Tumor angiogenesis: a possible control point in tumor growth. Ann Intern Med. 1975;82:96–100. doi: 10.7326/0003-4819-82-1-96. [DOI] [PubMed] [Google Scholar]
- 3.Yancopoulos GD, Davis S, Gale NW, Rudge JS, Wiegand SJ, Holash J. Vascular-specific growth factors and blood vessel formation. Nature. 2000;407:242–248. doi: 10.1038/35025215. [DOI] [PubMed] [Google Scholar]
- 4.Falcon BL, Hashizume H, Koumoutsakos P, Chou J, Bready JV, Coxon A, Oliner JD, McDonald DM. Contrasting actions of selective inhibitors of angiopoietin-1 and angiopoietin-2 on the normalization of tumor blood vessels. Am J Pathol. 2009;175:2159–2170. doi: 10.2353/ajpath.2009.090391. [DOI] [PMC free article] [PubMed] [Google Scholar]
- 5.Ferrer FA, Miller LJ, Andrawis RI, Kurtzman SH, Albertsen PC, Laudone VP, Kreutzer DL. Angiogenesis and prostate cancer: in vivo and in vitro expression of angiogenesis factors by prostate cancer cells. Urology. 1998;51:161–167. doi: 10.1016/s0090-4295(97)00491-3. [DOI] [PubMed] [Google Scholar]
- 6.Duque JL, Loughlin KR, Adam RM, Kantoff PW, Zurakowski D, Freeman MR. Plasma levels of vascular endothelial growth factor are increased in patients with metastatic prostate cancer. Urology. 1999;54:523–527. doi: 10.1016/s0090-4295(99)00167-3. [DOI] [PubMed] [Google Scholar]
- 7.Haggstrom S, Bergh A, Damber JE. Vascular endothelial growth factor content in metastasizing and nonmetastasizing Dunning prostatic adenocarcinoma. Prostate. 2000;45:42–50. doi: 10.1002/1097-0045(20000915)45:1<42::aid-pros5>3.0.co;2-e. [DOI] [PubMed] [Google Scholar]
- 8.Stavridi F, Karapanagiotou EM, Syrigos KN. Targeted therapeutic approaches for hormone-refractory prostate cancer. Cancer Treat Rev. 2010;36:122–130. doi: 10.1016/j.ctrv.2009.06.001. [DOI] [PubMed] [Google Scholar]
- 9.Morrissey C, True LD, Roudier MP, Coleman IM, Hawley S, Nelson PS, Coleman R, Wang YC, Corey E, Lange PH, Higano CS, Vessella RL. Differential expression of angiogenesis associated genes in prostate cancer bone, liver and lymph node metastases. Clin Exp Metastasis. 2008;25:377–388. doi: 10.1007/s10585-007-9116-4. [DOI] [PubMed] [Google Scholar]
- 10.Tesan T, Gustavsson H, Welen K, Damber JE. Differential expression of angiopoietin-2 and vascular endothelial growth factor in androgen-independent prostate cancer models. BJU Int. 2008;102:1034–1039. doi: 10.1111/j.1464-410X.2008.07768.x. [DOI] [PubMed] [Google Scholar]
- 11.Lind AJ, Wikstrom P, Granfors T, Egevad L, Stattin P, Bergh A. Angiopoietin 2 expression is related to histological grade, vascular density, metastases, and outcome in prostate cancer. Prostate. 2005;62:394–399. doi: 10.1002/pros.20163. [DOI] [PubMed] [Google Scholar]
- 12.Tressel SL, Kim H, Ni CW, Chang K, Velasquez-Castano JC, Taylor WR, Yoon YS, Jo H. Angiopoietin-2 stimulates blood flow recovery after femoral artery occlusion by inducing inflammation and arteriogenesis. Arterioscler Thromb Vasc Biol. 2008;28:1989–1995. doi: 10.1161/ATVBAHA.108.175463. [DOI] [PMC free article] [PubMed] [Google Scholar]
- 13.Oliner J, Min H, Leal J, Yu D, Rao S, You E, Tang X, Kim H, Meyer S, Han SJ, Hawkins N, Rosenfeld R, Davy E, Graham K, Jacobsen F, Stevenson S, Ho J, Chen Q, Hartmann T, Michaels M, Kelley M, Li L, Sitney K, Martin F, Sun JR, Zhang N, Lu J, Estrada J, Kumar R, Coxon A, Kaufman S, Pretorius J, Scully S, Cattley R, Payton M, Coats S, Nguyen L, Desilva B, Ndifor A, Hayward I, Radinsky R, Boone T, Kendall R. Suppression of angiogenesis and tumor growth by selective inhibition of angiopoietin-2. Cancer Cell. 2004;6:507–516. doi: 10.1016/j.ccr.2004.09.030. [DOI] [PubMed] [Google Scholar]
- 14.Ellis WJ, Vessella RL, Buhler KR, Bladou F, True LD, Bigler SA, Curtis D, Lange PH. Characterization of a novel androgen-sensitive, prostate-specific antigen-producing prostatic carcinoma xenograft: LuCaP 23. Clin Cancer Res. 1996;2:1039–1048. [PubMed] [Google Scholar]
- 15.Corey E, Quinn JE, Bladou F, Brown LG, Roudier MP, Brown JM, Buhler KR, Vessella RL. Establishment and characterization of osseous prostate cancer models: intra-tibial injection of human prostate cancer cells. Prostate. 2002;52:20–33. doi: 10.1002/pros.10091. [DOI] [PubMed] [Google Scholar]
- 16.Recker RR. Bone Histomorphometry: Techniques and Interpretation. CRC Press; 1983. [Google Scholar]
- 17.Ahmad SA, Liu W, Jung YD, Fan F, Reinmuth N, Bucana CD, Ellis LM. Differential expression of angiopoietin-1 and angiopoietin-2 in colon carcinoma. A possible mechanism for the initiation of angiogenesis. Cancer. 2001;92:1138–1143. doi: 10.1002/1097-0142(20010901)92:5<1138::aid-cncr1431>3.0.co;2-l. [DOI] [PubMed] [Google Scholar]
- 18.Brubaker KD, Brown LG, Vessella RL, Corey E. Administration of zoledronic acid enhances the effects of docetaxel on growth of prostate cancer in the bone environment. BMC Cancer. 2006;6:15. doi: 10.1186/1471-2407-6-15. [DOI] [PMC free article] [PubMed] [Google Scholar]
- 19.Erler JT, Weaver VM. Three-dimensional context regulation of metastasis. Clin Exp Metastasis. 2009;26:35–49. doi: 10.1007/s10585-008-9209-8. [DOI] [PMC free article] [PubMed] [Google Scholar]
- 20.Yonenaga Y, Mori A, Onodera H, Yasuda S, Oe H, Fujimoto A, Tachibana T, Imamura M. Absence of smooth muscle actin-positive pericyte coverage of tumor vessels correlates with hematogenous metastasis and prognosis of colorectal cancer patients. Oncology. 2005;69:159–166. doi: 10.1159/000087840. [DOI] [PubMed] [Google Scholar]
- 21.Nasarre P, Thomas M, Kruse K, Helfrich I, Wolter V, Deppermann C, Schadendorf D, Thurston G, Fiedler U, Augustin HG. Host-derived angiopoietin-2 affects early stages of tumor development and vessel maturation but is dispensable for later stages of tumor growth. Cancer Res. 2009;69:1324–1333. doi: 10.1158/0008-5472.CAN-08-3030. [DOI] [PMC free article] [PubMed] [Google Scholar]
- 22.Gimbrone MA, Jr, Leapman SB, Cotran RS, Folkman J. Tumor dormancy in vivo by prevention of neovascularization. J Exp Med. 1972;136:261–276. doi: 10.1084/jem.136.2.261. [DOI] [PMC free article] [PubMed] [Google Scholar]


