Abstract
The brevity of molecular dynamics simulations often limits their utility in developing and evaluating structural models of proteins. The duration of simulations can be increased greatly by using Discrete Molecular Dynamics (DMD). However, the trade off is that coarse graining, implicit solvent, and other time-saving procedures reduce the accuracy of DMD simulations. Here we address some of these issues by comparing results of DMD and conventional all atom MD simulations on proteins of known structure and misfolded proteins. DMD simulations were performed at a range of temperatures to identify a ‘physiological’ temperature for DMD that mimicked molecular motions of conventional MD simulations at 310K. We also compared results obtained with a new implicit solvent model developed here based on Miyazawa-Jernigan interaction pair potential to those obtained with a previously used model based on Kyte-Doolittle hydropathy scale. We compared DMD and all atom molecular dynamics with explicit water by simulating both correctly and incorrectly folded structures, and monomeric and dimeric α β-barrel structures to analyze the ability of these procedures to distinguish between good and bad models. Deviations from the correct structures were substantially greater with DMD, as would be expected from coarse-graining and longer simulation time. Deviations were smallest for β-strands and greatest for coiled loops. Structures of the incorrectly folded models were very poorly preserved during the DMD simulations; but both methods were able to distinguish between the correct and incorrect structures based on differences in the magnitudes of the root mean squared deviation (RMSD) from the starting conformation.
INTRODUCTION
Molecular dynamics (MD) simulations are widely used in studies of protein folding and aggregation, ligand binding, kinetics, and in developing and evaluating structural models. Although the accuracy of all-atom explicit solvent MD simulations is desirable, their high computational costs limit the timescale to the range of μ seconds1. However, biological phenomena such as aggregation or fibrilization of amyloid-β proteins take place on a time scale of seconds or even hours2. Simplifications such as coarse-graining of the peptide model, using an implicit solvent model, or discretizing intermolecular potentials have been developed to reduce time limitations of all-atom simulation. These can be implemented individually or combined3. Discrete MD (also called Discontinuous MD or DMD) uses discretized or step potentials for intermolecular interactions4;5.
Our lab has recently developed numerous structural models of soluble amyloid beta (Aβ) oligomers6. Relatively short MD simulations were used to refine and evaluate these models; e.g., iterative six ns simulations were used during the development phase and final models were simulated for 20 ns. However, we feared that these simulations may be too short to reveal structural instabilities in our models. Substantial successes have been achieved using DMD to predict protein folding7, analyze protein flexibility8, macromolecular aggregation9–16, macro and supramolecular transitions17, and protein oligomerization18;19. Recently, DMD with a four-bead peptide model used to study aggregation of amyloid-β peptides18–20. This four-bead peptide model has the advantage of specifying left or right handedness of residues with minimal number of beads. Thus, we decided to use DMD to prolong our simulations.
We were aware that simplifications required to speed the DMD simulations likely introduce errors; however, the impact of these approximations on the accuracy of DMD simulated-protein structures had not been evaluated thoroughly. Thus, we were uncertain what to expect from DMD if our models were correct, and whether DMD could distinguish between good and bad models. Thus we decided to first evaluate the performance of DMD on known and misfolded protein structures and to compare these results to those obtained with conventional all atom MD simulations.
Our study addresses the following questions:
What temperature should be used to obtain optimal results?
Are the results highly dependent upon which implicit solvent model is used?
How much deviation from a correct structure typically occurs during DMD simulations?
How well is the secondary structure maintained during DMD simulations?
Are the results dependent upon the secondary structure; i.e., is the deviation less or greater for primarily β structures than for primarily helical structures?
How do deviations from a correct structure during DMD simulations compare to those that soccur during more conventional all atom MD simulations?
Can DMD simulations distinguish between correct and misfolded structures; i.e., between good and bad models? Can it do so better than all atom simulations?
Can all atom simulations correct errors introduced during DMD simulations?
Temperature in DMD is related to kinetic energy of a system by the equation, where N is the number of atoms and kB is Boltzmann constant. However, physiological temperature in DMD is not apparent because intermolecular potentials depend on an implicit solvent model. Here, we simulated proteins of known structure at different DMD temperatures to identify a temperature in DMD at which the dynamic properties of the proteins resemble those obtained with conventional all-atom simulations performed at a physiological temperature.
In DMD simulations an implicit solvent model provides the energy of hydrophobicity, a major driving force of protein folding. It was unclear however, how much results of DMD simulations depend upon the specific implicit model used. To examine this question, we developed a new implicit solvent model based on Miyazawa-Jernigan (MJ) interaction pair-wise potentials21. The MJ implicit solvent model has the advantages of unambiguous implementation because solvent effects are mimicked by the assigned residue pair-wise potentials and MJ pair-wise potential takes into account additional factors such as energetically favorable interactions between oppositely charged groups and unfavorable interactions between like charged groups. Tables for pair-wise interaction potentials of the MJ and KD models are presented in the supplement. The MJ values were determine by statistical analyses of pair-wise interactions in proteins of known structure; whereas, the KD values are based primarily on partitioning of amino acid side chain analogs into a vapor phase. Values of the two tables differ primarily for interactions of Tyr and Trp with hydrophobic residues and interactions between hydrophilic residues (these interactions are more favorable in MJ, see Tables 1 and 2 of the supplement). We compared results of DMD simulations with the newly developed MJ implicit solvent model to those obtained with a previously developed implicit solvent model calculated from Kyte-Doolittle (KD) potentials22.
We also compared the abilities of DMD and NAMD23 (an all atom molecular dynamics) to preserve correctly folded structures and to distinguish between correctly and incorrectly folded structure. Most of our simulations were performed on two protein structures with distinct structural features, one has a β-barrel structure and the other is composed primarily of α-helices, and some simulations were also performed on a third α β-barrel protein. Overall, 460 DMD trajectories and 30 NAMD trajectories of 30 ns (a total of 0.9 μs) were analyzed.
METHODS
Three proteins with distinct secondary structure patterns and high resolution (less than 2.0 Å resolution) were selected for this study: a human serum retinol-binding protein (RBP with PDB ID 1JYD)24, a regulator of G-Protein signaling (RGS4 with PDB ID 1EZT)25, and triosephosphate isomerase (TIM with PDB ID 3KRS). RBP is a representative of an antiparallel β-barrel fold, comprising eight β-strands of 83 residues, 174 residues in total. RGS4 is a representative of an α-helical fold, comprising eight αhelices of 96 residues, 166 residues in total. TIM is a 498 residue dimeric α β-barrel protein. RBP and RGS4 were used for parameter tuning. Monomeric and dimeric TIMs were used for additional tests of stability and to analyze effects on subunit movements.
In DMD, continuous potentials are simplified as one or more spherically symmetric square-well potentials. Particles move with a constant velocity until they reach a distance where the potential changes. When that occurs, a DMD step is completed and new velocities are calculated with changed potentials while preserving the momentum, angular momentum and energy of the system. DMD is computationally efficient compared to conventional MD because calculations of velocities and updates of positions of particles are performed only when particles reach a location where a potential changes. The Berendsen thermostat was used to control the temperature 26. Backbone hydrogen bonding interactions were implemented as introduced previously between the carbonyl oxygen of a residue and the amide hydrogen of another residue27. We set hydrogen bonding strength to unit energy (EHB=1.0), which corresponds to 1~5 kcal/mol in proteins28. Total potential energy is expressed as the sum of hydrogen bonding energy, covalent bond energy, and residue pair-wise implicit solvent term defined in combinations of square potentials.
A four-bead peptide model was used: the polypeptide backbone of each residue is represented by three beads corresponding to the nitrogen, carbonyl C’ carbon, and Cα, and side-chains are represented as a fourth bead with dimensions that approximates the volume of the specific side chain. The side chain bead of Gly was omitted. Details about DMD with the four bead peptide model have been published elsewhere27. We used the DMD software package originally developed by Dokholyan et al.29;30
Effective interactions were applied between side chain beads to mimic effects of solvents. Implicit solvent models based on MJ contact energies21 and KD hydropathy scale22 were tested. In the MJ implicit solvent model, two side chain beads interact when they are within 6.5 Å. The strength of the interaction of the pair of residues was directly assigned from the MJ interaction pair potential. However, in the KD implicit model, the strength of interaction of a pair of residues was estimated as their average hydropathy scale values. Strengths of strongest interaction between a pair of residues were set to be equal for both MJ and KD implicit solvent models.
All atom representations were constructed from four bead models by using CHARMM31. The structures were then solvated and ionized using VMD32. The system contains about 7000 water molecules and Na+ and Cl− ions to neutralize the system. The NAMD 2.5 software package was used to perform energy minimization of 10,000 steps and then the system was simulated for 30 ns using the Biowulf parallel computing cluster of the National Institutes of Health (www.biowulf.nih.gov)23. The time step was 2 fs. The temperature was kept at 310 K, and the pressure was kept at 1 atm.
Heat capacity was calculated to address whether any structural transition temperature exists with where E is potential energy, kB is Boltzmann constant, and T is temperature33. Miyazawa-Jernigan energy (MJ energy) is calculated from all pair-wise residue interactions within a conformation using MJ interaction pair potential21.
RESULTS AND DISCUSSION
Stability tests of DMD on native structures with two implicit solvent models: MJ vs. KD
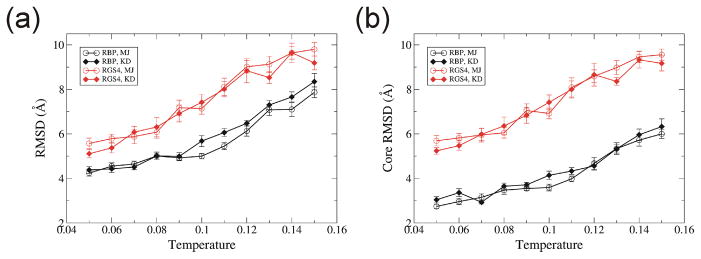
We performed DMD simulations of 10 million simulation steps starting from known structures of RBP and RGS4 at eleven temperatures, 0.05... 0.15 with step of 0.01 in DMD units. See Introduction for definition of temperature in DMD. Ten trajectories were simulated for each set of parameters with marginally different initial conformations and velocities of atoms. Root Mean Square Deviations (RMSD) from the starting structures of Cα residues of the final conformation of the whole protein [Fig. 1(a)] and a core (residues which have regular secondary structures such as α-helix or β-strand) [Fig. 1(b)] increase as a function of temperature, as expected. No substantial difference between results obtained with the two implicit solvent models was observed. RGS4 (αhelix protein) has larger RMSDs than RBP (β-barrel protein). Core RMSDs of RGS4 (αhelix protein) were in the same range as RMSDs of the whole protein. In contrast, core RMSDs of RBP (β-barrel protein) were substantially lower than RMSDs of the whole protein. This difference may occur because extensive hydrogen bonding between backbones of adjacent β-strands of the β-barrel may allow less movement within the core than can occur between adjacent α-helices.
Fig. 1.
Temperature dependence of RMSD for DMD simulations. RMSD values were calculated between the initial and the last conformation at 10 millionth step for two proteins, RBP (black) and RGS4 (red) with two implicit solvent models, Miyazawa-Jernigan (MJ) (open circles) and Kyte-Doolittle (KD) (filled diamonds) models. (a) RMSD for Cα atoms for the whole protein. (b) RMSD for a core region that has a regular secondary structure. Each RMSD value is the average over ten trajectories. Error bar denotes the standard error.
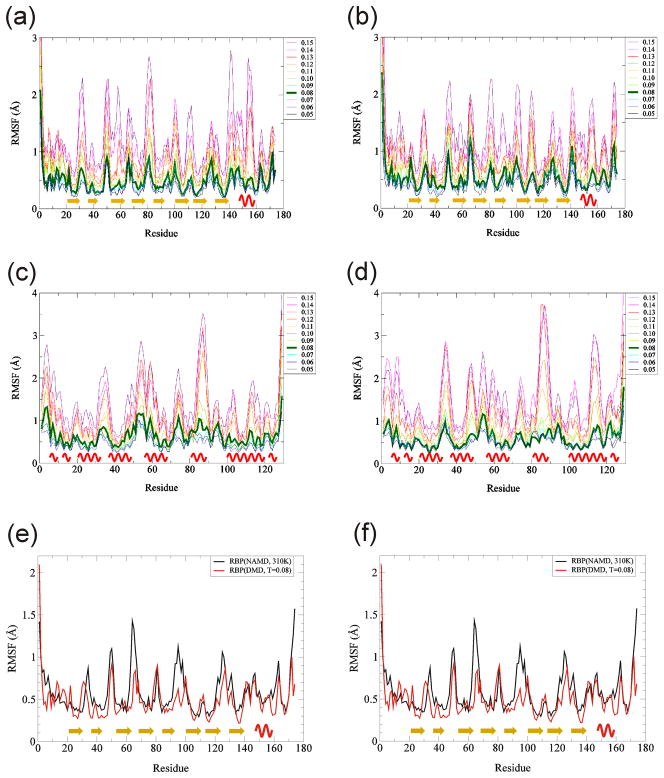
We calculated Root Mean Square Fluctuation (RMSF) of Cα residues to evaluate stabilities of the each part of the proteins. The RMSF was calculated as the standard deviation of a residue position from an averaged residue position during the last one million simulation steps [Fig. 2]. Residues with regular secondary structures were very stable in low and mid temperature range for both implicit solvent models (~ 0.5 Å of RMSFs) [Fig. 2]. RMSF of loop regions increased rapidly as temperature rises compared to α-helical or β-stranded segments. RMSFs at temperature 0.08, shown in green, were only slightly greater than at temperature 0.05 but were substantially less than at temperature 0.11 for all the cases [Fig. 2(a, b, c, and d)]. Also, RMSFs from DMD simulations at temperature 0.08 were quite similar to RMSFs from NAMD at 310 K [Fig. 2, (e,f)]. These findings indicate that 0.08 is a reasonable ‘physiological’ temperature to use for DMD simulations and indicate that residue motions near the end of DMD simulations are similar to those near the end of NAMD simulations.
Fig. 2.
Temperature dependence of RMSF. RMSF values for DMD simulations was calculated between 9 and 10 millionth steps for Cα atoms, and then averaged over ten trajectories. (a) RBP with MJ, (b) RBP with KD, (c) RGS4 with MJ, and (d) RGS4 with KD. Line colors denote temperatures as shown on the right of each graph. Temperature 0.08 is shown with a thicker green line. RMSF values for DMD at T = 0.08 are compared to RMSF values for NAMD at 310 K for (e) RBP and (f) RGS4. Yellow arrows denote β-strands, and red waves denote α-helices.
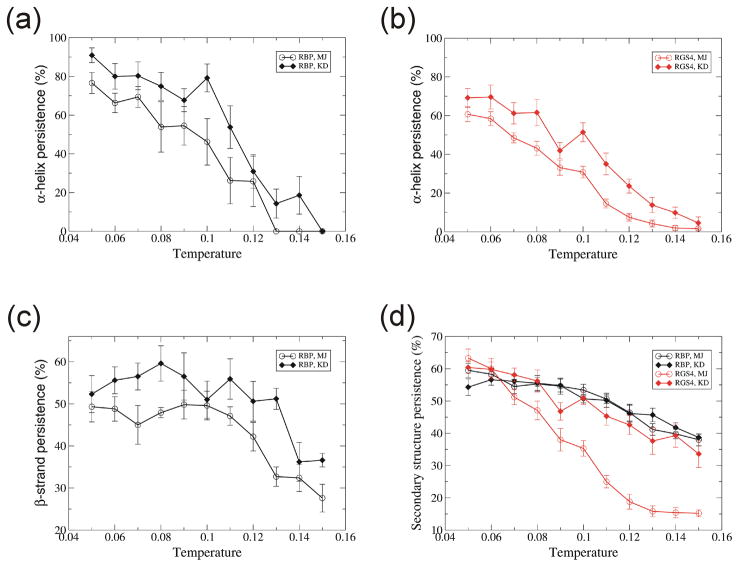
Preservation of α-helices decreased with temperature [Fig. 3(a, b)] whereas βstrands were relatively independent of temperature for temperatures ≤0.11[Fig. 3(c)]. The overall secondary structure persistence of RBP did not differ substantially between MJ and KD models (it was ~57% at T = 0.08), however, for RGS4 (α-helix protein) it was substantially better using KD than using MJ [Fig. 3(d)].
Fig. 3.
Temperature dependence of secondary structure persistence. (a) α-helix for RBP, (b) α-helix for RGS4, (c) β-strand for RGS4, and (d) all secondary structure for RBP and RGS4. Secondary structure is compared between the initial and the conformation at 10 millionth simulation step, then persistence is calculated by averaging over residues. Each value is the average over ten trajectories. Error bar denotes the standard error. Colors and symbols are the same as in Fig. 1.
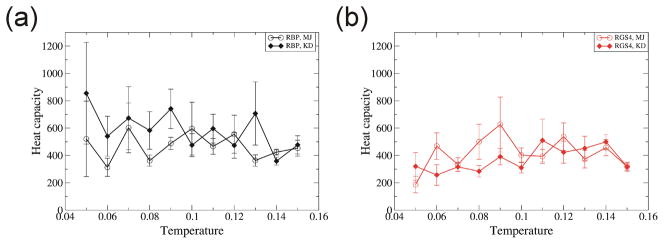
Although unfolding is not on the focus of this manuscript, the heat capacity was calculated at different temperatures. The heat capacity did not peak in the temperature range of 0.05 – 0.15 [Fig. 4]. This finding suggests there is no distinct conformational transition due to temperature in this temperature range. Most unfolding occurs at higher temperatures of 0.3 – 0.6. RMSDs of unfolded proteins are 49.2Å for RBP and 33.0Å for RGS4 at temperature 0.6 [Supplementary Fig. 1]. No substantial differences were found in heat capacities calculated from simulations using MJ and KD.
Fig. 4.
Temperature dependence of heat capacity. (a) RBP, (b) RGS4. Each value is the average over ten trajectories. Error bar denotes its standard error. Colors and symbols are the same as in Fig. 1.
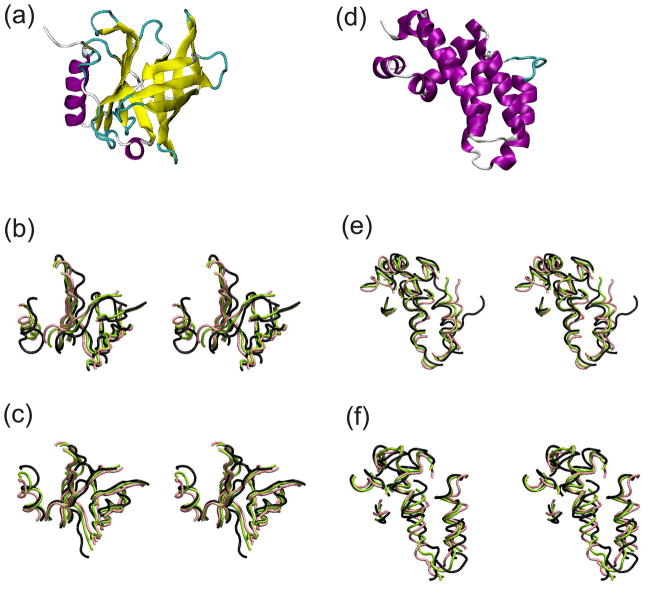
Visual comparisons of averaged core structures at the ends of the simulations to those of the starting structures indicate that changes within the core caused by DMD simulations at T=0.8 are relatively small [Fig. 5], indicating that the proteins do not unfold at T = 0.8.
Fig. 5.
Typical conformations at temperature 0.08. (a) A crystal structure of RBP, (b) core conformations of RBP at 10 millionth step with MJ and (c) with KD implicit solvent models. (d) A structure of RGS4, (e) core conformations of RGS4 at 10 millionth step with MJ and (f) with KD. α-helix is colored purple, β-strand yellow, 3–10 helix blue, turn cyan, and coil white in (a, d). (b,c,e,f) are stereo images. Black trace shows core of the known structures. Green and pink traces show the core at 10 millionth step, each averaged over five trajectories.
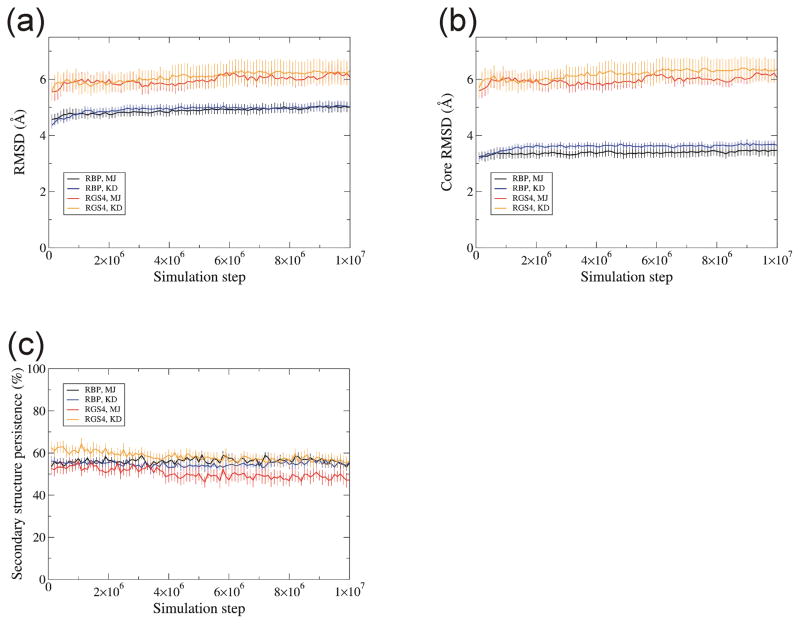
Analysis of RMSD, core RMSD and secondary structure persistence as a function of simulation step indicate that equilibrium was achieved prior to the end of the simulations [Fig. 6]. RMSDs rose quickly to 4 ~ 6 Å within 0.5 million simulation steps, increased only slightly up to six million steps, and then remained constant throughout the remainder of simulation in all ten trajectories at temperature 0.08 [Fig. 6(a)]. The same trend was apparent for core RMSDs [Fig. 6(b)].
Fig. 6.
RMSD and secondary structure persistence relative to the known structure as a function of simulation step at temperature 0.08. RMSD (a) over a whole protein, (b) over a core region, and (c) secondary structure persistence were calculated relative to corresponding known structures for two proteins, RBP and RGS4, and for two implicit solvent models, MJ and KD models. RBP with MJ is colored in black, RBP with KD in blue, RGS4 with MJ in red, and RGS4 with KD in orange. Each value is the average over ten trajectories. Error bar denotes the standard error.
All atom simulation (NAMD) vs. DMD on incorrectly folded structures
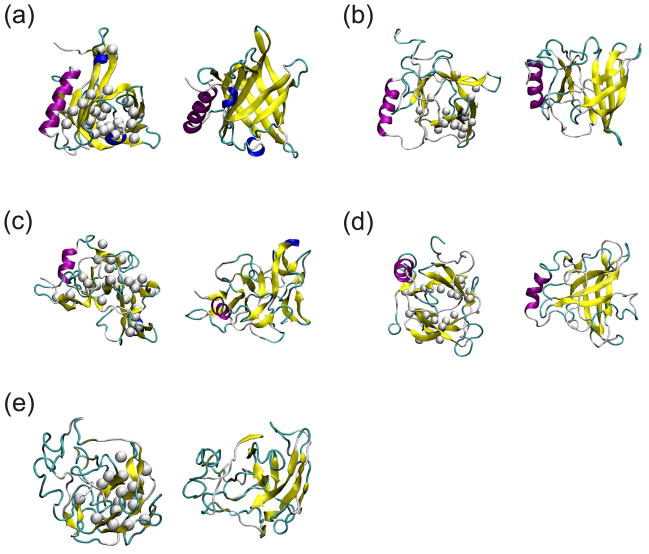
The next question we addressed was whether NAMD and DMD could distinguish between correctly folded and incorrectly folded structures. All atom simulations with explicit water molecules and DMD simulations were performed on incorrectly folded structures with the backbone structure and approximate sequence of RBP (β-barrel protein) and RGS4 (α-helix protein). Two misaligned RBP and RGS4 structures were prepared: In the 1up and 2up models the sequence was translated by one or two residues respectively toward the N-terminus. These types of alignment errors occur frequently in homology modeling. Initial backbone structures corresponded to the known structure. 1up is expected to be unstable due to orientation of hydrophobic residues in the β-barrel. In a crystal β-barrel structure, hydrophobic residues are usually oriented inwardly toward the center [Fig. 7(a)]. However, for 1up, hydrophobic residues become oriented outwardly in the β-barrel. For 2up, residues become translocated further away from a native structure but retain their orientation relative to the interior of the β-barrel. CHARMM was used to build models with side-chains31. Energy minimizations of 10,000 steps were done following side-chain building. Then, prepared 1up and 2up models were simulated with NAMD in explicit water molecules at 310 K and with DMD using the MJ implicit solvent model at temperature 0.08. Three trajectories for NAMD and ten trajectories for DMD were simulated that have slightly different initial positions and velocities of atoms. A 30 ns simulation of NAMD typically took about two weeks in Biowulf parallel computing cluster with forty processors while 10 million simulation steps of DMD took about a day with a single processor in the Biowulf cluster.
Fig. 7.
Crystal structures and typical conformations of simulated structures started from incorrectly folded initial structures of RBP. Top views are shown of the left and side views on the right. (a) A crystal structure. Structures with the sequence translated by one residue toward N-terminus (1up) (b) at 30 ns of NAMD and (c) at 10 millionth step of DMD. Structures with the sequence translated by two residues toward N-terminus (2up) (d) at 30 ns of NAMD and (e) at 10 millionth step of DMD. White balls show Cβ atoms of hydrophobic residues that were initially located inside the β-barrel in a crystal structure. Yellow arrows denote β-strands, and purple helices are for α-helices, cyan is for turns, and blue helices are for 3–10 helices.
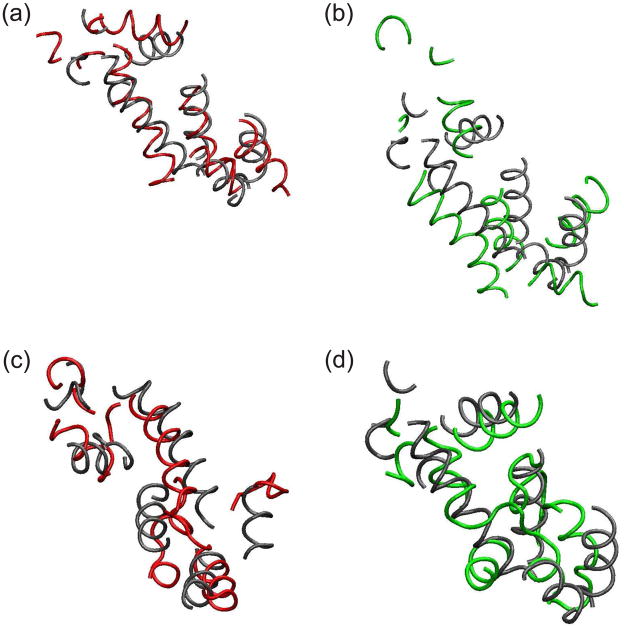
Instabilities during simulations by DMD were more apparent than those during all atom MD simulations when inspected visually [Fig. 7, 8]. Instability of β-barrel structure was most apparent with 1up [Fig. 7(c)] and instability of α-helix with 2up [Fig. 7(e), Fig. 8(e)]. The collapse of β-barrel structure in DMD simulation of 1up was probably due to the tendency of DMD to lower Miyazawa-Jernigan hydropathic energy (MJ energy) by burying hydrophobic residues, which were oriented outwardly in the starting conformation of 1up. Instabilities in α-helices of the 2up model may be due to larger alignment shifts from the native structure and a rotation of the residues by ~200° about the helical axis.
Fig. 8.
Typical conformations with a crystal structure and simulated structures started from incorrectly folded initial structures on RGS4. Core conformations at 30 ns of NAMD with (a) 1up (red) and (b) 2up (green) superimposed by its known structure (grey). Core conformations at 10 millionth step of DMD with (c) 1up (red) and (d) 2up (green) superimposed by its known structure (grey).
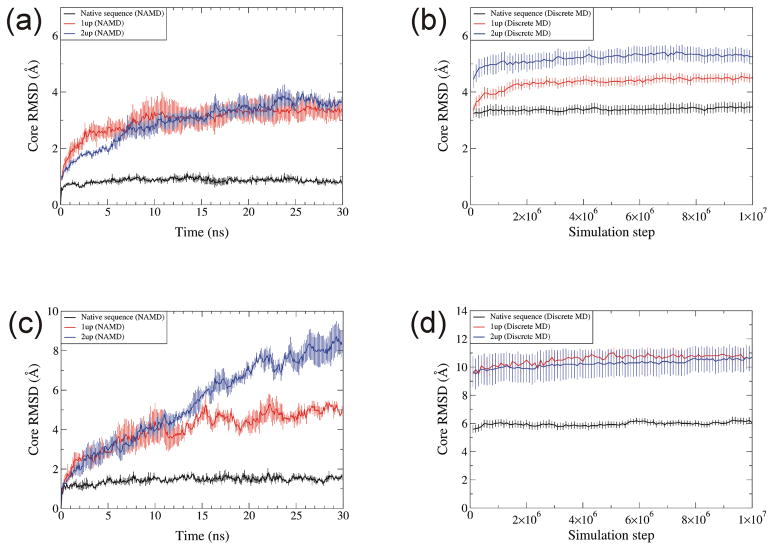
Core RMSDs of all atom NAMD simulations were substantially smaller than for DMD simulations, reaching equilibrium values in ~23ns of ~3.3 Å for 1up and 3.7 Å for 2up misfolded models as compared to an equilibrium value in ~ 6ns of ~ 0.8 Å for the native structure of RBP [Fig. 9(a)]. Core RMSDs of Cα atoms of DMD on RBP quickly rose to 4 Å for 1up and 5 Å for 2up and then reach equilibrium as ~4.5 and 5.3 Å by the 7×10⁶ step [Fig. 9(b)]. RMSD values for the native structure reach equilibrium more quickly (by step 4×10⁶) and were smaller (~3.4 Å) for the native structures [Fig. 9(b)]. Although similar tendencies were found for 1up and 2up RGS4 models, they were less stable in both types of simulations. The RMSD rose quickly to ~10Å in both misfolded models during DMD simulations, and core RMSDs of 2up rose throughout 30ns of all atom simulation to a value of ~ 8Å [Fig. 9(c)].
Fig. 9.
Core RMSD for native (black), 1up (red), and 2up (blue) structures by NAMD and DMD. (a) NAMD and (b) DMD on RBP. (c) NAMD and (d) DMD on RGS4. Temperature for NAMD was 310K, and temperature for DMD was 0.08. Each data point is the average over three trajectories for NAMD and ten trajectories for DMD. Error bars denote the standard error.
Analyses of RMSD values indicate that with both methods, the correct structure has a lower RMSD and reaches equilibrium more quickly than do the incorrectly folded structures. Although the RMSD values of the misfolded structures are greater than those of native structures in the DMD simulations, this is also true for all atom NAMD simulations, and the ratio of the RMSDs of the incorrectly folded to correctly folded structures is substantially greater for the all atom simulations (~4 for all atom and ~1.5 for DMD on RBP). These findings suggest that both types of simulations may be useful in distinguishing between correct and incorrect models of protein structures.
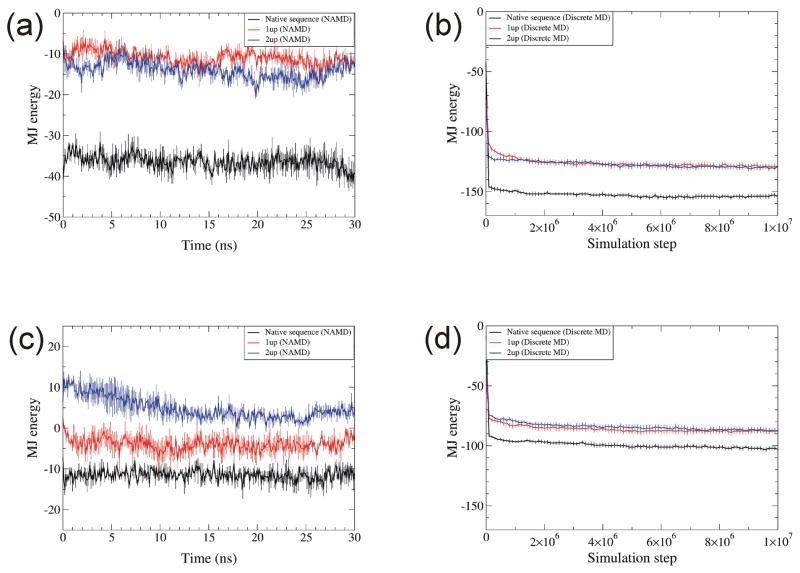
Miyazawa-Jernigan (MJ) hydropathic energies were lower during both types of simulations for native structures than for incorrectly folded structures, 1up and 2up [Fig. 10]. Surprisingly, these energies were much less during the DMD simulations than they were for either the initial correct structures or for the structures during all atom simulations. This effect is probably due to how the number of neighboring residues is calculated. The known structure of RBP has 471 neighboring residues within 6.5 Å (the cutoff value for the MJ calculations) of each other. The NAMD simulations of three 30 ns trajectories decreased the number of neighboring residues to be 437.7 with standard deviation of 10.6. However, DMD simulations of ten trajectories at 10 millionth step increased the number of neighboring residues to 646.1 with standard deviation of 20.6. Hence, the final DMD conformation has about 208 more neighboring residues. The average decrease in MJ energy per neighboring residue is ~ −0.5. Hence, 208 more neighboring residues roughly correspond to decrease of MJ energy of ~100, which is consistent with the results in Fig. 10(a,b). This conclusion is also consistent for RGS4 (338 neighboring residues for known structure, 345.3 ± 11.6 for NAMD, and 441 ± 11.2 for DMD). Attractive implicit solvent potential for hydrophobic residues in DMD caused the protein to be more compact, which increased the number of neighboring residues in DMD. It may be possible in future studies to compensate for this effect by altering some parameters within DMD; e.g., by increasing the volume of some beads, by altering cutoff distances for contacts, or imposing additional restraints. Fortunately, these effects do not appear to alter the structures catastrophically. Though the number of neighbors increased by 30 ~ 37 % with DMD, overall tertiary structures were maintained throughout the simulation on known structures.
Fig. 10.
MJ hydropathic energy for native, 1up, and 2up structures simulated with NAMD and DMD. (a) NAMD and (b) DMD simulations of RBP. (c) NAMD and (d) DMD simulations of RGS4. Definitions of colors and temperatures are the same as in Fig. 9. The unit of MJ energy is kcal/mol. Error bars denote standard error.
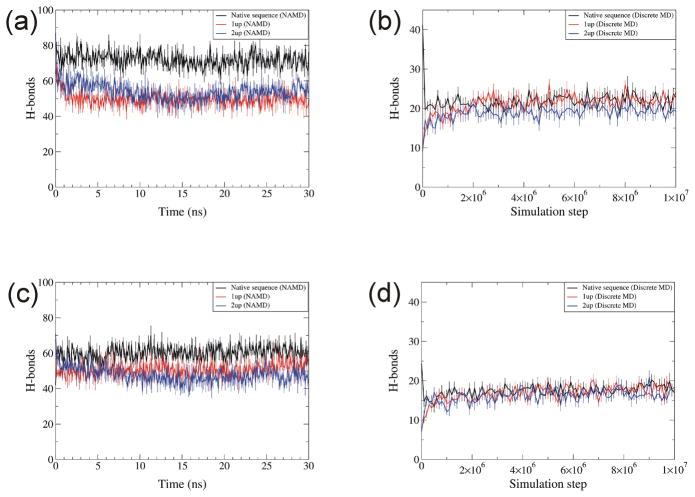
Total number of hydrogen bonds was larger for native sequence than 1up and 2up throughout simulations with NAMD [Fig. 11(a, c)]. The tendency was not apparent for DMD [Fig. 11(b,d)], suggesting that hydrogen-bonding of DMD simulated models is not useful in distinguishing between correct and incorrect models.
Fig. 11.
Number of hydrogen bonds for native, 1up, and 2up structures simulated with NAMD and DMD. (a) NAMD and (b) DMD of RBP. (c) NAMD and (d) DMD of RGS4. Definitions of colors and temperatures are the same as in Fig. 9. Each data point is the average over three trajectories for NAMD and ten trajectories for DMD. Error bars denote standard error.
All atom simulations whose starting conformations are from a final DMD conformation
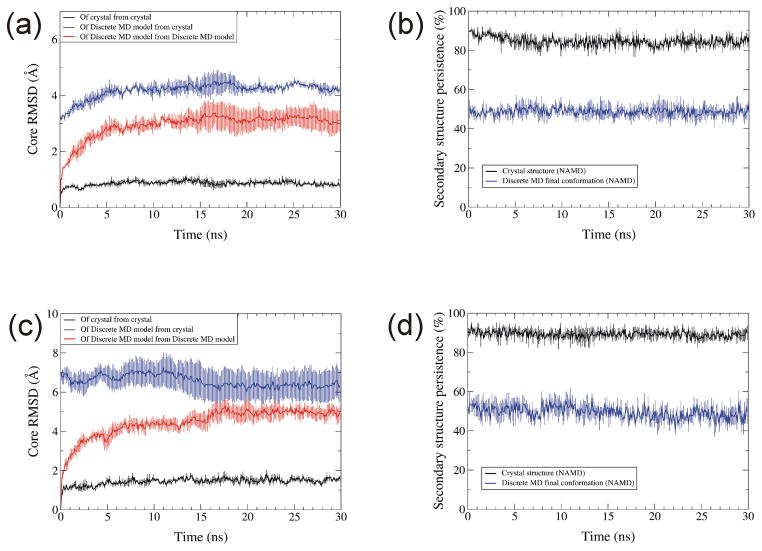
We also performed all atom simulations with explicit water molecules for 30 ns using NAMD on RBP and RGS4 starting from either the crystal structure or a final conformation of a DMD simulation with MJ at temperature 0.08. The changes from the crystal structure caused by the DMD simulations are substantially smaller than those caused by the sequence alignment changes of the misfolded models described earlier. The two questions we addressed were: 1) will conventional MD simulations improve these models, and 2) can conventional MD simulations distinguish these perturbed models from the correct structures? As expected, all atom simulations starting from a crystal structure perturbed the conformation relative to the crystal structure less than starting from a DMD final conformation (RMSD at 30 ns ~ 1 Å starting from the crystal structure vs. greater than 4 Å from the crystal structure of the DMD-derived model [Fig. 12(a,c)]. Conventional MD (NAMD) simulations of the DMD-derived model did not improve their structures; in fact, the RMSD values increased slightly for most of simulations of RBP [blue traces of Fig. 12(a,c)]. However, the RMSDs of the DMD-derived model relative to its starting structure were about three times larger than those for the crystal structures. The crystal structure also shows higher secondary structure persistence [Fig. 12(b,d)]. These results suggest that RMSDs of all atom simulations relative to starting structures may be useful in identifying better models; i.e., that better models will tend to have lower RMSD values.
Fig. 12.
Core RMSD and secondary structure persistence for NAMD simulations. (a) Core RMSD of RPB Cα atoms from the native structure beginning with the native structure (black), from the native structure beginning with a structure at the end of a DMD simulations (blue), and from DMD-simulated structure beginning with the DMD-simulated structure (red). (b) Secondary structure persistence of the whole RBP protein beginning with the native structure (black) and the DMD-simulated structure (blue). (c &d) Same as (a) and (b) except for RGS4. Temperature was 310K. Each data point is the average over three trajectories.
Stability of monomeric vs. dimeric TIM by NAMD and DMD
As a further test, we have simulated TIM, which has been crystallized as a dimer. Monomeric and dimeric TIMs were simulated independently by NAMD at temperature 310K for 30ns of three trajectories and DMD with MJ at temperature 0.08 for 10 million simulation steps of ten trajectories. Interface residues were defined as residues within 3Å of the other chain. The interface residues of TIM dimer crystal were mostly hydrophilic (13Cys, 17Lys, 43Ser, 47Ser, 66Gln, 74Gly, 77Thr, 78Gly, 79Glu, 87Asp, 99Glu, and 100Arg).
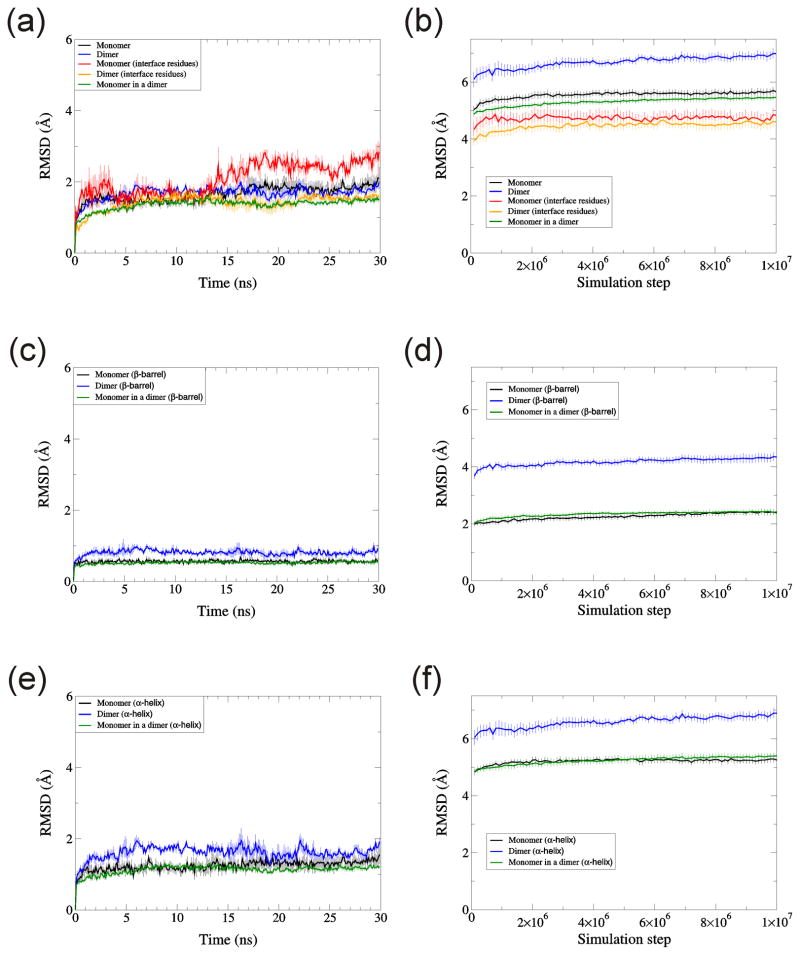
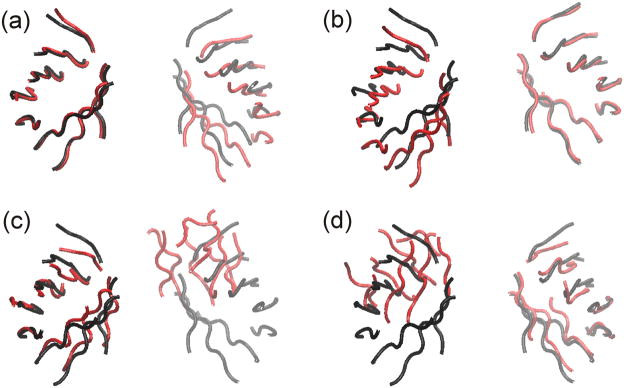
The average RMSD (~5.7Å, Fig. 13b) of the TIM monomer near the end DMD simulations was intermediate between those of RBP (~5Å) and RGS4 (~6.2Å, Fig. 6a). During NAMD simulations, the RMSD of a monomer is similar to the RMSD of a dimer when RMSD was calculated for Cα atoms of the whole protein [Fig. 13(a)]. However, for DMD simulations, the RMSD of the dimer was greater by ~ 1.3Å than the RMSD of a monomer [Fig. 13(b)]. This result (that RMSD of a dimer was larger than RMSD of a monomer) was marginal for NAMD and apparent for DMD when RMSDs were calculated for β-barrels [Fig. 13(c, d)] and for α-helices [Fig. 13(e, f)]. RMSD of the dimer was larger for DMD than for NAMD because DMD caused greater re-orientation of the monomers with respect to each other. NAMD simulations did not produce apparent shifts between monomers whether the left or right monomeric β-barrel of the simulated structure was aligned with the crystal structure [Fig. 14(a, b)]. However, in DMD, shifts in the relative positions of the monomers were apparent when only one monomer of the simulated structure was aligned to the crystal [Fig. 14(c, d)]. The fact that left or right β-barrels may be aligned nicely for DMD shows that DMD did not destroy the monomeric structure. RMSD of interface residues were lower than RMSD of whole protein for both NAMD and DMD as expected [Fig. 13(a, b)]. However, RMSD of interface residues for a monomer was lower than for a dimer in NAMD by about 1Å at 30ns [Fig. 13(a)].
Fig. 13.
RMSD for monomeric and dimeric TIM. RMSD of Cα atoms are calculated for (a, b) whole protein, (c, d) β-barrel residues, and (e, f) α-helix residues. Simulations were performed by (a, c, e) NAMD and (b, d, f) DMD. Temperature was 310K for NAMD, and 0.08 for DMD. Each data point is the average over three trajectories for NAMD and ten trajectories for DMD. Error bars denote standard error.
Fig. 14.
Representative β-barrel structures of TIM dimer simulations. Black shows a TIM crystal and red for simulated structures. (a, b) NAMD at 30 ns averaged over three trajectories and (c, d) DMD at 10 millionth step averaged over 10 trajectories. Crystal and simulated structures were geometrically aligned for (a, c) left β-barrels and (b, d) right β-barrels. Depth cueing was used.
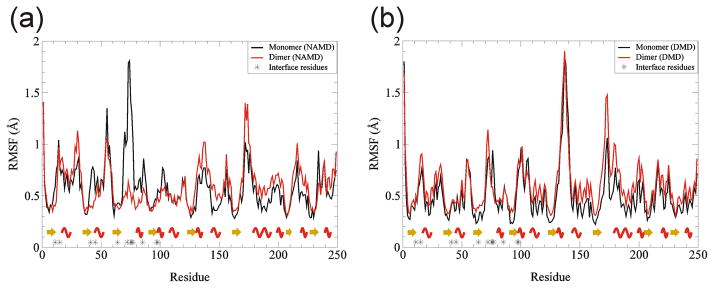
RMSF values at the ends of the simulation are similar for NAMD and DMD simulations (Fig. 15), as was the case for the other two proteins. This result lends support to our assertion that 0.08 is an appropriate temperature for DMD simulations. The βstrands are the most static (lowest RMSF), α-helices have intermediate values, and the loops are the most dynamic (highest RMSF). The finding that the β-strands are more static than α-helices is also apparent from their RMSD values (Fig. 13c–f). Interfacial residues tend to be more static in the dimer than in isolated monomers for NAMD simulations, probably due to motion-restrictive interactions between monomers and/or inhibition of hydration of the residues in the dimer. This effect was not observed in DMD simulations, possibly due to greater shifts between monomers and use of an implicit solvent.
Fig. 15.
RMSF as a function of residues for TIM monomer and dimer. (a) NAMD, (b) DMD. Black shows RMSF for monomer, red for dimer. Stars on the x-axis denote positions of interface residues. Yellow arrows are for β-strands and red waves for α-helices.
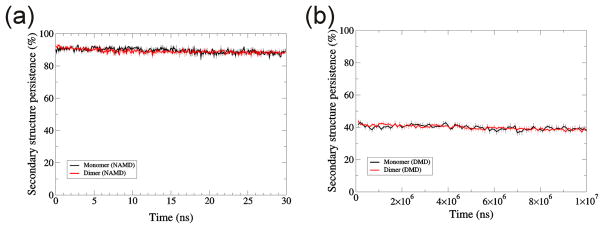
As with the other two proteins, secondary structure of TIM was preserved substantially better with NAMD (~90%, Fig. 16a) than with DMD (~40%, Fig. 16b) simulations. The decrease in secondary structure during DMD simulations is probably due to simplifications introduced in DMD, i.e., four-bead peptide model or single step potential. Multi-step potential modelling and all- atom or united atom models of a peptide may improve preservation of secondary structure in DMD. It should be possible to reduce this effect by imposing distance restraints that preserve secondary structure, but such restraints should restrict to those cases in which one is confident that the restrained secondary structures are correct. We did not attempt to apply such restraints because we are unsure of the secondary structures of the Aβ assemblies that we analyze in the accompanying manuscript.
Fig. 16.
Secondary structure persistence for TIM monomer and dimer. (a) NAMD, (b) DMD. Black shows for monomer, red for dimer. Error bars denote the standard error.
CONCLUSIONS
DMD simulations of the crystal structures of RBP, RGS4, and TIM preserved their secondary and tertiary structures of β-barrel and α-helices in the mid-temperature range moderately well, but substantially less well than for all atom simulations. We chose temperature 0.08 as physiological temperature of DMD with the current parameter set because known structures were well preserved (low RMSD, low RMSF, and high secondary structure persistence) and the magnitude of Cα molecular motions at equilibrium were similar for DMD at 0.08 and NAMD at 310 K. Comparisons of typical conformations at 10 millionth simulation step [Fig. 5] indicate that core regions were well maintained.
The specific implicit solvent model had little effect on RMSDs and core RMSDs. All the p-values were greater than 0.05 indicating no significant differences between MJ and KD (T-test p-value of RMSDs on RBP with MJ and KD was 0.997, p-value of core RMSDs on RBP was 0.455; p-value of RMSDs on RGS4 was 0.659, and p-value of core RMSDs on RGS4 was 0.520; degrees of freedom were 18). This lack of an effect is likely due to similarities of the two models for interactions involving hydrophobic (Cys, Met, Phe, Ile, Leu, Val, and Ala) and ambivalent (Gly, Thr, Ser, and Pro) residues (see Table 1 of the supplement); both models will favor structures in which hydrophobic residues are buried and hydrophilic residues are exposed, and thus most interactions will involve hydrophobic residues. Four million simulation steps were sufficient for the secondary structure persistence to reach equilibrium [Fig. 6(c)]. The secondary structure persistence was about the same for both KD and MJ implicit solvent models. RMSD values at the ends of the simulations ranged from ~ 5.0 Å for RBP to ~ 6.3 Å for RGS4. Final RMSD values β-barrel cores were substantially less (~ 3.5 Å and 2.4 Å RPB and TIM) indicating greater stability during DMD simulations for β-barrels than for α-helices.
α-helices were better preserved in the low temperature range, whereas preservation of β-strands was relatively independent of temperature for all but high temperatures (> 0.11). In all structure, the β-strands appeared more stable (lower RMSD) and static (lower RMSF) than α-helices, which in turn were more stable and static than loops. Simulations on incorrectly folded structures (1up and 2up, by DMD and NAMD perturbed models by NAMD) produced larger RMSD values than simulations on native structures, indicating that both methodologies can distinguish between native and some misfolded structures. Hence, DMD and all atom simulations may be useful in identifying which of alternative models are better. All atom simulation started from a DMD output did not result in improvements relative to the original crystal structure, suggesting that conventional MD simulations of 30ns cannot be used to correct errors introduced by DMD simulations. NAMD simulations also preserved interactions between monomers of TIM better than did DMD. However, this may simply indicate that the DMD simulations provide much more time for the monomers to shift positions.
Our overall conclusion is that DMD simulations can be useful in developing and evaluating structural models of proteins and protein assemblies. The major advantage of DMD simulations for this purpose is that they require about three orders of magnitude less computational time. In an accompanying manuscript, we utilize findings presented here in our DMD analysis of the stabilities of some alternative models of Aβ oligomers. Without results from the simulations presented here, these studies on Aβ oligomers would have been much more difficult and the results would have been much more ambiguous.
Supplementary Material
Acknowledgments
We thank Drs. Adina Milac, Yinon Shafrir, Stewart Durell, Daniel Flatow (LCB, NCI) and Sajung Yun (U. of Hawaii) for helpful discussions. We are grateful to Drs. Brigita Urbanc (Drexel U.), H. Eugene Stanley (Boston U.), and F. Ding (UNC) for DMD with Kyte-Doolittle implicit solvent model. This study utilized the Biowulf Linux cluster at the National Institutes of Health (NIH), Bethesda, MD and was supported by the Intramural Research Program of the NIH, National Cancer Institute, Center for Cancer Research.
Footnotes
Publisher's Disclaimer: This is a PDF file of an unedited manuscript that has been accepted for publication. As a service to our customers we are providing this early version of the manuscript. The manuscript will undergo copyediting, typesetting, and review of the resulting proof before it is published in its final citable form. Please note that during the production process errors may be discovered which could affect the content, and all legal disclaimers that apply to the journal pertain.
Reference List
- 1.Derreumaux P, Mousseau N. Coarse-grained protein molecular dynamics simulations. J Chem Phys. 2007;126:025101. doi: 10.1063/1.2408414. [DOI] [PubMed] [Google Scholar]
- 2.Paravastua AK, Leapman RD, Yau WM, Tycko R. Molecular structural basis for polymorphism in Alzheimer’s beta-amyloid fibrils. Proceedings of the National Academy of Sciences of the United States of America. 2008;105:18349–18354. doi: 10.1073/pnas.0806270105. [DOI] [PMC free article] [PubMed] [Google Scholar]
- 3.Urbanc B, Cruz L, Teplow DB, Stanley HE. Computer simulations of Alzheimer’s amyloid beta-protein folding and assembly. Curr Alzheimer Res. 2006;3:493–504. doi: 10.2174/156720506779025170. [DOI] [PubMed] [Google Scholar]
- 4.Liu JX, Bowman TL, Elliott JR. Discontinuous Molecular-Dynamics Simulation of Hydrogen-Bonding Systems. Industrial & Engineering Chemistry Research. 1994;33:957–964. [Google Scholar]
- 5.Zhou YQ, Hall CK, Karplus M. First-order disorder-to-order transition in an isolated homopolymer model. Physical Review Letters. 1996;77:2822–2825. doi: 10.1103/PhysRevLett.77.2822. [DOI] [PubMed] [Google Scholar]
- 6.Shafrir Y, Durell SR, Anishkin A, Guy HR. Beta-barrel models of soluble amyloid beta oligomers and annular protofibrils. Proteins. 2010;78:3458–3472. doi: 10.1002/prot.22832. [DOI] [PMC free article] [PubMed] [Google Scholar]
- 7.Ding F, Tsao D, Nie HF, Dokholyan NV. Ab initio folding of proteins with all-atom discrete molecular dynamics. Structure. 2008;16:1010–1018. doi: 10.1016/j.str.2008.03.013. [DOI] [PMC free article] [PubMed] [Google Scholar]
- 8.Emperador A, Meyer T, Orozco M. Protein flexibility from discrete molecular dynamics simulations using quasi-physical potentials. Proteins-Structure Function and Bioinformatics. 2010;78:83–94. doi: 10.1002/prot.22563. [DOI] [PubMed] [Google Scholar]
- 9.Chen Y, Dokholyan NV. A single disulfide bond differentiates aggregation pathways of beta2-microglobulin. J Mol Biol. 2005;354:473–482. doi: 10.1016/j.jmb.2005.09.075. [DOI] [PubMed] [Google Scholar]
- 10.Ding F, Dokholyan NV, Buldyrev SV, Stanley HE, Shakhnovich EI. Molecular dynamics simulation of the SH3 domain aggregation suggests a generic amyloidogenesis mechanism. J Mol Biol. 2002;324:851–857. doi: 10.1016/s0022-2836(02)01112-9. [DOI] [PubMed] [Google Scholar]
- 11.Ding F, LaRocque JJ, Dokholyan NV. Direct observation of protein folding, aggregation, and a prion-like conformational conversion. Journal of Biological Chemistry. 2005;280:40235–40240. doi: 10.1074/jbc.M506372200. [DOI] [PubMed] [Google Scholar]
- 12.Khare SD, Ding F, Gwanmesia KN, Dokholyan NV. Molecular origin of polyglutamine aggregation in neurodegenerative diseases. Plos Computational Biology. 2005;1:230–235. doi: 10.1371/journal.pcbi.0010030. [DOI] [PMC free article] [PubMed] [Google Scholar]
- 13.Marchut AJ, Hall CK. Side-chain interactions determine amyloid formation by model polyglutamine peptides in molecular dynamics simulations. Biophysical Journal. 2006;90:4574–4584. doi: 10.1529/biophysj.105.079269. [DOI] [PMC free article] [PubMed] [Google Scholar]
- 14.Nguyen HD, Hall CK. Molecular dynamics simulations of spontaneous fibril formation by random-coil peptides. Proceedings of the National Academy of Sciences of the United States of America. 2004;101:16180–16185. doi: 10.1073/pnas.0407273101. [DOI] [PMC free article] [PubMed] [Google Scholar]
- 15.Peng S, Ding F, Urbanc B, Buldyrev SV, Cruz L, Stanley HE, Dokholyan NV. Discrete molecular dynamics simulations of peptide aggregation. Phys Rev E Stat Nonlin Soft Matter Phys. 2004;69:041908. doi: 10.1103/PhysRevE.69.041908. [DOI] [PubMed] [Google Scholar]
- 16.Sharma S, Ding F, Dokholyan NV. Multiscale Modeling of nucleosome dynamics. Biophysical Journal. 2007;92:1457–1470. doi: 10.1529/biophysj.106.094805. [DOI] [PMC free article] [PubMed] [Google Scholar]
- 17.Ding F, Borreguero JM, Buldyrey SV, Stanley HE, Dokholyan NV. Mechanism for the alpha-helix to beta-hairpin transition. Proteins. 2003;53:220–228. doi: 10.1002/prot.10468. [DOI] [PubMed] [Google Scholar]
- 18.Urbanc B, Cruz L, Yun S, Buldyrev SV, Bitan G, Teplow DB, Stanley HE. In silico study of amyloid beta-protein folding and oligomerization. Proc Natl Acad Sci U S A. 2004;101:17345–17350. doi: 10.1073/pnas.0408153101. [DOI] [PMC free article] [PubMed] [Google Scholar]
- 19.Yun S, Urbanc B, Cruz L, Bitan G, Teplow DB, Stanley HE. Role of electrostatic interactions in amyloid beta-protein (A beta) oligomer formation: a discrete molecular dynamics study. Biophys J. 2007;92:4064–4077. doi: 10.1529/biophysj.106.097766. [DOI] [PMC free article] [PubMed] [Google Scholar]
- 20.Urbanc B, Betnel M, Cruz L, Bitan G, Teplow DB. Elucidation of Amyloid beta-Protein Oligomerization Mechanisms: Discrete Molecular Dynamics Study. J Am Chem Soc. 2010;132:4266–4280. doi: 10.1021/ja9096303. [DOI] [PMC free article] [PubMed] [Google Scholar]
- 21.Miyazawa S, Jernigan RL. Self-consistent estimation of inter-residue protein contact energies based on an equilibrium mixture approximation of residues. Proteins. 1999;34:49–68. doi: 10.1002/(sici)1097-0134(19990101)34:1<49::aid-prot5>3.0.co;2-l. [DOI] [PubMed] [Google Scholar]
- 22.Kyte J, Doolittle RF. A simple method for displaying the hydropathic character of a protein. J Mol Biol. 1982;157:105–132. doi: 10.1016/0022-2836(82)90515-0. [DOI] [PubMed] [Google Scholar]
- 23.Phillips JC, Braun R, Wang W, Gumbart J, Tajkhorshid E, Villa E, Chipot C, Skeel RD, Kale L, Schulten K. Scalable molecular dynamics with NAMD. Journal of Computational Chemistry. 2005;26:1781–1802. doi: 10.1002/jcc.20289. [DOI] [PMC free article] [PubMed] [Google Scholar]
- 24.Greene LH, Chrysina ED, Irons LI, Papageorgiou AC, Acharya KR, Brew K. Role of conserved residues in structure and stability: Tryptophans of human serum retinol-binding protein, a model for the lipocalin superfamily. Protein Science. 2001;10:2301–2316. doi: 10.1110/ps.22901. [DOI] [PMC free article] [PubMed] [Google Scholar]
- 25.Moy FJ, Chanda PK, Cockett MI, Edris W, Jones PG, Mason K, Semus S, Powers R. NMR structure of free RGS4 reveals an induced conformational change upon binding G alpha. Biochemistry. 2000;39:7063–7073. doi: 10.1021/bi992760w. [DOI] [PubMed] [Google Scholar]
- 26.Berendsen HJC, Postma JPM, Vangunsteren WF, Dinola A, Haak JR. Molecular-Dynamics with Coupling to An External Bath. Journal of Chemical Physics. 1984;81:3684–3690. [Google Scholar]
- 27.Urbanc B, Borreguero JM, Cruz L, Stanley HE. Ab initio discrete molecular dynamics approach to protein folding and aggregation. Methods Enzymol. 2006;412:314–338. doi: 10.1016/S0076-6879(06)12019-4. [DOI] [PubMed] [Google Scholar]
- 28.Sheu SY, Yang DY, Selzle HL, Schlag EW. Energetics of hydrogen bonds in peptides. Proc Natl Acad Sci U S A. 2003;100:12683–12687. doi: 10.1073/pnas.2133366100. [DOI] [PMC free article] [PubMed] [Google Scholar]
- 29.Dokholyan NV, Buldyrev SV, Stanley HE, Shakhnovich EI. Discrete molecular dynamics studies of the folding of a protein-like model. Folding & Design. 1998;3:577–587. doi: 10.1016/S1359-0278(98)00072-8. [DOI] [PubMed] [Google Scholar]
- 30.Dokholyan NV, Buldyrev SV, Stanley HE, Shakhnovich EI. Identifying the protein folding nucleus using molecular dynamics. Journal of Molecular Biology. 2000;296:1183–1188. doi: 10.1006/jmbi.1999.3534. [DOI] [PubMed] [Google Scholar]
- 31.Brooks BR, Bruccoleri RE, Olafson BD, States DJ, Swaminathan S, Karplus M. Charmm - A Program for Macromolecular Energy, Minimization, and Dynamics Calculations. Journal of Computational Chemistry. 1983;4:187–217. [Google Scholar]
- 32.Humphrey W, Dalke A, Schulten K. VMD: Visual molecular dynamics. Journal of Molecular Graphics. 1996;14:33–38. doi: 10.1016/0263-7855(96)00018-5. [DOI] [PubMed] [Google Scholar]
- 33.Reif F. Fundamentals of Statistical and Thermal Physics. McGraw-Hill Education; Europe: 1965. [Google Scholar]
Associated Data
This section collects any data citations, data availability statements, or supplementary materials included in this article.


