Abstract
This work explores application of a novel resolution modeling technique based on analytic physical models which individually models the various resolution degrading effects in PET (positron range, photon non-collinearity, inter-crystal scattering and inter-crystal penetration) followed by their combination and incorporation within the image reconstruction task. In addition to phantom studies, the proposed technique was particularly applied to and studied in the task of clinical Rb-82 myocardial perfusion imaging, which presently suffers from poor statistics and resolution properties in the reconstructed images. Overall, the approach is able to produce considerable enhancements in image quality. The reconstructed FWHM for a Discovery RX PET/CT scanner was seen to improve from 5.1 mm to 7.7 mm across the field-of-view (FoV) to ~3.5 mm nearly uniformly across the FoV. Furthermore, extended-source phantom studies indicated clearly improved images in terms of contrast versus noise performance. Using Monte Carlo simulations of clinical Rb-82 imaging, the resolution modeling technique was seen to significantly outperform standard reconstructions qualitatively, and also quantitatively in terms of contrast versus noise (contrast between the myocardium and other organs, as well as between myocardial defects and the left ventricle).
1. Introduction
Continuing improvements in image quality achieved in PET imaging have in the past been largely based on improvements to hardware. At the same time, applications of improved reconstruction methods have also played an important, accompanying role to this end (Rahmim and Zaidi 2008). In particular, following the introduction of statistical image reconstruction methods in PET, and the so-called system matrix, it has become possible to more accurately model the relationship between the object and projection space. The accuracy with which this system matrix is defined has a critical role in the quality of the reconstructed images.
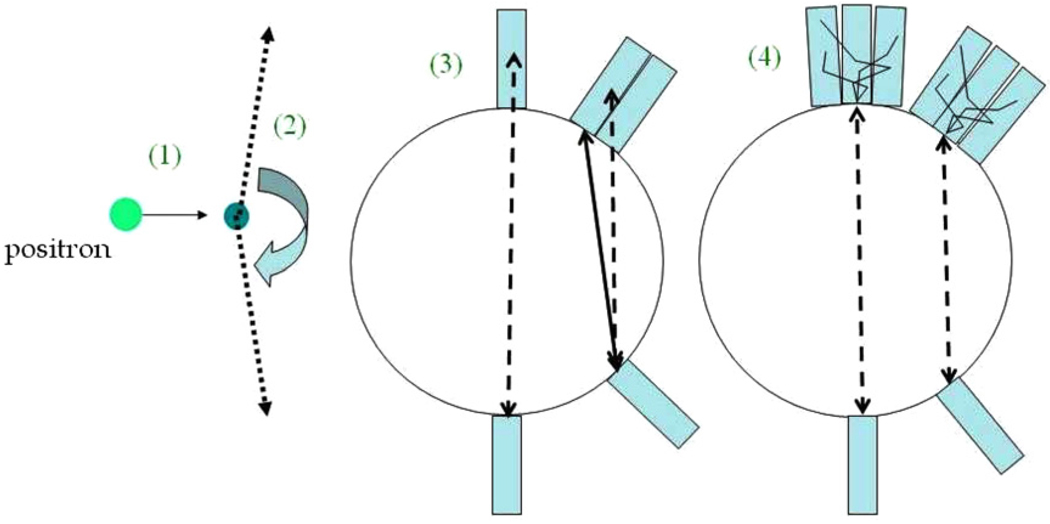
This is why, with regards to spatial resolutions presently achieved with PET scanners in the field, one must consider treating resolution degrading effects in PET not as mere limitations, but instead as challenges that could be modeled and (to some extent) addressed. In particular, besides patient movements (which also have to be addressed; e.g. see Rahmim et al (2007) for a review), a number of physical processes degrade image resolution in PET; these include positron range, photon non-collinearity, inter-crystal penetration as well as scattering, as depicted in figure 1. It is therefore potentially very beneficial to model the presence of these processes and to incorporate them within the system matrix of the statistical image reconstruction algorithm, as is commonly performed for normalization and attenuation correction (Hebert and Leahy 1990), and has also been proposed for scatter modeling (Manavaki 2002) and motion compensation (Rahmim et al 2004, 2008a, 2008b).
Figure 1.
Various resolution degrading effects in PET: (1) positron range, (2) photon non-collinearity, (3) inter-crystal penetration, and (4) inter-crystal scattering.
It is worth noting that this system matrix resolution modeling can also be thought of as performing partial volume correction (PVC) implicitly: this is because while standard PVC techniques are performed post-reconstruction, improving the resolution performance of a reconstruction algorithm itself aims to achieve the same end (Rousset et al 2007); i.e. to compensate for qualitative and/or quantitative degradations in PET images caused by the aforementioned factors. In fact, the implicit approach could potentially avoid some noise amplification issues that exist with explicit PVC techniques (Rousset et al 1998), due to their ability to perform collective compensation for image degrading effects within the image reconstruction step (Rahmim et al 2005a).
We also wish to note that while inter-crystal penetration and scattering are often not distinguished from one another, we find it potentially very useful to conceptually separate them: penetration occurs when a photon is initially detected in a crystal other than that on which it is incident, and can therefore only occur when photons are incident at non-normal angles to the crystals, while inter-crystal scattering can be present even for photons incident at normal to the crystal.
Below, we first review the existing literature on this topic. To do this, let us consider an image with J basis functions (usually voxels) and a histogrammed dataset with I projection bins. We then denote the system matrix as P = (pij)I×J, where each element pij models the probability that an event generated in voxel j is detected along a line-of-response (LOR) i. Next, one may decompose (Mumcuoğlu et al 1994, Reader et al 2002) the system matrix into three components
| (1) |
Here, the matrix B = (bij)J×J is used to account for image-based blurring effects, while the matrix G = (gij)I×J contains the geometric probability terms relating each voxel j to an LOR i. In addition, the matrix W = (wij)I×I can be used to account for sensitivity variations (i.e. due to attenuation and normalization) as well inter-crystal blurring effects3.
An approach proposed by Reader et al (2002, 2003) has been to model overall resolution blurring entirely into the image-space component B of the system matrix, obtained via the measurement of the point-spread function (PSF) as a measure of the ‘amount’ of blurring. This approach is very straightforward to implement, does not pose a significant computational increase, and produces images of higher quality. However, the method is somewhat ad hoc as it models all degrading effects in the image space, and in particular does not model the varying degrees of inter-crystal blurring in the projection space. The method is thus not suited to model the degradation of resolution as one moves away from the center of the field-of-view (FoV), known as the parallax effect. An alternative approach by Rahmim et al (2003) proposed the use of space-variant blurring kernels to model this effect with some observed improvements, nevertheless the fundamental issue remains to be the fact that this approach does not allow modeling angular-dependent crystal blurring effects.
A more accurate approach adopted by Qi et al (1998) has been to collectively model inter-crystal scattering, penetration as well as photon non-collinearity in the projection-space component W of the system matrix. Monte Carlo simulations were needed to be performed along a projection angle to extract the overall blurring kernels. The results were assumed to apply to all other 2D projection angles. Later on, Ruangma et al (2006) incorporated Monte Carlo simulated distributions for positron range within the image-space component B.
An alternative approach (Lecomte et al 1984, Schmitt et al 1988, Selivanov et al 2000) was instead to analytically calculate the angular-dependent inter-crystal penetration effects for the detectors, and to additionally calculate the resulting blurring in the coincidence aperture function; i.e. to extend individual detector blurring to that of the detector pairs in coincidence. This resolution modeling method had the advantage that, due to its analytical nature, it was not ad hoc and additionally made use of no simulations or experimental measurements. However, it neglected contributions due to inter-crystal scattering, and only incorporated inter-crystal penetration.
A new approach by Panin et al has been followed to make very accurate non-collimated (Panin et al 2006b) and collimated (Panin et al 2006a) point source measurements in the FoV to extract the overall system matrix in a very elaborate manner. The method was recently incorporated within the clinical setting (recently marketed as HD-PET by Siemens). While the method results in demonstrated improvements in image quality, it requires extensive and very accurate point source measurements (e.g. using a positioning robot as done by the authors).
A new approach is investigated in this work, and particularly applied to the case of Rb-82 PET imaging, which takes the approach of individually modeling each of the resolution degrading phenomena, followed by analytically combining them in the overall system matrix, thus not requiring extensive simulations or experimental measurements, and producing highly improved image qualities.
1.1. Motivation for application to Rb-82 cardiac imaging
Myocardial perfusion (MP) PET imaging with Rb-82 is increasingly utilized because it provides improved diagnostic quality, certainty and accuracy over conventional MP SPECT imaging (Bateman et al 2006, Machac 2005, Sampson et al 2007, Steward et al 1991). The prognostic value in predicting adverse cardiac outcomes has also been demonstrated in an increasing number of studies (Marwick et al 1997, Schenker et al 2008, Yoshinaga et al 2006). In Rb-82 PET imaging, the short half-life of the tracer (76 s), which is generated using a column generator, makes possible rapid myocardial perfusion rest/stress paired studies within a very short time (~15 min), allowing rest and stress imaging under virtually identical conditions and decreasing the total time required to scan each patient.
At the same time, because of this very short half-life, the generated MP images exhibit poor statistics, and furthermore, due to the high energy positrons emitted by Rb-82, which result in high positron ranges, the images also exhibit poor resolution properties. This especially exhibits itself clinically in observed underestimations of the left ventricular end-diastolic volume (EDV), and in turn the ejection fraction (EF), in Rb-82 cardiac PET imaging tasks (Chander et al 2008). Subsequently, the application of resolution modeling in this area appear to be very promising, especially since it has the potential to improve resolution and noise properties in the reconstructed images simultaneously (Reader et al 2003, Rahmim et al 2005a). At the same time, to our knowledge, there do not exist reports in the literature that attempt such an approach in Rb-82 PET imaging.
In fact, it is especially worth noting that while multiple complications with PET that challenge accuracy of cardiac PET images (e.g. attenuation, scattering, randoms) have been carefully studied and are nowadays readily corrected for in clinical PET imaging (Rahmim and Zaidi 2008), resolution modeling is yet to be attempted for Rb-82 cardiac imaging, which has been initiated in the present work.
2. Analytic system matrix resolution modeling
In this section, we describe how the various individual resolution degrading effects are modeled, followed by their overall incorporation within the system matrix of the statistical reconstruction algorithm. Particular attention has been paid to the case of Rb-82 cardiac PET imaging.
2.1. Positron range
Experimental projection-space measurements of positron range were first performed by Derenzo (1986) for a number of relevant radio-isotopes (F-18, Ga-68, Rb-82), and later incorporated (Haber et al 1990) within a projection-space Fourier deconvolution scheme as an attempt to compensate for positron range blurring. Nevertheless, the deconvolution scheme amplified noise in the images. An alternative approach is then to model this effect in the system-matrix of the reconstruction algorithm. It must be noted that since experimental measurements of positron range are performed in the projection space, the results are often depicted in that space. However, to model the effect of positron range in the system matrix, it is the image-space component (B (equation (1)) that needs to be utilized, since its elements model inter-voxel contributions. Therefore, we had to specify the fully 3D model of positron range in this work, as described next.
In the seminal work of Palmer and Brownell (1992), an analytic model of positron range was developed, and shown to closely agree with experimental (Derenzo 1986) as well as simulated (Palmer et al 2005) results: for a given emitted positron energy E, the annihilation density was modeled as a 3D symmetric Gaussian
| (2) |
| (3) |
where d is the density (in g cc−1) of the material the positron is traveling through, and Rex is the extrapolated positron range, which for a material with an effective atomic weight Aeff and atomic number Zeff is given by
| (4) |
| (5) |
Values of Aeff and Zeff for biological materials are relatively similar (for water: Aeff = 13.00; Zeff = 7.217). We may then compute the overall 3D distribution D̅(r)
| (6) |
where N(E) is the positron emission energy probability density.
In this work, we also adopted an analytical model for the positron emission energy density N(E): this can be summarized as follows (which has been similarly incorporated in the SimSET simulation package (Harrison et al 1999) and also used by Levin and Hoffman (1999) for Monte Carlo calculations of positron range): for an isotope with an atomic number Z and endpoint energy Emax, the probability density N(E) is given by
| (7) |
where E is the emission energy in MeV, and
| (8) |
| (9) |
| (10) |
| (11) |
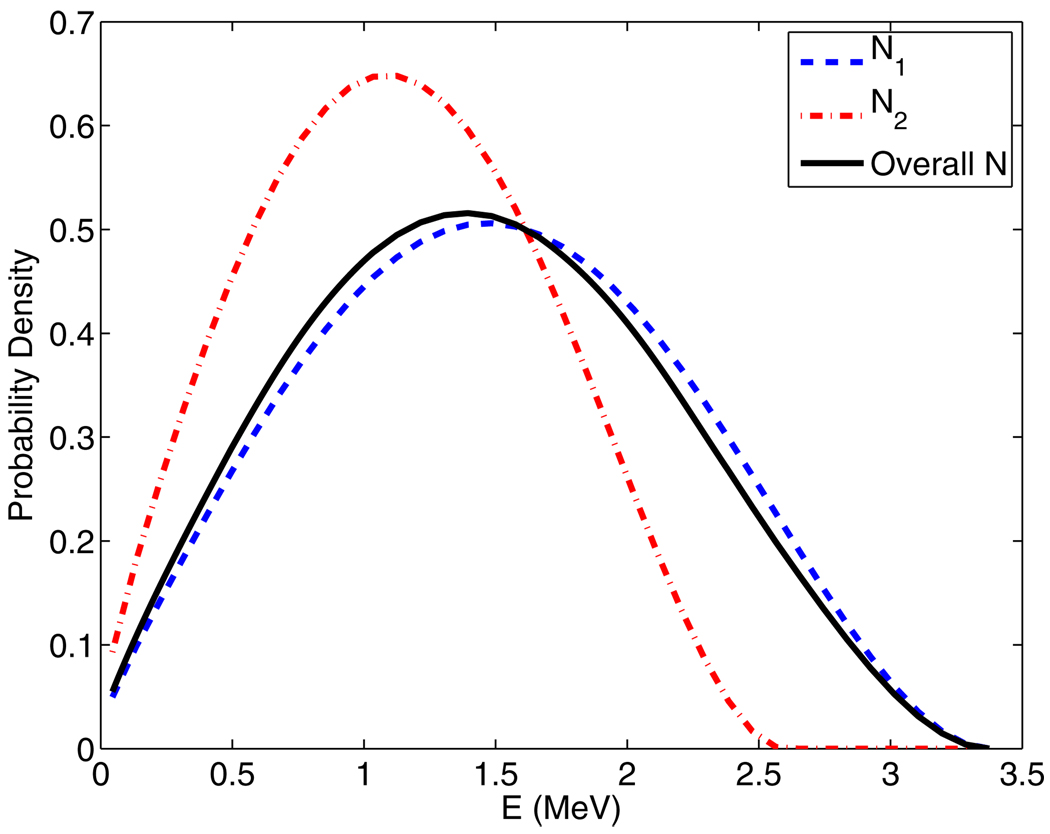
In the particular case of Rb-82, two end point energies exist: with branching ratios of 0.833 and 0.117, which then result in the distributions shown in figure 2. It is worth emphasizing that the distribution curves for each of these end-point energies (i.e. equation (7)) need to be normalized to unit area prior to summation weighted by the branching ratios N1.
Figure 2.
Plots of Rb-82 positron energy spectrum contributions N1 and N2, which have end point energies of with branching ratios of 0.833 and 0.117, respectively, as well as the overall combined energy spectrum. All curves in the figure have already been normalized to unit area. The overall spectrum is considerably more similar to N1 because of the associated large branching ratio of 0.833.
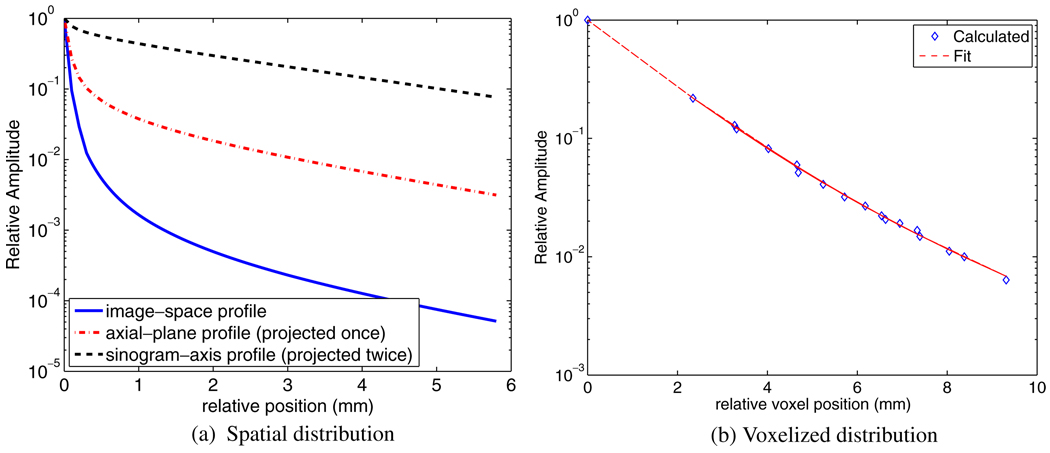
For the case of Rb-82, the calculations result in the spatial distribution depicted in figure 3(a), which also shows the resulting distributions projected once along the axial direction (axial-plane), and also a second time along the sinogram axis, for comparison purposes, since values in the literature are measured and typically depicted in the latter form, whereas in reconstruction-based compensation the image-space distribution needs to be considered.
Figure 3.
(a) Plots of profiles through spatial distributions of Rb-82 in the image-space domain, as well as in (single and double) projected space domains (the latter being what is commonly reported in the literature). (b) Corresponding plot of spatial distribution in the voxelized image domain, and the resulting fit given by equation (12).
Next, we binned the image-space spatial distribution along voxels of interest, as depicted in figure 3, and performed fitting via a bi-exponential distribution resulting in the relation
| (12) |
when voxels of size 2.34 mm[x] × 2.34 mm[y] × 3.27 mm[z] were used. Changing the size of voxels only slightly changed the fitted curves, as the underlying physics is voxel independent; for instance, for cubic voxels of size (3.27 mm)3, a fit is obtained by D̅(r) = e−0.56r, which turns out to be quite similar to the fit in equation (12).
Subsequently, the above distribution was used to define positron range kernels within the image-space component B of the system matrix (see equation (1)). It must be noted that in the present work, the aforementioned kernels were space invariant, Nevertheless, an area of ongoing work is the more appropriate modeling of the medium dependency of (Rb-82) positron range, which can be accommodated for by utilizing the non-trivial distributions obtained while varying the medium density d in equation (3). This is a conceptually feasible and practically challenging issue that is being worked out. For the present work, the density d was set to that of blood (1.06 g cc−1) which is very close to densities of water (1.00 g cc−1), heart (1.03 g cc−1) and muscle (1.04 g cc−1), but far from lung (0.26 g cc−1) and bone (2.20 g cc−1) which will be investigated and reported on in future work.
2.2. Photon non-collinearity
Due to the small residual momentum of an emitted positron when it reaches the end of its range, the annihilated photons will exhibit non-collinearity. The distribution of angular deviation from the mean of 180° is approximately Gaussian with FWHM of ≈0.5°. Technically, this effect has to be modeled in the geometric component G (in equation (1)) of the system matrix; however, as an approximation to considerably simplify the system matrix computation, one can assume photon non-collinearity is depth independent and model it in the projection-space component W of the system matrix. The effect of blurring on spatial resolution using simple geometric calculations can be shown4 to be given by a Gaussian with
| (13) |
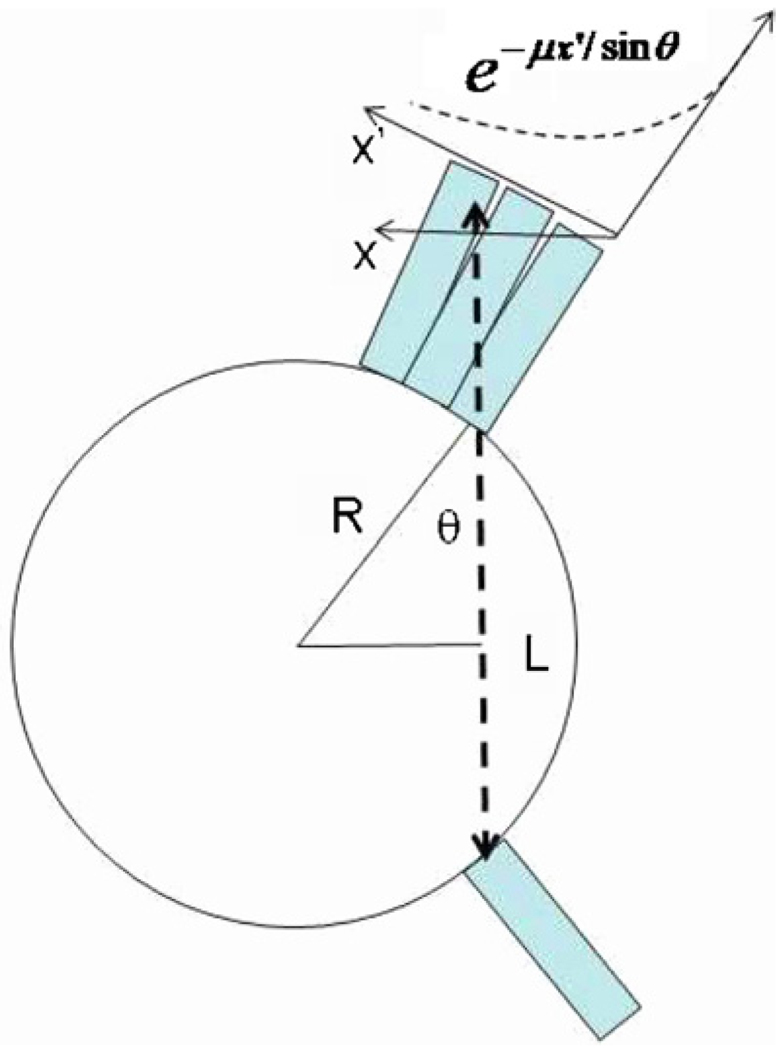
where L is the separation of the detector in coincidence. It is worth emphasizing that in this work the varying values of detector separation L for different angles of incidence θ (see figure 4) have also been modeled: i.e. for an LOR incident on the cylindrical scanner with ring radius R at angle θ, one can see that L = 2R cos(θ), and therefore we have used a Gaussian with
| (14) |
thus arriving at an angular-dependent Gaussian blurring kernel which models the non-collinearity blurring effect along the radial x and axial z directions in the sinograms. Since the non-collinearity effect is independent from crystal blurring effects, can be convolved with the corresponding crystal blurring kernels once they are extracted, as we discuss next.
Figure 4.
1D deposition distribution of photon penetration can be modeled as an angular-dependent, exponential decay curve, as depicted here.
2.3. Inter-crystal scatter and penetration
In the present work, we have considered the 2D PET acquisition modality which is a commonly used technique for both whole-body oncologic and cardiac PET imaging. Furthermore, we have assumed (as studied below) that the inter-crystal penetration and scattering effects can be separately modeled, and the corresponding blurring kernels can be convolved with one another5. First, the penetration effect can be modeled using our knowledge of the 511 keV attenuation coefficient μ of the crystals, as well as the angle of incidence θ. As such, the 1D deposition distribution pθ(x) is given by the angular-dependent, exponential distribution
| (15) |
where x′ indicates the tangential direction along the detector surface, as also shown in figure 4, while also keeping in mind the relation between the tangential direction x′ and the standard radial direction x used in the blurring operation: x = x′ cos(θ). Then, from the individual detectors’ penetration model pθ(x), the resulting penetration distribution for the coincidence pair can be calculated, as similarly done by Lecomte et al (1984) and Schmitt et al (1988), given by
| (16) |
Next, an assumption has been that it is the penetration effect (and not the scatter) that is angular dependent, and for the latter we used measured projection data of a point source at the center of the FoV (thus no penetration contribution), and determined the average radial and axial scatter blurring introduced by the scanner in the sinogram space (we corrected for the non-collinearity effect via subtraction in squares), to arrive at an estimate of Dscatter(x, z). Finally, in the present work, we arrive at the overall projection-space blurring kernel via performing
| (17) |
where * indicates a convolution.
It is worth emphasizing that, while we use the 2D PET modality in this work, the proposed method includes performance of blurring modeling along the axial (z) direction, as can be seen above; this is a valid approach in cases where the real blurring corresponds to changes in axial angles, given the relatively smaller extent of inter-crystal blurring compared to typical maximum crystal ring differences allowed (= 5 in our case, as discussed in section 3). The method then effectively adopts a single-slice rebinning approach (i.e. crystal ring differences are treated as shifts in axial positioning) which is also how 2D data are created from the measured limited-angle data. At the same time, this issue is worth further investigating particularly on a scanner-specific basis.
2.3.1. Simulations
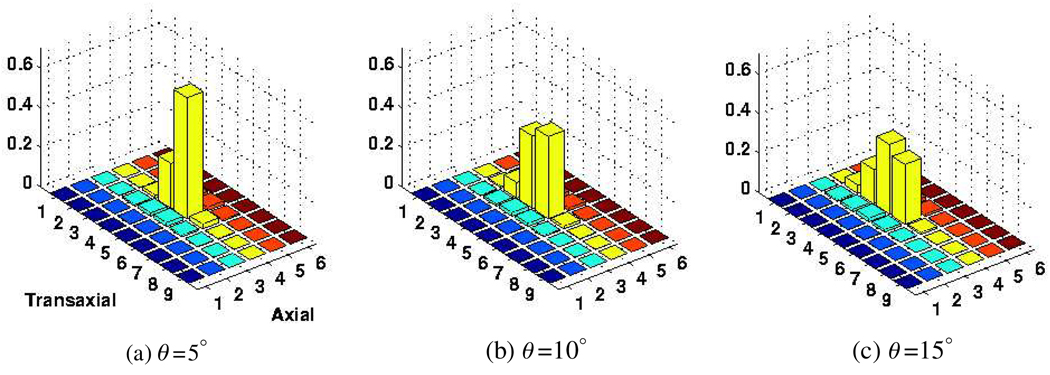
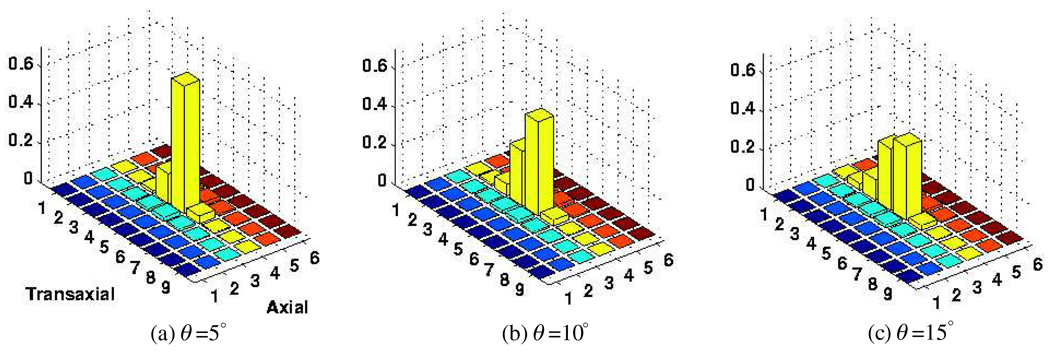
To study the separate modeling of inter-crystal scattering and penetration effects, we utilized the MCNP4C Monte Carlo code for detailed transport of 511 keV photons originated from a point source at various angles of incidence θ. A total of 50 000 photons were irradiated toward a central crystal (5,4) of a block detector consisting of a 9(tangential) × 6(axial) crystal array with dimensions 4.2 × 6.3 × 30 mm3 in the tangential, axial and radial directions6. All photons fully transported until they were captured in the block or escaped from the geometry. We then performed convolution operations between the penetration distributions at various angles (calculated using μ = 0.0755 mm−1 (LYSO) in equation (15)) and the scattering distribution (obtained at normal incidence) to arrive at overall estimate inter-crystal blurring kernels. Compared to the actual simulated blurring kernels, some mismatches can be observed as depicted in figures 5 and 6; in particular, the extent of contamination to nearby crystals appears underestimated. This is because we have observed (not shown) through these simulations that the scattered distribution is not symmetric and that it exhibits more scatter contributions in the direction of incidence.
Figure 5.
The simulated crystal absorption distribution shown here for photons incident at the crystal 5,4 (of a simulated 9 × 6 crystal block) at θ values of (a) 5°, (b) 10° and (c) 15°. The data are normalized to unity.
Figure 6.
The crystal absorption distribution calculated as described in the text, using the known LYSO density μ of 0.0755 mm−1. The data are normalized to unity.
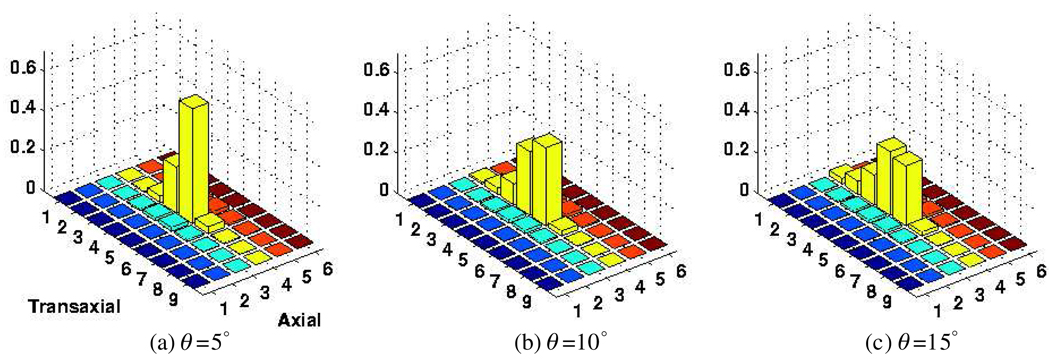
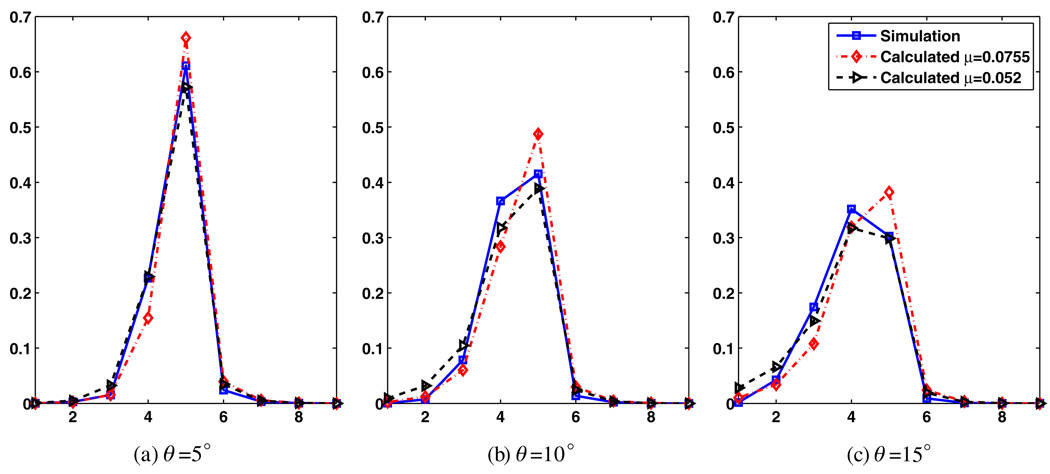
There are a number of approaches to better model this effect: one may consider the use of asymmetric, angular-dependent scattering kernels as a solution. Another solution is to use a smaller μ value for the calculation of the penetration effect (resulting in a relatively increased dependence of crystal blurring on incidence angle) in order to effectively model the additional scatter contribution in the direction of incidence. Using a smaller μ = 0.052 mm−1 as shown in figure 7, overall distributions more closely matching the simulated distribution (figure 5) were observed: profiles across the fourth axial row of the results in figures 5, 6 and 7 are shown in figure 8, indicating the mentioned closer matching when smaller μ value is used. Nevertheless, this refinement does not result in an ideal match (it actually results in larger tails due to slower exponential decay for the penetration term and does not fully capture the exact angular-dependent nature of the scatter term), and furthermore was not seen to result in further improvements in image quality. In the present work, we have continued to use the standard μ = 0.0755 mm−1 which already results in significant improvements in image qualities as discussed in the results section, while in the future, alternative approaches will be explored.
Figure 7.
The crystal absorption distribution calculated similar to figure 6 but instead using a lower μ value of 0.052 mm−1. The data are normalized to unity.
Figure 8.
Profiles across the fourth axial row of the crystal absorption distributions for simulated (figure 5), as well as calculated cases using μ values of 0.0755 mm−1 (figure 6) and 0.052 mm−1 (figure 7).
2.4. Resolution-modeled reconstruction algorithm
Denoting as the activity in voxel j (j = 1, …, J) estimated at the mth iteration, the standard expectation-maximization (EM) algorithm can be written as
| (18) |
where ni refers to the number of events detected along LOR i (i = 1, …, I), and sj = ∑i pij computes the elements of the image sensitivity.
For compact representation (Reader et al 2002), we use to denote 1D vectors of projection data, image sensitivity and image intensity (estimated at iteration m), respectively (tr denotes the transpose). The standard EM algorithm is then written as
| (19) |
where vectorial multiplication and division operations are performed on an element-by-element basis. Upon substitution of equation (1) into the EM algorithm, this becomes
| (20) |
and the sensitivity image is given by s⃗ = BtrGtrWtrΠ⃗ where Π⃗ refers to a projection-space vector of all-ones.
3. Methods and results
3.1. Tomograph
Data were acquired on and simulated for the GE Discovery RX PET/CT scanner (Kemp et al 2006) in the 2D modality (maximum crystal ring difference of 5). The scanner uses LYSO crystals of dimensions 4.2 × 6.3 × 30 mm3 in the tangential, axial and radial directions. The LYSO crystals are arranged into 9 × 6 blocks, and the scanner contains 24 rings and 630 crystals per ring.
3.2. Reconstruction
An OSEM reconstruction code was developed for the scanner, which in its non-resolution-modeling mode, highly resembled the performance of the standard clinical reconstruction software. The following effects were all estimated and corrected for:
normalization,
attenuation: measured via forward projection of the 511 keV equivalent mu-maps, which were generated from the CT images via bilinear scaling (Burger 2004),
randoms: estimated from the crystal single rates and knowledge of the scanner’s timing coincidence window (Rahmim et al 2005b),
scatter (in the object/patient): corrected for using the single scatter simulation technique (Watson 2000),
decay, and
deadtime: estimated as a global scaling factor from the average ‘block busy’ information provided by the scanner.
Normalization and attenuation were incorporated in the system matrix, while estimated randoms and scattered events were incorporated in the denominator of the ordinary Poisson OSEM algorithm (Rahmim et al 2005b), with the images finally scaled by global decay and deadtime factors. The number of subsets was set to 21 (as done in the clinic).
With the exception of the point-source studies (discussed next), cubic voxels of size (3.27 mm)3 were utilized in all the reconstructions. Furthermore, we found that for typical voxels of interest, effects of positron range for F-18 (and Na-22, used in point-source studies, which has been shown to exhibit similar positron range properties as F-18 (Alessio et al 2005)) were negligible. As such, positron range was only modeled for Rb-82 studies as discussed in section 3.5.
3.3. Point sources
A Na-22 point source was placed at six positions radially across the FoV (from the center to x = 25 cm, each separated by 5 cm), imaged for 3 min in each position, and reconstructed without and with resolution modeling. The FWHM values of the reconstructed point source images were extracted according to the NEMA protocol.
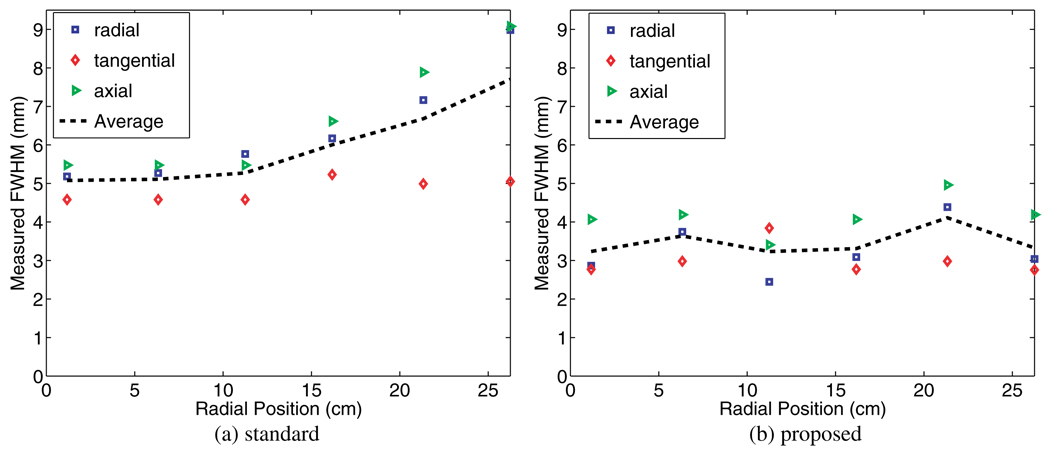
The resulting FWHM widths across the FoV are shown in figure 9 for voxels of size 2.34 mm [x/y; i.e. transaxial] and 3.27 mm [z; i.e. axial], and using five iterations and 21 subsets. Measured FWHM widths along the transaxial (i.e. radial and tangential) and axial directions are seen to have clearly improved (this is because, the proposed model performs blurring modeling along both transaxial and axial directions in the sinogram space). It is clearly seen that the proposed resolution modeling not only significantly improves the overall resolution at the center of the FoV (from 5.1 mm to 3.5 mm), but also is able to achieve near-uniformity across the FoV.
Figure 9.
Improvements in reconstructed FWHM width across the FoV is apparent upon inclusion of the proposed resolution modeling approach (five iterations and 21 subsets were used).
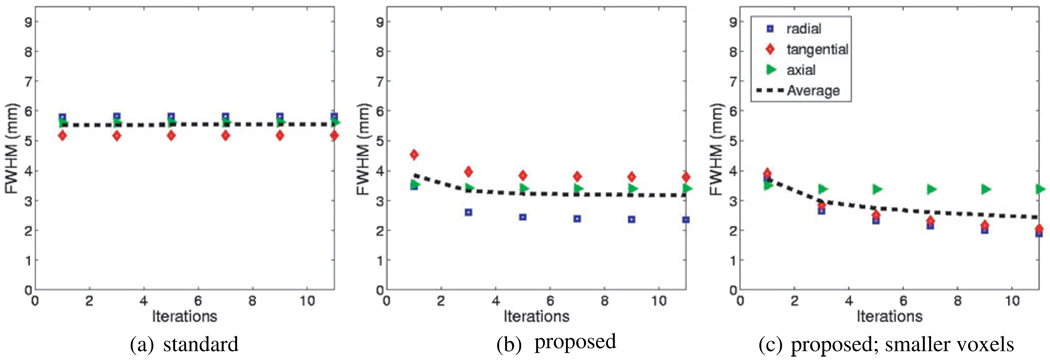
Figure 10 depicts plots of FWHM widths as a function of increasing iterations for one of the point sources (10 cm away from the center of FoV) in the three cases of reconstructing using (a) the conventional scheme, as well as the proposed resolution modeling method when voxels of size (b) 2.34 mm[x/y] by 3.27 mm[z], and also (c) 1.20 mm[x/y] by 3.27 mm[z] were used. While depicting clearly improved FWHM values, the convergence rate is seen to be clearly slower with the proposed technique, especially with increasingly small reconstruction voxel widths.
Figure 10.
Plots of FWHM widths with increasing iterations for a point source 10 cm away from the center of the FoV. In (a) and (b), voxels of size 2.34 mm[x/y] by 3.27 mm[z] were used, while in (c) smaller voxels of size 1.20 mm[x/y] by 3.27 mm[z] were used (21 subsets in each iteration)
An issue one notes with the use of point sources in air and not simultaneously measuring noise is that the iterative reconstruction algorithm can improve the measured FWHM widths with increasingly smaller voxel widths. In fact, at this point, one might suspect that the improved FWHM width measurements, when switching from the conventional scheme to the proposed scheme even with matched voxel sizes, have been at the cost of noise amplification. Using extended phantom and simulated sources, we next demonstrate that this is not the case, and that the proposed scheme improves the contrast versus noise performance.
3.4. Contrast phantom
To simultaneously study the effect of the proposed approach on both contrast (which is an indirect measure of effective resolution) and noise, an F-18 filled ACR phantom was scanned. The phantom had three cold cylinders (25 cm in diameter) filled with water, air and Teflon, as well as four hot cylinders (with diameters of 25, 16, 12 and 8 mm) with a hot-to-background ratio of 2.5.
Contrast versus noise measurements were made for images of increasing iterations reconstructed without and with resolution modeling. The contrast and the noise were estimated following approximately the NEMA NU 2001 protocol. Denoting Ch, Cc and Cb as the average measured counts in the reconstructed hot, cold and background regions of interest (ROIs), respectively, the percent hot Qh and cold Qc contrasts were calculated by
| (21) |
where Ah/Ab is the actual concentration ratio between the two regions, and
| (22) |
Thus, higher values imply improved contrasts. Additionally, noise was measured as the percent standard deviation for a large collection of voxels in the background region.
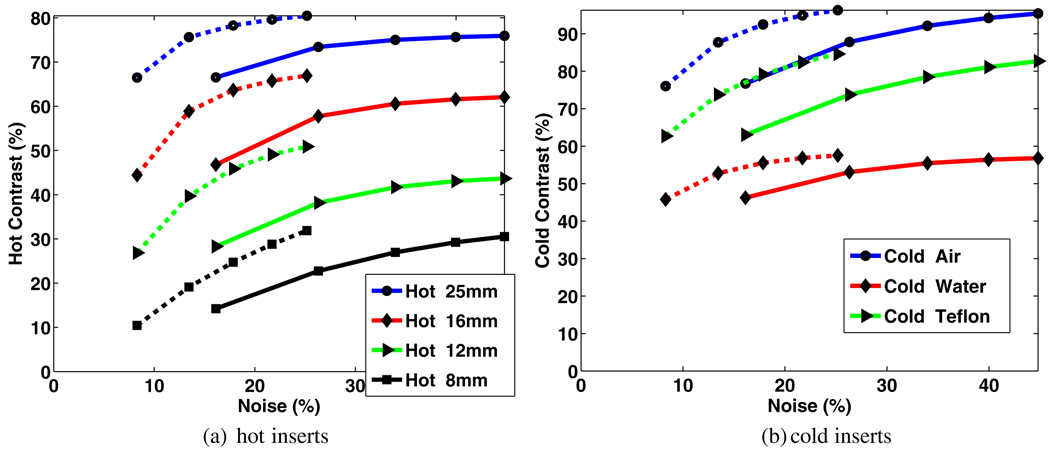
Contrast versus noise trade-off curves, generated by increasing the number of iterations in the reconstruction from 1 to 5, are shown in figure 11. They clearly demonstrate improved trade-off performance upon the inclusion of resolution modeling. One additional observation is the fact that the proposed technique converges more slowly than the conventional scheme (this is related to having a less-sparse system matrix as discussed in section 4). For instance, it can be seen that the measured noise levels (normalized standard deviation) match for the standard and proposed techniques when iterating 2 and 5 times, respectively, though at this point, the proposed technique exhibits improved contrast performance.
Figure 11.
Comparison of percent contrast versus noise trade-off curves for the four hot and three cold inserts, for standard (solid) and proposed resolution-modeled (dotted) reconstructions (the trade-off curves were generated by increasing the number of iterations from 1 to 5, thus having five points in each curve).
Figure 12 depicts reconstructed image slices in the conventional (two iterations) and proposed (five iterations) approaches, with the above quantitatively results here translating to the visual ability to detect the smallest hot sphere noticeably more conveniently with the proposed method, in comparison with the standard reconstruction.
Figure 12.
With the proposed resolution-modeled technique, the smallest sphere is considerably more readily detected. Results shown are for two iteration of standard and five iterations of the proposed OSEM method (21 subsets), as described in the text. The results are shown without and with post-smoothing.
3.5. Simulation of Rb-82 myocardial perfusion imaging
A combined SimSET/GATE Monte Carlo tool (Shilov et al 2006, Rahmim et al 2008b) was used to simulate clinical gated Rb-82 myocardial perfusion imaging on the Discovery RX PET/CT Scanner. The activities of organs including the myocardium, blood pool, lungs, liver, stomach and the spleen were measured from reconstructed images of 12 patients at stress, averaged across the patients and used as input for the NCAT phantom (Segars et al 1999).
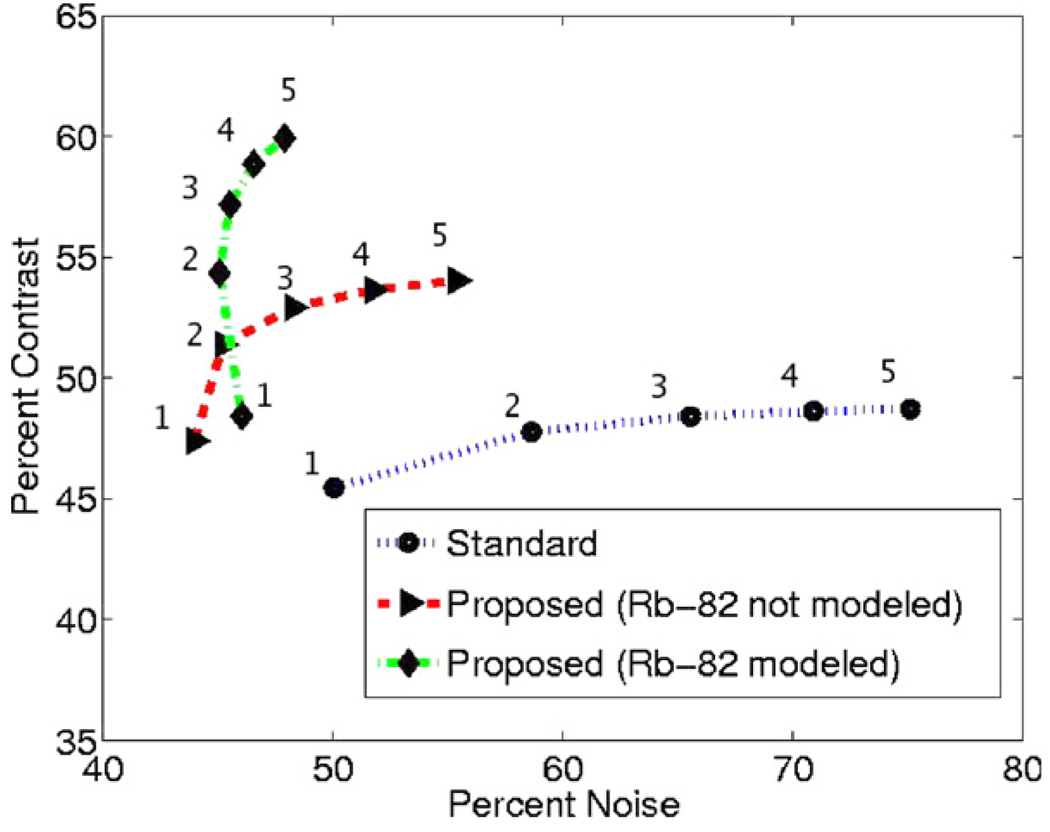
As a first example, the reconstructed percent contrast (between the myocardium and stomach) are plotted in figure 13 against the calculated noise (normalized standard deviation of voxels in the myocardium). Without modeling Rb-82 positron range (i.e. only modeling non-collinearity, inter-crystal scattering and penetration), we already see noticeable improvements in the contrast versus noise trade-off, while the curves are further improved upon the inclusion of the Rb-82 positron range model.
Figure 13.
Plots of contrast versus noise for increasing iterations (1–5 as indicated in the figure) of the various methods. The proposed methods, especially when also incorporating the Rb-82 model, show significant improvements in the trade-off curves.
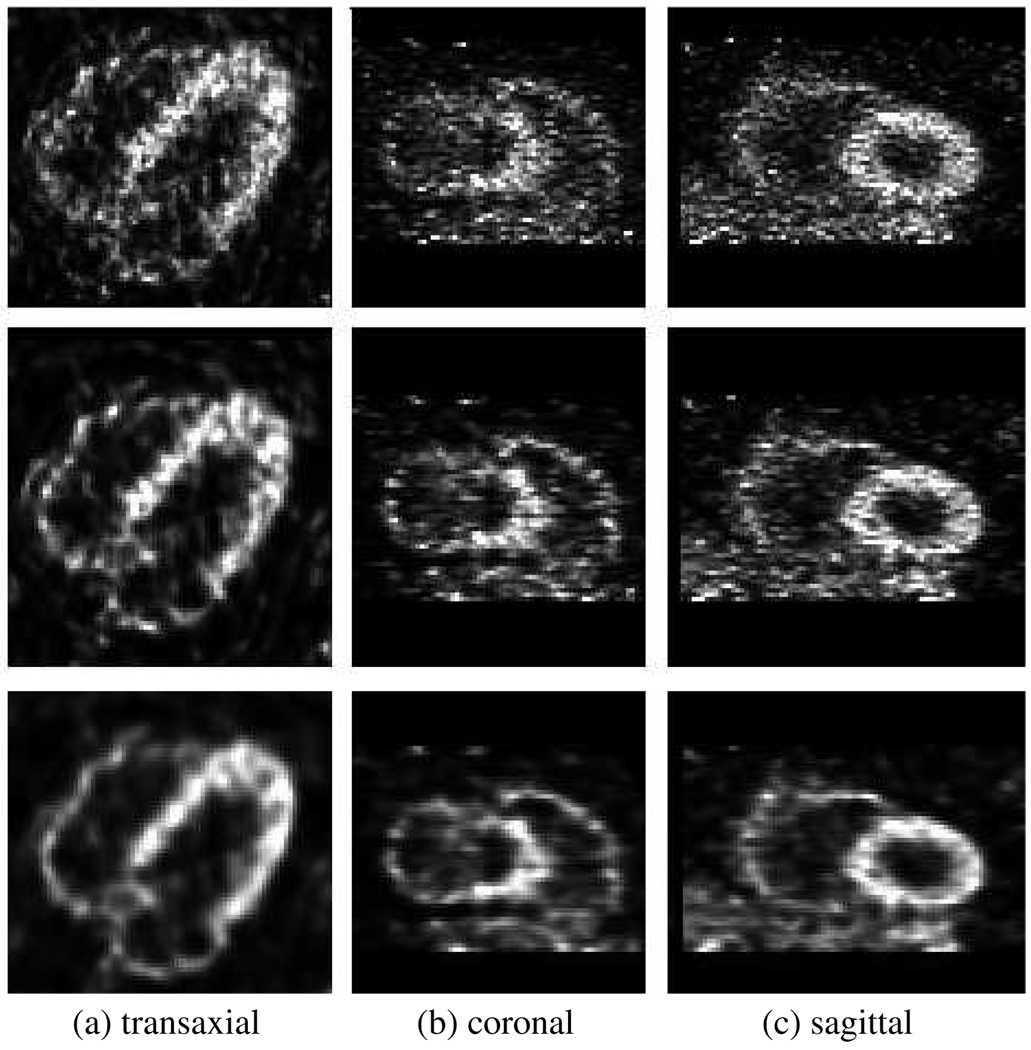
For visual inspection, some reconstructed slices are also shown in figure 14 for the conventional approach (two iterations) and the proposed method without and with positron range modeling (five iterations each). It can be seen that the resolution-modeled methods (especially that with the Rb-82 model) result in less noisy images compared to two iterations of the standard method, while additionally better contrast can be detected (as also quantitatively demonstrated in figure 13).
Figure 14.
Slices through images reconstructed using (top) the conventional approach (two iterations), (middle) the proposed method without positron range modeling (five iterations) and (bottom) the proposed method while also modeling Rb-82 positron range (five iterations). No post-smoothing has been used.
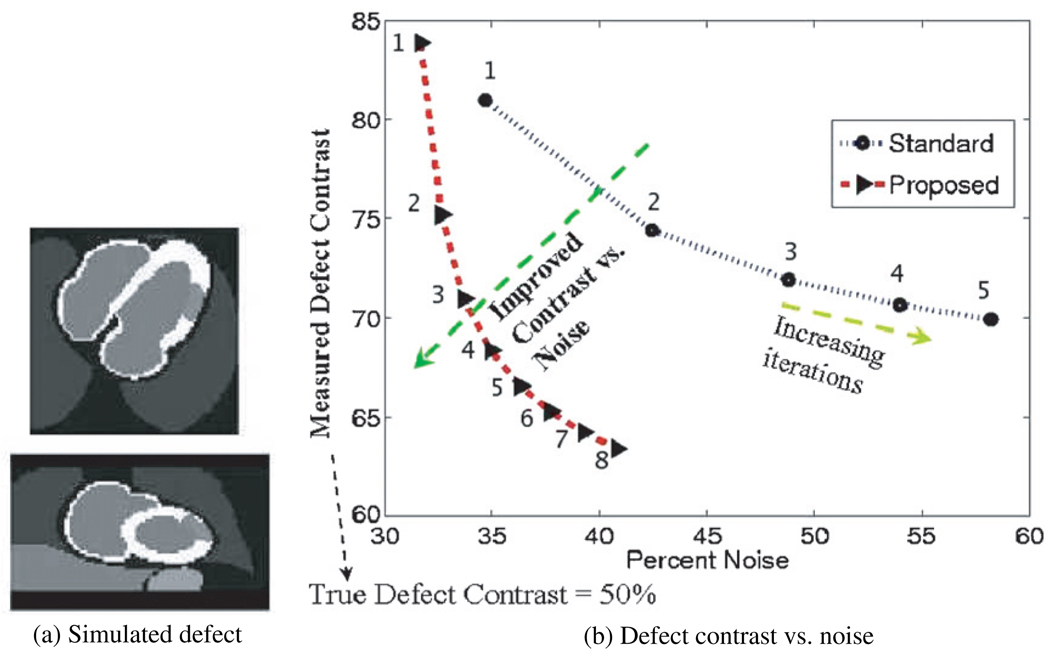
Furthermore, we also simulated studies with myocardial perfusion defects. A typical simulated defect is depicted in figure 15(a). The defects extended 60° in the short-axis view and 3 cm in the long-axis view, with 50% of the normal myocardial uptake. Measured defect contrast was defined simply as the percent ratio between measured counts in the defect to those in an ROI in the left ventricle (LV)
| (23) |
which in the ideal case should result in 50% according to this definition. Percent noise was measured as the normalized standard deviation of an ROI in the left ventricle. Figure 15(b) depicts the resulting measured contrast versus noise trade-off curves without and with resolution modeling, generated with increasing number of iterations (1–5). It is clearly seen that the proposed technique is able to better approach the true defect contrast (i.e. 50%) at a given noise level. Alternatively, at a given measured defect contrast, reduced levels of noise are observed with resolution modeling. In conclusion, the proposed analytic modeling approach was shown to result in images of considerably higher quality. Point- and extended-source phantom studies showed improved resolution, resolution uniformity, contrast and noise in the images. For the particular application of Rb-82 myocardial perfusion imaging, images of demonstrated higher quality and quantitative accuracy were obtained.
Figure 15.
(a) Sample simulated defects within the myocardium are depicted. (b) Resulting contrast versus noise when increasing iterations are applied, as indicated in the figure (21 subsets were used in each iteration). The ideal defect contrast would be 50%.
4. Discussion and conclusion
In the present work, we have explored the use of a novel technique based on analytic physical models that individually models the various resolution degrading effects in PET imaging (positron range, photon non-collinearity, inter-crystal penetration and scattering), and combines and incorporates them within the statistical image reconstruction framework. The proposed resolution modeling technique was validated using point-source and extended-source phantom studies, and shown to clearly outperform the conventional technique qualitatively and quantitatively. Furthermore, the application of the technique to Monte Carlo simulated clinical Rb-82 myocardial perfusion imaging exhibited clearly improved quantitative results in terms of contrast versus noise performance (contrast between the myocardium and other organs, as well as between myocardial defects and the left ventricle).
At the same time it was observed that convergence with the resolution modeling approach was much slower than the conventional technique, an observation common in the literature whenever less-sparse system matrices are employed. This implies that to explore the advantages of the proposed technique, more iterations are needed, and given the fact that the algorithm itself is more time consuming for each iteration (by 3.0), more computer power would be required to arrive at improved performance during a given time.
It must also be noted that in the present study, evaluation was primarily performed by varying the number of iterations. Variations within another important parameter space, namely that of post-smoothing, need to also be studied in the future: such a comparison would be very important considering the fact that clinical images typically require significant regularization, and that the improvements reported in this work may be obfuscated with clinical post-smoothing.
We also wish to note that in our Rb-82 simulations, photon tracking through the patient was performed using the SimSET software which uses an essentially similar model of positron range as discussed in section 2.1 (Harrison et al 1999). As such, the positron range model used in the present reconstructions matched that used in the simulations, both being an approximation of reality.
In the case of Rb-82 cardiac PET imaging, we plan to additionally perform extensive numerical (channelized Hotelling observer) as well as human observer studies for the tasks of myocardial perfusion defect detection. Furthermore, extensive work is presently in progress to study the application of this technique to quantitative, dynamic Rb-82 cardiac imaging tasks including estimations of K1, myocardial blood flow (MBF) and coronary flow reserve (CFR). Our aim will be to validate the hypotheses that the proposed resolution modeling technique improves the various measurement tasks in clinical static as well as dynamic Rb-82 myocardial perfusion PET imaging.
Acknowledgments
The authors wish to thank T Brown for providing clinical datasets used to create realistic simulations, S Sarkar for fruitful discussions and A Crabb for computational support. R Harrison provided highly useful feedback about the implementation of positron range in the SimSET simulation package. We would also like to thank one of the reviewers for making a number of keen observations and useful suggestions that resulted in an improved manuscript.
Footnotes
In some approaches (e.g. Selivanov et al 2000, Panin et al 2006a), a collective detector-weighted projection (WG) matrix is used, instead of the aforementioned separation of these two terms.
It is worth noting that this calculation is for an emission half-way in-between the detectors, and thus this is a worst-case estimate, and that as this point approach the detectors, the blurring effect is also relatively reduced.
We use the term penetration in the general sense of any event that crosses over to a different crystal than that it is incident on, which subsequently can be fully detected, or scattered yet to another crystal: thus penetration and scattering are modeled as parallel processes for which a convolution operation is used.
These are the dimensions of the crystal blocks used in the GE Discovery RX PET/CT scanner (Kemp et al 2006), also used in this work as discussed in section 3.
References
- Alessio AM, Kinahan PE, Harrison RL, Lewellen TK. Measured spatially variant system response for PET image reconstruction. IEEE Nucl. Sci. Symp. Conf. Record. 2005;4:5. [Google Scholar]
- Bateman TM, Heller GV, McGhie AI, et al. Diagnostic accuracy of rest/stress ECG-gated Rb-82 myocardial perfusion PET: comparison with ECG-gated Tc-99m sestamibi SPECT. J. Nucl. Cardiol. 2006;13:24–33. doi: 10.1016/j.nuclcard.2005.12.004. [DOI] [PubMed] [Google Scholar]
- Burger C, Goerres G, Schoenes S, Buck A, Lonn A, von Schulthess G. PET attenuation coefficients from CT images: experimental evaluation of the transformation of CT into PET 511-keV attenuation coefficients. Eur. J. Nucl. Med. 2004;29:922–927. doi: 10.1007/s00259-002-0796-3. [DOI] [PubMed] [Google Scholar]
- Chander A, Brenner M, Lautamäki R, Voicu C, Merrill J, Bengel FM. Comparison of measures of left ventricular function from electrocardiographically gated 82Rb PET with contrast-enhanced CT ventriculography: a hybrid PET-CT analysis. J. Nucl. Med. 2008 doi: 10.2967/jnumed.108.053819. at press. [DOI] [PubMed] [Google Scholar]
- Derenzo SE. Mathematical removal of positron range blurring in high resolution tomography. IEEE Trans. Nucl. Sci. 1986;33:546–549. [Google Scholar]
- Haber SF, Derenzo SE, Uber D. Application of mathematical removal of positron range blurring inpositron emission tomography. IEEE Trans. Nucl. Sci. 1990;37:1293–1299. [Google Scholar]
- Harrison RL, Kaplan MS, Vannoy SD, Lewellen TK. Positron range and coincidence non-collinearity in SimSET. IEEE Nucl. Sci. Symp. Conf. Record. 1999;3:1265–1268. [Google Scholar]
- Hebert TJ, Leahy R. Fast methods for including attenuation in the EM algorithm. IEEE Trans. Nucl. Sci. 1990;37:754–758. [Google Scholar]
- Kemp BJ, Kim C, Williams JJ, Ganin A, Lowe VJ. NEMA NU 2-2001 performance measurements of an LYSO-Based PET/CT system in 2D and 3D acquisition modes. J. Nucl. Med. 2006;47:1960–1967. [PubMed] [Google Scholar]
- Lecomte R, Lamoureux G, Schmitt D. Geometry study of a high resolution pet detection system using small detectors. IEEE Trans. Nucl. Sci. 1984;31:556–561. [Google Scholar]
- Levin CS, Hoffman EJ. Calculation of positron range and its effect on the fundamental limit of positron emission tomography system spatial resolution. Phys. Med. Biol. 1999;44:781–799. doi: 10.1088/0031-9155/44/3/019. [DOI] [PubMed] [Google Scholar]
- Machac J. Cardiac positron emission tomography imaging. Semin. Nucl. Med. 2005;35:17–36. doi: 10.1053/j.semnuclmed.2004.09.002. [DOI] [PubMed] [Google Scholar]
- Manavaki R, Reader AJ, Keller C, Missimer J, Walledge RJ. Scatter modeling for 3-d PET list-mode EM reconstruction. IEEE Nucl. Sci. Symp. Conf. Record. 2002;3:1863–1868. [Google Scholar]
- Marwick TH, Shan K, Patel S, et al. Incremental value of rubidium-82 positron emission tomography for prognostic assessment of known or suspected coronary artery disease. Am. J. Cardiol. 1997;80:865–870. doi: 10.1016/s0002-9149(97)00537-7. [DOI] [PubMed] [Google Scholar]
- Mumcuoğlu EÜ, Leahy RM, Cherry SR, Zhou Z. Fast gradient-based methods for baysian reconstruction of transmission and emission pet images. IEEE Trans. Med. Imaging. 1994;13:687–701. doi: 10.1109/42.363099. [DOI] [PubMed] [Google Scholar]
- Palmer MR, Brownell GL. Annihilation density distribution calculations for medically important positron emitters. IEEE Trans. Med. Imaging. 1992;11:373–378. doi: 10.1109/42.158941. [DOI] [PubMed] [Google Scholar]
- Palmer MR, Zhu X, Parker JA. Modeling and simulation of positron range effects for high resolution PET imaging. IEEE Trans. Nucl. Sci. 2005;52:1391–1395. [Google Scholar]
- Panin VY, Kehren F, Rothfuss H, Hu D, Michel C, Casey ME. PET reconstruction with system matrix derived from point source measurements. IEEE Trans. Nucl. Sci. 2006a;53:152–159. doi: 10.1109/tmi.2006.876171. [DOI] [PubMed] [Google Scholar]
- Panin VY, Kehren F, Michel C, Casey M. Fully 3-D PET reconstruction with system matrix derived from point source measurements. IEEE Trans. Med. Imaging. 2006b;25:907–921. doi: 10.1109/tmi.2006.876171. [DOI] [PubMed] [Google Scholar]
- Qi J, Leahy RM, Chinghan H, Farquhar TH, Cherry SR. Fully 3D Bayesian image reconstruction for the ECAT EXACT HR+ IEEE Trans. Nucl. Sci. 1998;45:1096–1103. [Google Scholar]
- Rahmim A, Bloomfield P, Houle S, Lenox M, Michel C, Buckley KR, Ruth TJ, Sossi V. Motion compensation in histogram-mode and list-mode EM reconstructions: beyond the event-driven approach. IEEE Trans. Nucl. Sci. 2004;51:2588–2596. [Google Scholar]
- Rahmim A, Cheng JC, Sossi V. Improved noise propagation in statistical image reconstruction with resolution modeling. IEEE Nucl. Sci. Symp. Conf. Record. 2005a;5:2576–2578. [Google Scholar]
- Rahmim A, Cheng JC, Blinder S, Camborde M-L, Sossi V. Statistical dynamic image reconstruction in state-of-the-art high resolution PET. Phys. Med. Biol. 2005b;50:4887–4912. doi: 10.1088/0031-9155/50/20/010. [DOI] [PubMed] [Google Scholar]
- Rahmim A, Cheng JC, Dinelle K, Shilov MA, Segars WP, Rousset OG, Tsui BMW, Wong DF, Sossi V. System matrix modeling of externally tracked motion. Nucl. Med. Commun. 2008a;29:574–581. doi: 10.1097/MNM.0b013e3282f5d2de. [DOI] [PMC free article] [PubMed] [Google Scholar]
- Rahmim A, et al. Accurate event-driven motion compensation in high-resolution PET incorporating scattered and random events. IEEE Trans. Med. Imaging. 2008b;27:1018–1033. doi: 10.1109/TMI.2008.917248. [DOI] [PMC free article] [PubMed] [Google Scholar]
- Rahmim A, Lenox M, Michel C, Reader AJ, Sossi V. Space-variant and anisotropic resolution modeling in list-mode EM reconstruction. IEEE Nucl. Sci. Symp. Conf. Record. 2003;5:3074–3077. [Google Scholar]
- Rahmim A, Rousset OG, Zaidi H. Strategies for motion tracking and correction in PET. PET Clin. 2007;2:251–266. doi: 10.1016/j.cpet.2007.08.002. [DOI] [PubMed] [Google Scholar]
- Rahmim A, Zaidi H. PET versus SPECT: strengths, limitations and challenges. Nucl. Med. Comm. 2008;29:193–207. doi: 10.1097/MNM.0b013e3282f3a515. [DOI] [PubMed] [Google Scholar]
- Reader AJ, Ally S, Bakatselos F, Manavaki R, Walledge R, Jeavons AP, Julyan PJ, Zhao S, Hastings DL, Zweit J. One-pass list-mode EM algorithm for high-resolution 3-D PET image reconstruction into large arrays. IEEE Trans. Nucl. Sci. 2002;49:693–699. [Google Scholar]
- Reader AJ, Julyan PJ, Williams H, Hastings DL, Zweit J. EM algorithm system modeling by image-space techniques for PET reconstruction. IEEE Trans. Nucl. Sci. 2003;50:1392–1397. [Google Scholar]
- Rousset OG, Ma Y, Evans AC. Correction for partial volume effects in PET: principle and validation. J. Nucl. Med. 1998;39:904–911. [PubMed] [Google Scholar]
- Rousset OG, Rahmim A, Alavi A, Zaidi H. Partial volume correction strategies in PET. PET Clin. 2007;2:235–249. doi: 10.1016/j.cpet.2007.10.005. [DOI] [PubMed] [Google Scholar]
- Ruangma A, Bai B, Lewis J, Sun X, Welch M, Leahy R, Laforest R. Three-dimensional maximum a posteriori (MAP) imaging with radiopharmaceuticals labeled with three Cu radionuclides. Nucl. Med. Biol. 2006;33:217–226. doi: 10.1016/j.nucmedbio.2005.11.001. [DOI] [PubMed] [Google Scholar]
- Sampson UK, Dorbala S, Limaye A, et al. Diagnostic accuracy of rubidium-82 myocardial perfusion imaging with hybrid positron emission tomography/computed tomography in the detection of coronary artery disease. J. Am. Coll. Cardiol. 2007;49:1052–1058. doi: 10.1016/j.jacc.2006.12.015. [DOI] [PubMed] [Google Scholar]
- Schenker MP, Dorbala S, Hong EC, et al. Interrelation of coronary calcification, myocardial ischemia, and outcomes in patients with intermediate likelihood of coronary artery disease: a combined positron emission tomography/computed tomography study. Circulation. 2008;117:1693–1700. doi: 10.1161/CIRCULATIONAHA.107.717512. [DOI] [PMC free article] [PubMed] [Google Scholar]
- Schmitt D, Karuta B, Carrier C, Lecomte R. Fast point spread function computation from aperture functions inhigh-resolution positron emission tomography. IEEE Trans. Med. Imaging. 1988;7:2–12. doi: 10.1109/42.3923. [DOI] [PubMed] [Google Scholar]
- Segars WP, Lalush DS, Tsui BMW. A realistic spline-based dynamic heart phantom. IEEE Trans. Nucl. Sci. 1999;46:503–506. [Google Scholar]
- Selivanov VV, Picard Y, Cadorette J, Rodrigue S, Lecomte R. Detector response models for statistical iterative image reconstruction in high resolution PET. IEEE Trans. Nucl. Sci. 2000;47:1168–1175. [Google Scholar]
- Shilov MA, Frey EC, Segars WP, Xu J, Tsui BMW. Improved Monte-Carlo simulations for dynamic PET. J. Nucl. Med. 2006;47:197P. [Google Scholar]
- Stewart RE, Schwaiger M, Molina E, et al. Comparison of rubidium-82 positron emission tomography and thallium-201 SPECT imaging for detection of coronary artery disease. Am. J. Cardiol. 1991;67:1303–1310. doi: 10.1016/0002-9149(91)90456-u. [DOI] [PubMed] [Google Scholar]
- Watson CC. New, faster, image-based scatter correction for 3D PET. IEEE Trans. Nucl. Sci. 2000;47:1587–1594. [Google Scholar]
- Yoshinaga K, Chow BJ, Williams K, et al. What is the prognostic value of myocardial perfusion imaging using rubidium-82 positron emission tomography? J. Am. Coll. Cardiol. 2006;48:1029–1039. doi: 10.1016/j.jacc.2006.06.025. [DOI] [PubMed] [Google Scholar]


