Abstract
Objective
To identify and characterize cup to disc ratio (CDR) and related optic nerve head abnormalities in multiple sclerosis (MS) using spectral domain optical coherence tomography (OCT).
Background
While CDR is routinely assessed by ophthalmologists in the evaluation of glaucoma, CDR and related optic nerve head metrics remain largely unexplored in MS.
Design/Methods
Cirrus-HD (high density) OCT was used to evaluate average CDR, vertical CDR, optic disc area, optic cup volume and neuro-retinal rim area in 105 MS patients and 88 age-matched healthy individuals. High-contrast (100%) visual acuity, 2.5% low-contrast letter acuity and 1.25% low-contrast letter acuity were assessed in 77 MS patients. Two-sample t-tests were used in the analysis of OCT-derived optic nerve head measures between healthy controls and MS patients. Multivariate regression (accounting for age and gender) was used to assess relationships between optic nerve head measures and visual function.
Results
Average CDR (p=0.007) and vertical CDR (p=0.005) was greater in MS patients compared to healthy controls, while neuro-retinal rim area was decreased in MS patients (p=0.001). CDR increased with retinal nerve fiber layer (RNFL) thinning (r=−0.29, p=0.001). 2.5% low-contrast (p=0.005) and 1.25% low-contrast letter acuity (p=0.03) were lower in MS patients with higher vertical CDR.
Conclusions/Relevance
CDR (as determined by spectral domain OCT), is abnormal in MS and correlates with visual function. OCT derived CDR and related optic nerve head metrics may represent an objective measure by which to monitor disease progression, and potentially neuroprotection, in therapeutic MS trials.
Keywords: Multiple sclerosis, Demyelinating disease, Neuro-ophthalmology, Optic nerve, Cup-to-disc ratio, Optic neuritis
Introduction
Cup to disc ratio (CDR) is conventionally assessed by ophthalmologists in the diagnosis and monitoring of glaucoma [1, 2]. Prior studies have also demonstrated increases in CDR following optic neuritis, as measured with time-domain OCT (Stratus-3) [3]. Further, optic nerve head changes, such as disc cupping, have also been observed in patients with ischemic and compressive optic neuropathies, as well as in patients with anterior visual pathway trauma [4, 5, 6, 7, 8]. These findings highlight that optic nerve head abnormalities, including increased CDR, may not exclusively result from glaucoma and may also result from non-specific optic nerve injury. Despite the extremely high predilection of the MS disease process to afflict the optic nerves (94–99% of MS patients have detectable optic nerve lesions at post-mortem), CDR and related optic nerve head measures remain largely unexamined in MS with spectral domain optical coherence tomography (OCT)[9, 10]. The majority of OCT research in MS to date has primarily focused on evaluation of retinal nerve fiber layer (RNFL) thickness.
OCT uses non-invasive, low-coherence interferometry to obtain high-resolution tomographic images of retinal structures [11]. OCT-derived measures of RNFL thickness have been shown to correlate with brain volume, low-contrast visual acuity function, optic nerve atrophy (measured by both conventional and non-conventional MRI techniques), and clinical history of optic neuritis [12, 13, 14, 15, 16, 17, 18, 19, 20]. Quantification of retinal structures by OCT may provide an objective and precise method by which to characterize and monitor disease progression in MS, in an eloquent and accessible frequently afflicted tissue target of the disease process [21, 22, 23].
In this study we used spectral domain Cirrus-HD OCT (Carl Zeiss Meditec Inc, Dublin, California) to determine if CDR and related optic nerve head measures differ between MS patients and healthy volunteers, evaluate their association with visual function, and determine their relationships with validated objective OCT-derived measures of retinal architecture including RNFL thickness.
Methods
The Johns Hopkins University (JHU), University of Pennsylvania (UPenn), and University of Texas-Southwestern (UTSW) Institutional Review Board approval was obtained for all study protocols. Written informed consent was obtained from all study participants before study procedures were initiated. Participants were excluded if they had a known history of ocular disease, glaucoma, diabetes, and/or a refractive error of greater than ±6 diopters. Participants between the ages of 18 and 65 were recruited to join the study. Patients of all MS subtypes were included. All OCT scans were performed by experienced OCT technicians on undilated pupils.
A total of 105 MS patients and 88 age-matched healthy controls (HC) were recruited to the study (JHU: 40 MS, 40 HC; UPenn: 32 MS, 21 HC; UTSW: 33 MS, 27 HC). Interrater reproducibility was determined in an independent cohort of 25 healthy volunteers and 25 MS subjects at JHU.
Retinal imaging was performed using Cirrus-HD OCT. Peri-papillary RNFL thickness measures were obtained using the Optic Disk Cube 200×200 protocol which utilizes 200 horizontal scans lines (each composed of 200 A-scans) to generate a 6 mm square grid. This scan protocol provides mean RNFL thickness (for 360° around the optic disc) and RNFL quadrant thickness measurements. Optic nerve head measures were obtained from the Optic Disk Cube 200×200 protocol using analysis software included in Cirrus-HD Version 5.0. Optic nerve head measures assessed included CDR (the average cup to disc ratio; square root of the cup to disc area ratio), disc area (total area within the disc margin, mm2), cup volume (total volume of the cup, mm3), integrated rim (area of the neuro-retinal rim, mm2), and vertical CDR. The vertical CDR is a linear ratio of the diameter (Figure 1).
Figure 1. Optic nerve images.
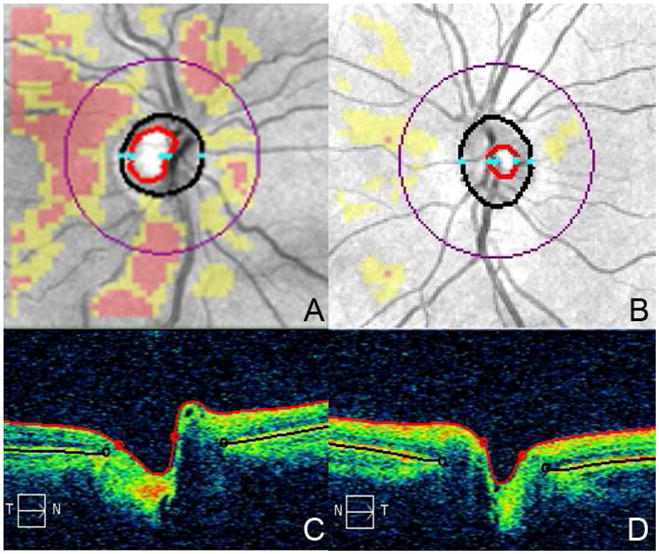
RNFL deviation Map (Image A) and horizontal tomogram (Image C) of a MS patient (C/D: 0.59, RNFL: 59 μm). RNFL deviation Map (Image B) and horizontal tomogram (Image D) of a healthy volunteer (C/D: 0.42, RNFL: 96 μm). The cup is bounded by the red outline and the disc by the black outline in image A and C.
Visual acuity measures (high and low-contrast letter acuity) were assessed in a darkened room using retro-illuminated eye charts, with subjects wearing their habitual corrective long distance spectacles/contact lenses. Both Early Treatment Diabetic Retinopathy Study (ETDRS) charts and Sloan charts (2.5% and 1.25% contrast) were used [24]. The number of letters read correctly (letter acuity) was recorded in 77 MS patients.
Statistical analysis was completed on the right eye of all study participants to avoid bias due to inter-eye correlations. As the MS patients and healthy controls were age-matched, two-sample t-tests were used to analyze optic nerve head measures between the groups. Multivariate regression, accounting for age and gender was performed using Stata 11.0 (StataCorp, College Station, TX) to assess the relationship between CDR measures, RNFL thickness, and visual acuity scores. Partial correlation coefficients (r) and their associated p-values were determined. Intraclass correlation coefficients (ICCs) were calculated to assess the interrater reproducibility of the quantitative optic nerve head measures. ICCs were computed in SPSS Version 12.0 (SPSS Inc, Chicago, IL) using a two-way random model for absolute agreement. An ICC calculates the proportion of variance attributed to between group differences and can be used to determine the correlation between two members of one group. The greater the ICC (maximum value = 1), the greater the agreement between measures.
Results
A total of 105 MS patients and 88 healthy controls were recruited across the three academic centers (Table 1). The mean ages of MS patients and healthy controls were similar and comparable across all centers. Of the 105 patients, 34% (36 MS patients; 12 from each study site) had a history of optic neuritis (ON). Most participants had relapsing-remitting MS. (Table 1).
Table 1.
Demographic characteristics of MS patients and healthy controls
| All Centers | JHU | UTSW | UPenn | |||||
|---|---|---|---|---|---|---|---|---|
| MS (n=105) | Controls (n=88) | MS (n=40) | Controls (n=40) | MS (n=33) | Controls (n=27) | MS (n=32) | Controls (n=21) | |
| Age, year, mean±SD | 37.3 ± 8.9 | 36.0 ± 10.6 | 38.5 ± 10.0 | 37.8 ± 10.0 | 34.9 ± 7.2 | 33.9 ± 9.1 | 38.2 ± 8.7 | 35.2 ± 13.0 |
| Females, n (%) | 79 (75) | 58 (67) | 26 (65) | 27 (68) | 30 (91) | 18 (67) | 23 (72) | 14 (67) |
| Type of MS, n (%) | ||||||||
| RRMS | 100 (95.2) | - | 35 (87.5) | - | 33 (100) | - | 32 (100) | - |
| PPMS | 2 (2) | - | 2 (5) | - | 0 (0) | - | 0 (0) | - |
| SPMS | 3 (3) | - | 3 (7.5) | - | 0 (0) | - | 0 (0) | - |
| History of Optic Neuritis, n (%) | 36 (34.3) | - | 12 (30) | - | 12 (36.4) | - | 12 (37.5) | - |
JHU: The Johns Hopkins University, UTSW: The University of Texas Southwestern, UPenn: University of Pennsylvania, MS: multiple sclerosis, RRMS: Relapsing-remitting MS, PPMS: primary progressive MS; SPMS: secondary progressive MS
Interrater reproducibility analysis of optic nerve head measures revealed excellent reproducibility for all measures (Healthy controls: ICCs 0.94 – 0.99, MS: 0.96–0.99). Analysis of MS patients and healthy controls was comparable, with narrow 95% confidence intervals across all measures in both cohorts (Table 2).
Table 2.
Interrater reproducibility of optic disc measures
| Retinal Measures | Healthy Controls (n=25) | MS Patients (n=25) |
|---|---|---|
| ICC (95% CI) | ICC (95% CI) | |
| Cup to Disc Ratio | 0.99 (0.99–0.99) | 0.98 (0.95–0.99) |
| Vertical CDR | 0.99 (0.97–0.99) | 0.96 (0.91–0.98) |
| Rim Area | 0.94 (0.88–0.98) | 0.96 (0.91–0.98) |
| Disc Area | 0.96 (0.91–0.98) | 0.97 (0.93–0.99) |
| Cup Volume | 0.99 (0.99–0.99) | 0.96 (0.91–0.98) |
ICC: Intraclass correlation coefficient, CI: Confidence interval
Average CDR was increased in MS patients when compared to healthy controls (MS: 0.49 ± 0.16, HC: 0.42 ± 0.18, p=0.007). The average vertical CDR (MS: 0.48 ± 0.16, HC: 0.40 ± 0.18, p=0.001) was also increased in the MS cohort while rim area (MS: 1.28 ± 0.27, HC: 1.38 ± 0.22, p=0.005) and RNFL thickness (MS: 83.3 ± 14.2, HC: 94.8 ± 10.2, p<0.001) were decreased in our MS population. No difference was seen between the MS patients and healthy controls in cup area or volume (Figure 2A). In MS participants with a history of ON, the average CDR (ON: 0.54 ± 0.16, NonON: 0.47 ± 0.16, p=0.03) and vertical CDR (ON: 0.54 ± 0.15, NonON: 0.45 ± 0.15, p=0.005) were increased while the rim area (ON: 1.17 ± 0.24, NonON: 1.33 ± 0.28, p=0.004) was decreased when compared to MS patients who did not have a past history of ON (Figure 2B). Of the optic disc measures, neuro-retinal rim area correlated most strongly with RNFL thickness after adjusting for age and gender, (r= 0.56, p<0.001).
Figure 2. Optic disc measurements.
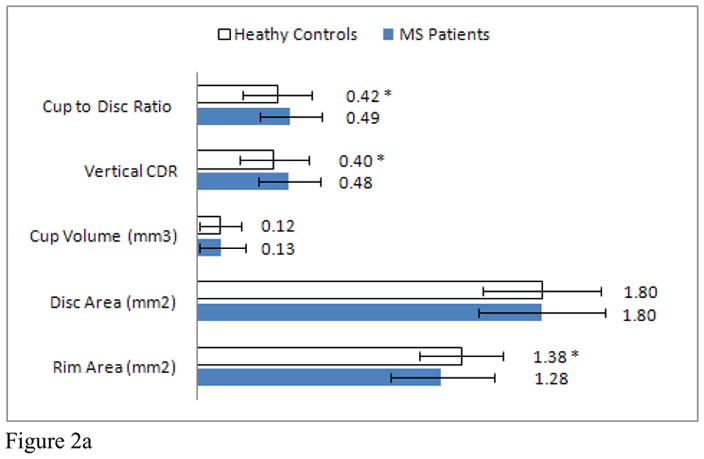
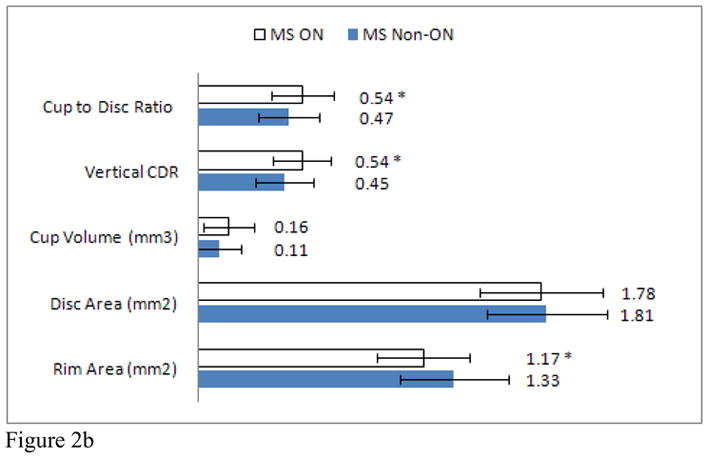
Mean optic disc measures of MS patients and healthy controls. (Graph A) * indicates a significant difference between healthy controls and MS patients. Mean optic disc measures of MS patients with and without a past history of optic neuritis. (Graph B) * indicates a significant difference between ON and non-ON eyes.
Average CDR increased in MS patients with retinal nerve layer thinning, when adjusting for age and gender (r= −0.29, p=0.001). To further investigate this finding, MS patients were stratified into groups according to RNFL thickness (RNFL ≤70 μm, 71–80 μm, 81–90 μm, 91–100 μm, > 100 μm). CDR within each group was compared to CDR for healthy controls. MS patients with an average RNFL thickness ≤70 μm (CDR: 0.59) and between 71–80μm (CDR: 0.53) demonstrated significantly greater CDR than healthy controls (Figure 3A). Subgroup analyses revealed significant differences between MS patients with an average RNFL thickness ≤70 μm at JHU (CDR: 0.58) and UPenn (CDR: 0.61) and healthy controls. In addition, MS patients at UPenn with an average RNFL thickness between 71–80μm (CDR: 0.59) and an RNFL thickness between 81–90μm (CDR: 0.52), also had greater CDRs when compared to healthy controls (Figure 3B, C, D).
Figure 3. C/D & RNFL thickness.
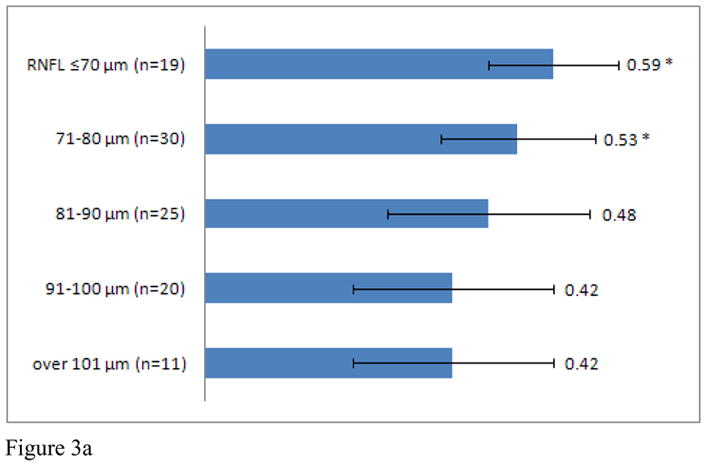
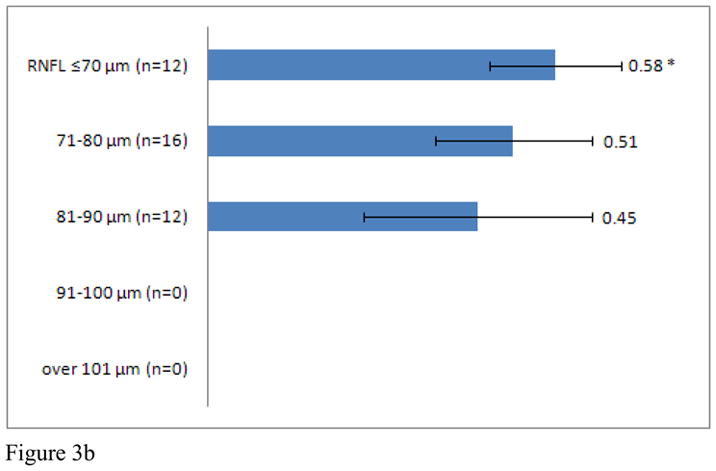
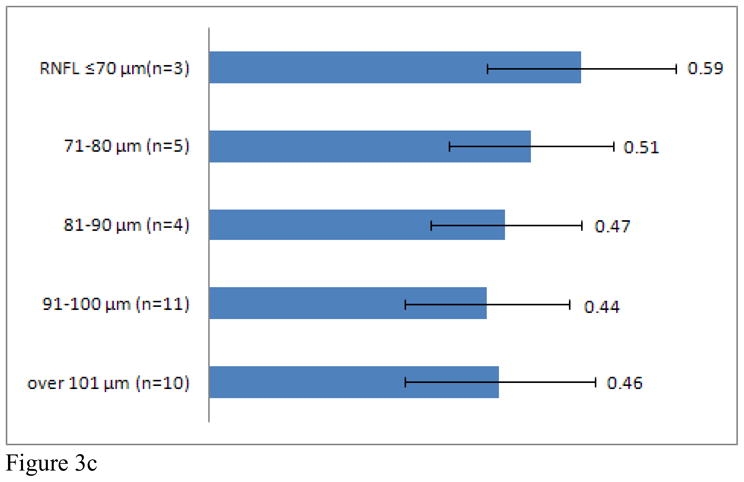

C/D of entire MS patient cohort (Graph A), JHU (Graph B), UTSW (Graph C), and UPenn (Graph D) as grouped by RNFL thickness. * indicates a significant difference between MS patients of interest and healthy controls.
Intersite comparisons revealed that mean RNFL thickness in controls was similar across all three sites (JHU: 94.9 μm, UT-S: 95.1μm, UPenn: 94.1μm). The mean RNFL thickness of MS patients was lowest at JHU (75.1μm) followed by UPenn (83.4μm) and UTSW (93.2μm). Mean RNFL thickness was significantly lower in MS patients when compared to controls at JHU and UPenn but not at UTSW. Average CDR (MS: 0.51 ± 0.15, HC: 0.42 ± 0.20, p=0.035) and vertical CDR (MS: 0.51 ± 0.15, HC: 0.41 ± 0.21, p=0.015) were increased, while neuro-retinal rim area (MS: 1.20 ± 0.22, HC: 1.38 ± 0.26, p=0.002) was decreased in the JHU MS cohort (Table 3).
Table 3.
Cross center comparison of optic disc measures
| Retinal Measures | Johns Hopkins University | University of Texas-Southwestern | University of Pennsylvania | ||||||
|---|---|---|---|---|---|---|---|---|---|
| MS (n=40) | Controls (n=40) | p-value | MS (n=33) | Controls (n=27) | p-value | MS (n=32) | Controls (n=21) | p-value | |
| Cup to Disc Ratio | 0.51 (0.15) | 0.42 (0.20) | 0.035 | 0.47 (0.13) | 0.42 (0.17) | 0.15 | 0.49 (0.19) | 0.44 (0.16) | 0.31 |
| Vertical CDR | 0.51 (0.15) | 0.41 (0.21) | 0.015 | 0.45 (0.14) | 0.39 (0.15) | 0.076 | 0.48 (0.18) | 0.41 (0.16) | 0.18 |
| Rim Area (mm2) | 1.2 (0.22) | 1.38 (0.26) | 0.002 | 1.39 (0.30) | 1.44 (0.15) | 0.42 | 1.26 (0.28) | 1.32 (0.23) | 0.39 |
| Disc Area (mm2) | 1.73 (0.29) | 1.81 (0.34) | 0.25 | 1.88 (0.41) | 1.85 (0.27) | 0.71 | 1.80 (0.26) | 1.74 (0.31) | 0.45 |
| Cup Volume (mm3) | 0.13 (0.12) | 0.12 (0.12) | 0.78 | 0.12 (0.13) | 0.10 (0.11) | 0.5 | 0.13 (0.13) | 0.12 (0.11) | 0.79 |
| RNFL (μm) | 75.1 (8.1) | 94.9 (11.7) | <0.001 | 93.2 (15.6) | 95.1 (8.8) | 0.58 | 83.4 (12.3) | 94.1 (8.9) | <0.001 |
Significance levels (p-value) ≤0.05 are shown in boldface. CDR: cup to disc ratio, RNFL: retinal nerve fiber layer
Visual function testing was completed on 77 MS patients across the three centers. Multi-linear regression, accounting for age and gender, revealed some optic nerve head measures correlated with vision function. The number of letters read at high-contrast (100%) decreased as the average and vertical CDR increased, and the neuro-retinal rim area decreased. Low-contrast (2.5%) letter acuity decreased as the average and vertical CDR increased, and the neuro-retinal rim area and RNFL thickness decreased. Low-contrast (1.25%) letter acuity decreased as the vertical CDR increased and the neuro-retinal rim area, optic disc area, and RNFL thickness decreased (Table 4).
Table 4.
Partial correlation coefficients of optic disc measures and visual acuity
| Retinal Measures | EDTRS 100% r (p-value) | Sloan 2.5% r (p-value) | Sloan 1.25% r (p-value) |
|---|---|---|---|
| Cup to Disc Ratio | −0.19 (0.10) | −0.22 (0.06) | −0.13 (0.28) |
| Vertical CDR | −0.25 (0.03) | −0.33 (0.005) | −0.25 (0.03) |
| Rim Area (mm2) | 0.16 (0.17) | 0.22 (0.05) | 0.34 (0.003) |
| Disc Area (mm2) | −0.074 (0.53) | −0.05 (0.66) | 0.23 (0.047) |
| Cup Volume (mm3) | −0.13 (0.27) | −0.11 (0.37) | −0.005 (0.96) |
| RNFL (μm) | 0.17 (0.12) | 0.24 (0.039) | 0.36 (0.002) |
Partial correlation coefficients were adjusted for age and gender. Significance levels are shown in parenthesis. Those values p≤0.05 are shown in boldface.
Discussion
Optic disc changes resulting from raised intra-ocular pressure secondary to glaucoma is a well accepted phenomenon. More recently, similar changes have been described following optic neuritis[3]. In this study, the average and vertical CDR were found to be increased in MS patients when compared to healthy volunteers. Average CDR in glaucoma patients has been previously shown to be approximately 0.75 (higher than that observed in MS patients in this study) [25]. While it is recognized that there may be a spectrum of CDR abnormalities between healthy individuals and those with glaucoma, several findings from our study implicate distinct optic nerve head changes resulting from the MS disease process, most likely resulting from its affinity to afflict the optic nerves. Average CDR and vertical CDR were higher and neuro-retinal rim area lower in MS patients with a history of ON, than those without a history of ON, corroborating previous reports of increased CDR following ON. MS patients with greatest RNFL thinning (generally accepted to result from retrograde degeneration of constituent optic nerve axons related to clinical and subclinical optic neuropathy) and perhaps more severe disease (since RNFL thinning correlates with MS disability) may be most likely to have increased CDR [14]. Specifically, those MS patients with lower RNFL thickness in this study exhibited correspondingly higher CDR. The correlations between optic nerve head abnormalities and visual function in this study underpin the clinical relevance of optic nerve head abnormalities in MS (as measured by OCT). Vertical CDR correlated significantly with high-contrast visual acuity, while RNFL thickness did not. Correlation coefficients with low-contrast (2.5%) letter acuity were likewise highest with vertical CDR. Low-contrast (1.25%) letter acuity correlated significantly with vertical CDR, optic disc area, neuro-retinal rim area and RNFL thickness, with highest correlation coefficients with RNFL thickness.
Reproducibility analyses in our study revealed that all Cirrus-HD OCT derived optic disc measures (CDR, vertical CDR, rim area, disc area, and cup volume) had excellent reproducibility in both MS patients and healthy controls. This suggests OCT derived optic nerve head measures (principally CDR) offers a reproducible, automated, and highly objective method to monitor patients clinically. Caution should be employed however when comparing values obtained by OCT to those provided by slit-lamp evaluation, as the CDR for healthy controls as measured by Cirrus-HD in this study (CDR: 0.43) may provide higher values than those previously reported (CDR: 0.30) [26, 27]. In previous reports evaluating Stratus OCT, which utilizes a previous generation of OCT technology (time-domain), Stratus OCT was also found to provide higher values than slit-lamp evaluation[3].
Currently, it is unclear what precise aetiologic mechanisms may underlie optic nerve head changes in MS. In this study, CDR was higher in MS patients with a history of ON than those without a history of ON. MS patients with a lower RNFL also exhibited a correspondingly higher CDR. This finding was significant in both the entire three-center cohort and in the individual JHU and UPenn cohorts. A similar trend was seen for those scans obtained at UTSW (RNFL≤70 μm: 3 MS patients, mean CDR: 0.59). We suggest that the small sample size studied likely explains the lack of significance for analyses derived from the UTSW site. These data suggest that increased CDR in patients with RNFL thinning is perhaps due to optic cup retraction and may be the result of loss of retinal nerve fibers. Likewise, neuro-retinal rim area was also found to be decreased in the MS cohort, and significantly correlated with RNFL thickness. As neuro-retinal rim area is a measurement of neuro-retinal rim fibers, an extension of those fibers that compose the RNFL, this finding is consistent with previous studies evaluating the known thinning of RNFL thickness in MS patients [13, 28, 29]. Ultimately, longitudinal studies will help determine the cause and relationship between CDR abnormalities and metrics of retinal structural architecture in MS.
Intersite analysis revealed significant differences in the patient populations in this study; RNFL thicknesses in MS patients were approximately 20μm lower than controls at JHU and 10μm lower than controls at UPenn. No significant difference in RNFL thicknesses between MS patients and controls was seen at UTSW. Since we postulate that increased CDR in MS may be the result of RNFL thinning, these differences in RNFL may account for the differences in intersite analysis of cup to disc measures between MS patients and controls. The significant differences in cup to disc measures at JHU between MS patients and controls may be because the patients were selected to enrich for disease activity.
Changes in optic disc morphometry, such as an increase in the CDR due to cupping, may be due to retraction or loss of axons, or an underlying secondary process of gliosis occurring in the optic nerve parenchyma[30]. If these changes are characteristic of all optic neuropathies, our study findings may suggest that genetic optic neuropathies may also cause or present with increased CDR. For example, optic atrophy may occur in such conditions as autosomal dominant optic atrophy, Wolfram syndrome, or Charcot-Marie-Tooth disease Type 2a (which preferentially affects axons) which may in turn lead to increased CDR [31, 32]. While intra-ocular pressures were not measured as part of our study protocol, the young age of our study cohorts, coupled with the known US prevalence of glaucoma over 40 years of age (1.86%), make it highly unlikely that glaucoma, as opposed to MS, accounted for detected optic nerve head abnormalities in this study[33]. Further, the MS and control cohorts in this study were age-matched, further reducing any potential confounding contribution to our findings. The findings of this study should highlight to clinicians that MS, and indeed other causes of optic neuropathy in general, may cause increased CDR (a poorly appreciated sequela of MS). In particular, our findings should prompt physicians to widen their differential diagnosis of increased CDR beyond its common cause of glaucoma to also include MS/optic neuropathies, especially in younger patients. Further, it may be of even greater importance to exhibit caution in differentiating increased CDR in MS patients from low-tension glaucoma. A more extensive ophthalmic and also neurologic workup may be necessary for establishing the cause of increased CDR.
In summary, we demonstrate that optic nerve head measures including CDR may be abnormal in MS and most likely result from its predilection to afflict the optic nerves causing RNFL thinning, which may in turn potentially cause optic cup retraction. Optic nerve head abnormalities tend to be more pronounced in ON eyes and eyes with greater RNFL thinning. Correlations between optic nerve head measures and visual function underpin the clinical relevance of optic nerve head changes in MS. In addition, reproducibility values were excellent suggesting that CDR may provide another measure by which to monitor MS patients clinically. Our findings should prompt physicians to consider MS as a cause of increased CDR and to consider alternative causes of increased CDR (including MS) in patients with increased CDR, but features atypical of glaucoma including low or normal intra-ocular pressure. On these bases we suggest that patients with increased CDR may require extensive ophthalmological and neurological examination, with the retention of a broad differential diagnosis.
Footnotes
Disclosures: Portions of this study were funded by grant TR3760-A3 from the National Multiple Sclerosis Society, The Nancy Davis Foundation, and the DAD’s Foundation. Ms. Syc, Ms. Warner, Dr. Saidha, Ms. Farrell, Ms. Conger, Dr. Bisker, and Mr. Wilson report no disclosures. Dr. Frohman has received speaking and consulting fees from Biogen Idec, TEVA Neuroscience, and Athena. He has received consulting fees from Abbott Laboratories. He has also received research grant support from Aspreva. Dr. Balcer has served as a consultant to Biogen Idec for development of visual outcome measures for MS trials. She is also on the advisory board for an MS trial sponsored by Biogen Idec. Dr. Calabresi serves as a consultant for EMD Serono, Teva Neuroscience, Abbott, Novartis, Biogen-Idec, and receives research support from NINDS, EMD Serono, Vertex, Teva Neuroscience, Biogen-Idec, Bayer, and the National Multiple Sclerosis Society.
Publisher's Disclaimer: This is a PDF file of an unedited manuscript that has been accepted for publication. As a service to our customers we are providing this early version of the manuscript. The manuscript will undergo copyediting, typesetting, and review of the resulting proof before it is published in its final citable form. Please note that during the production process errors may be discovered which could affect the content, and all legal disclaimers that apply to the journal pertain.
References
- 1.Armaly MF, Sayegh RE. The cup-disc ratio. The findings of tonometry and tonography in the normal eye. Arch Ophthalmol. 1969 Aug;82(2):191–6. doi: 10.1001/archopht.1969.00990020193008. [DOI] [PubMed] [Google Scholar]
- 2.Hitchings RA, Spaeth GL. The optic disc in glaucoma. I: Classification. Br J Ophthalmol. 1976 Nov;60(11):778–85. doi: 10.1136/bjo.60.11.778. [DOI] [PMC free article] [PubMed] [Google Scholar]
- 3.Rebolleda G, Noval S, Contreras I, Arnalich-Montiel F, Garcia-Perez JL, Munoz-Negrete FJ. Optic disc cupping after optic neuritis evaluated with optic coherence tomography. Eye (Lond) 2009 Apr;23(4):890–4. doi: 10.1038/eye.2008.117. [DOI] [PubMed] [Google Scholar]
- 4.Contreras I, Rebolleda G, Noval S, Munoz-Negrete FJ. Optic disc evaluation by optical coherence tomography in nonarteritic anterior ischemic optic neuropathy. Invest Ophthalmol Vis Sci. 2007 Sep;48(9):4087–92. doi: 10.1167/iovs.07-0171. [DOI] [PubMed] [Google Scholar]
- 5.Trobe JD, Glaser JS, Cassady J, Herschler J, Anderson DR. Nonglaucomatous excavation of the optic disc. Arch Ophthalmol. 1980 Jun;98(6):1046–50. doi: 10.1001/archopht.1980.01020031036004. [DOI] [PubMed] [Google Scholar]
- 6.Hayreh SS. Pathogenesis of cupping of the optic disc. Br J Ophthalmol. 1974 Oct;58(10):863–76. doi: 10.1136/bjo.58.10.863. [DOI] [PMC free article] [PubMed] [Google Scholar]
- 7.Rath EZ, Rehany U, Linn S, Rumelt S. Correlation between optic disc atrophy and aetiology: anterior ischaemic optic neuropathy vs optic neuritis. Eye (Lond) 2003 Nov;17(9):1019–24. doi: 10.1038/sj.eye.6700691. [DOI] [PubMed] [Google Scholar]
- 8.Klein BE, Meuer SM, Knudtson MD, Klein R. The relationship of optic disk cupping to retinal vein occlusion: the Beaver Dam Eye Study. Am J Ophthalmol. 2006 May;141(5):859–62. doi: 10.1016/j.ajo.2005.12.015. [DOI] [PubMed] [Google Scholar]
- 9.Ikuta F, Zimmerman HM. Distribution of plaques in seventy autopsy cases of multiple sclerosis in the United States. Neurology. 1976 Jun;26(6 PT 2):26–8. doi: 10.1212/wnl.26.6_part_2.26. [DOI] [PubMed] [Google Scholar]
- 10.Toussaint D, Perier O, Verstappen A, Bervoets S. Clinicopathological study of the visual pathways, eyes, and cerebral hemispheres in 32 cases of disseminated sclerosis. J Clin Neuroophthalmol. 1983 Sep;3(3):211–20. [PubMed] [Google Scholar]
- 11.Huang D, Swanson EA, Lin CP, Schuman JS, Stinson WG, Chang W, et al. Optical coherence tomography. Science. 1991 Nov 22;254(5035):1178–81. doi: 10.1126/science.1957169. [DOI] [PMC free article] [PubMed] [Google Scholar]
- 12.Gordon-Lipkin E, Chodkowski B, Reich DS, Smith SA, Pulicken M, Balcer LJ, et al. Retinal nerve fiber layer is associated with brain atrophy in multiple sclerosis. Neurology. 2007 Oct 16;69(16):1603–9. doi: 10.1212/01.wnl.0000295995.46586.ae. [DOI] [PubMed] [Google Scholar]
- 13.Pulicken M, Gordon-Lipkin E, Balcer LJ, Frohman E, Cutter G, Calabresi PA. Optical coherence tomography and disease subtype in multiple sclerosis. Neurology. 2007 Nov 27;69(22):2085–92. doi: 10.1212/01.wnl.0000294876.49861.dc. [DOI] [PubMed] [Google Scholar]
- 14.Fisher JB, Jacobs DA, Markowitz CE, Galetta SL, Volpe NJ, Nano-Schiavi ML, et al. Relation of visual function to retinal nerve fiber layer thickness in multiple sclerosis. Ophthalmology. 2006 Feb;113(2):324–32. doi: 10.1016/j.ophtha.2005.10.040. [DOI] [PubMed] [Google Scholar]
- 15.Trip SA, Schlottmann PG, Jones SJ, Altmann DR, Garway-Heath DF, Thompson AJ, et al. Retinal nerve fiber layer axonal loss and visual dysfunction in optic neuritis. Ann Neurol. 2005 Sep;58(3):383–91. doi: 10.1002/ana.20575. [DOI] [PubMed] [Google Scholar]
- 16.Costello F, Coupland S, Hodge W, Lorello GR, Koroluk J, Pan YI, et al. Quantifying axonal loss after optic neuritis with optical coherence tomography. Ann Neurol. 2006 Jun;59(6):963–9. doi: 10.1002/ana.20851. [DOI] [PubMed] [Google Scholar]
- 17.Sepulcre J, Murie-Fernandez M, Salinas-Alaman A, Garcia-Layana A, Bejarano B, Villoslada P. Diagnostic accuracy of retinal abnormalities in predicting disease activity in MS. Neurology. 2007 May 1;68(18):1488–94. doi: 10.1212/01.wnl.0000260612.51849.ed. [DOI] [PubMed] [Google Scholar]
- 18.Toledo J, Sepulcre J, Salinas-Alaman A, Garcia-Layana A, Murie-Fernandez M, Bejarano B, et al. Retinal nerve fiber layer atrophy is associated with physical and cognitive disability in multiple sclerosis. Mult Scler. 2008 Aug;14(7):906–12. doi: 10.1177/1352458508090221. [DOI] [PubMed] [Google Scholar]
- 19.Albrecht P, Frohlich R, Hartung HP, Kieseier BC, Methner A. Optical coherence tomography measures axonal loss in multiple sclerosis independently of optic neuritis. J Neurol. 2007 Nov;254(11):1595–6. doi: 10.1007/s00415-007-0538-3. [DOI] [PubMed] [Google Scholar]
- 20.Trip SA, Wheeler-Kingshott C, Jones SJ, Li WY, Barker GJ, Thompson AJ, et al. Optic nerve diffusion tensor imaging in optic neuritis. Neuroimage. 2006 Apr 1;30(2):498–505. doi: 10.1016/j.neuroimage.2005.09.024. [DOI] [PubMed] [Google Scholar]
- 21.Barkhof F, Calabresi PA, Miller DH, Reingold SC. Imaging outcomes for neuroprotection and repair in multiple sclerosis trials. Nat Rev Neurol. 2009 May;5(5):256–66. doi: 10.1038/nrneurol.2009.41. [DOI] [PubMed] [Google Scholar]
- 22.Frohman EM, Fujimoto JG, Frohman TC, Calabresi PA, Cutter G, Balcer LJ. Optical coherence tomography: a window into the mechanisms of multiple sclerosis. Nat Clin Pract Neurol. 2008 Dec;4(12):664–75. doi: 10.1038/ncpneuro0950. [DOI] [PMC free article] [PubMed] [Google Scholar]
- 23.Syc SB, Warner CV, Hiremath GS, Farrell SK, Ratchford JN, Conger A, et al. Reproducibility of high-resolution optical coherence tomography in multiple sclerosis. Mult Scler. Jul;16(7):829–39. doi: 10.1177/1352458510371640. [DOI] [PubMed] [Google Scholar]
- 24.Photocoagulation for diabetic macular edema. Early Treatment Diabetic Retinopathy Study report number 1. Early Treatment Diabetic Retinopathy Study research group. Arch Ophthalmol. 1985 Dec;103(12):1796–806. [PubMed] [Google Scholar]
- 25.Knight OJ, Chang RT, Feuer WJ, Budenz DL. Comparison of retinal nerve fiber layer measurements using time domain and spectral domain optical coherent tomography. Ophthalmology. 2009 Jul;116(7):1271–7. doi: 10.1016/j.ophtha.2008.12.032. [DOI] [PMC free article] [PubMed] [Google Scholar]
- 26.Carpel EF, Engstrom PF. The normal cup-disk ratio. Am J Ophthalmol. 1981 May;91(5):588–97. doi: 10.1016/0002-9394(81)90056-8. [DOI] [PubMed] [Google Scholar]
- 27.Varma R, Tielsch JM, Quigley HA, Hilton SC, Katz J, Spaeth GL, et al. Race-, age-, gender-, and refractive error-related differences in the normal optic disc. Arch Ophthalmol. 1994 Aug;112(8):1068–76. doi: 10.1001/archopht.1994.01090200074026. [DOI] [PubMed] [Google Scholar]
- 28.Trip SA, Schlottmann PG, Jones SJ, Garway-Heath DF, Thompson AJ, Plant GT, et al. Quantification of optic nerve head topography in optic neuritis: a pilot study. Br J Ophthalmol. 2006 Sep;90(9):1128–31. doi: 10.1136/bjo.2006.092031. [DOI] [PMC free article] [PubMed] [Google Scholar]
- 29.Talman LS, Bisker ER, Sackel DJ, Long DA, Jr, Galetta KM, Ratchford JN, et al. Longitudinal study of vision and retinal nerve fiber layer thickness in multiple sclerosis. Ann Neurol. Jun;67(6):749–60. doi: 10.1002/ana.22005. [DOI] [PMC free article] [PubMed] [Google Scholar]
- 30.Green AJ, McQuaid S, Hauser SL, Allen IV, Lyness R. Ocular pathology in multiple sclerosis: retinal atrophy and inflammation irrespective of disease duration. Brain. Jun;133(Pt 6):1591–601. doi: 10.1093/brain/awq080. [DOI] [PMC free article] [PubMed] [Google Scholar]
- 31.Milea D, Amati-Bonneau P, Reynier P, Bonneau D. Genetically determined optic neuropathies. Curr Opin Neurol. Feb;23(1):24–8. doi: 10.1097/WCO.0b013e3283347b27. [DOI] [PubMed] [Google Scholar]
- 32.Chung KW, Kim SB, Park KD, Choi KG, Lee JH, Eun HW, et al. Early onset severe and late-onset mild Charcot-Marie-Tooth disease with mitofusin 2 (MFN2) mutations. Brain. 2006 Aug;129(Pt 8):2103–18. doi: 10.1093/brain/awl174. [DOI] [PubMed] [Google Scholar]
- 33.Friedman DS, Wolfs RC, O’Colmain BJ, Klein BE, Taylor HR, West S, et al. Prevalence of open-angle glaucoma among adults in the United States. Arch Ophthalmol. 2004 Apr;122(4):532–8. doi: 10.1001/archopht.122.4.532. [DOI] [PMC free article] [PubMed] [Google Scholar]


