Abstract
Purpose: The focus of this article is to develop signal and imaging processing methods to derive an accurate estimation of local tissue elasticity using the crawling wave (CrW) sonoelastography method. The task is to reduce noise and to improve the contrast of the elasticity map.
Methods: The protocol of the CrW approach was first tested on heterogeneous elastic phantoms as a model of prostate cancers. Then, the contrast-to-noise ratio of the estimation was calculated iteratively with various sequences of algorithms to determine the optimal signal processing settings. Finally, the optimized signal processing was applied to ex vivo prostate cancer detection. The comparison of the segmented elasticity map and the histology tumor outline was made by quadrants to evaluate the diagnostic performance of the protocol. Furthermore, the CrW approach was combined with amplitude-sonoelastography to achieve a higher specificity.
Results: This study demonstrated the feasibility of the proposed approach for clinical applications. In the application to ex vivo prostate cancer detection, the established approach was tested on 43 excised prostate glands. The combination of the CrW approach and amplitude-sonoelastography achieved an accuracy of over 80% for finding tumors larger than 4 mm in diameter. The elasticity values and contrast found by the CrW approach were in agreement with the previous results derived from mechanical testing.
Conclusions: Crawling waves can be applied to detect prostate cancer with accuracy approaching 80% and can quantify the stiffness or shear modulus of both cancerous and noncancerous tissues. The technique therefore shows promise for guiding biopsies to suspect regions that are otherwise difficult to identify.
Keywords: crawling waves, elasticity imaging, shear velocity estimation, shear wave interference patterns, prostate cancer
INTRODUCTION
Elastographic imaging, broadly defined, is a group of noninvasive methods in which shear vibrations or strain images of soft tissue are used to detect or classify tumors. The concept of elastography developed from the medical practice of palpation1, 2, 3, 4 (feeling a suspected tumor with the fingers to determine various characteristics). Elastography qualitatively or quantitatively maps tissue elasticity, which is normally correlated with the pathological state of soft tissue, therefore adding new clinical information to the interpretation of ultrasound, computed tomography, or other scans. Elastography offers a much wider range of detectable parameters than conventional imaging techniques. It is feasible to distinguish between benign and malignant tissues by comparing their elasticity moduli. Elastography has been found to be helpful in detecting breast,5, 6 thyroid,7 prostate,8 and liver abnormalities.9 A variety of elastography techniques, including vibration sonoelastography, compression elastography, magnetic resonance elastography, acoustic radiation force impulse imaging, and transient elastography, have been developed in the field since the late 1980s.10 Compression elastography, which produces strain images, has been applied to the prostate in several large clinical trials.11, 12, 13 In these trials the accuracy of cancer detection is found to be in the range between 70% and 80%.
Wu et al.14 introduced the concept of crawling waves into the elastography field in 2004. Two shear wave sources are placed on the two opposite sides of a sample, driven by sinusoidal signals with slightly offset frequencies. The shear waves from the two sources interact to create interference patterns, which are visualized by the vibration sonoelastography technique. Estimations of local shear velocity can be made from the shear wave propagation pattern and, thus, the shear modulus.
Several approaches have been proposed to estimate local shear velocity from the crawling wave (CrW) patterns,15 including a method based on a local spatial frequency estimator,16 estimation by moving interference pattern arrival times,17 and the local autocorrelation method for both 1D (Ref. 18) and 2D shear velocity recoveries.19 A study of the congruence between the last technique and the mechanical measurement validated the imaging modality for quantification of soft tissue properties.20
The CrW technique has been used to depict the elastic properties of biological tissues including radiofrequency ablated hepatic lesions in vitro,18 human skeletal muscle in vitro,21 and excised human prostate.22 In this paper, we focus on crawling waves in the prostate.
THEORY
Crawling wave model
Crawling waves are interference patterns set in motion by creating a relative frequency shift between the two counterpropagating waves. The discrete version of the detected vibration amplitude square |u|2 of the interference wave is
| (1) |
where α is the attenuation coefficient of the medium; D is the separation of the two sources; ω, the angular frequency measured in rad∕s, is 2π times the frequency (in hertz); k, the wave number and measured in rad∕m, is 2π divided by the wavelength λ (in meters); Δω is the frequency difference; Δk is the wave number difference between the two waves; m, n, and r are the spatial vertical index, the spatial lateral (shear wave propagation direction) index, and the time index, respectively; and Tn and Tr are the spatial sampling interval along the lateral direction and the temporal sampling interval, respectively.
Local autocorrelation estimator
By taking the spatial derivative of the phase argument φ along the lateral direction, the relationship between local spatial frequency and shear wave velocity is derived for the discrete model,
| (2) |
where f is the vibration frequency in units of s-1 and vshear is the local shear wave speed.
vshear was then calculated based on the following relationship:
| (3) |
where kspatial is the spatial frequency in units of m-1. In nearly incompressible soft tissues, the relationship between shear wave velocity and elastic moduli is
| (4) |
where E is the Young’s modulus, a measure of the stiffness of an isotropic elastic material, and ρ is the density of the medium.
There are a number of different ways to calculate the local spatial frequency of a digital signal. Kasai et al.23 proposed an autocorrelation technique to estimate the phase derivative of a complex signal sequence.
The phase derivative equals the phase of the autocorrelation R at one lag,
| (5) |
The autocorrelation term is calculated by
| (6) |
where N is the number of pixels in an estimator kernel and sA is the analytical signal of |u(m,n,r)|2.
Combining Eqs. 2, 5, the 1D shear wave velocity is estimated by18
| (7) |
The 2D shear wave velocity is given by18
| (8) |
In theory, taking the derivative of a phase can provide a very high resolution, but it is very sensitive to noise. Noise reduction is needed before calculating the gradient.
Amplitude sonoelastography
Crawling wave movies (or video sequences) can be processed to generate conventional vibration sonoelastographic images. A general expression for the heterogeneous medium is obtained by adding the stiffness factor A(x) to the plane wave interference pattern in the homogeneous medium,
| (9) |
By searching through the movie, which includes one or more cycles in slow-time (Δωt covers the range of 2π ), peak intensity values for each location can be found as
| (10) |
This peak intensity image maps stiffness as does the sonoelasticity image. It is called the amplitude-sonoelastographic image. In experiments, the peak value of the slow-time data sequence is obtained after the sequence is fitted to a slow-time cosine model.
As is the case with sonoelastography, amplitude-sonoelastography provides qualitative information regarding tissue elasticity. It differentiates soft and stiff regions in tissues and reveals the tumor shape to be a darker region. Combining amplitude-sonoelastography and CrW techniques may increase the reliability of tumor detection by CrW.
EXPERIMENTAL
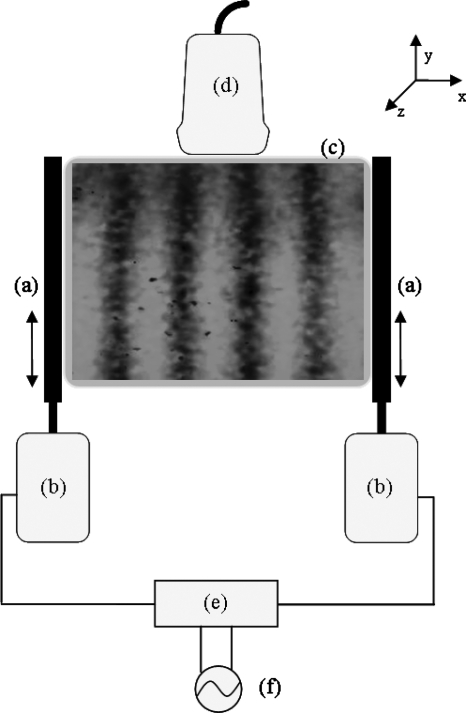
A GE Logic 9 ultrasound scanner (GE Healthcare, Milwaukee, WI) was modified to show vibrational sonoelastographic images in the color-flow mode. A sample image with the crawling wave pattern is shown in Fig. 1. An ultrasound transducer (M12L, GE Healthcare, Milwaukee, WI) was connected to the ultrasound machine and was placed on top of the phantom. It is a linear array probe with a bandwidth of 5–13 MHz.
Figure 1.
Schematic drawing of the experimental setup. (a) Line-shaped extensions, (b) piston vibration exciters, (c) the imaged cross section of the phantom, (d) ultrasound transducer, (e) amplifier, and (f) function generator.
Two piston vibration exciters (model 2706, Brüel & Kjaer, Nærum, Denmark) were placed on each side of the phantom. Two line shaped extensions were mounted on the pistons and their abraded surfaces were pressed on the phantoms with contact regions of 8×1 cm. The shear wave signals were generated by a two-channel signal generator (model AFG320, Tektronix, Beaverton, OR) and were amplified equally by a power amplifier (model 5530, AE Techron, Elkhart, IN), which was connected to the pistons (see Fig. 1 for an illustration). The imaged cross section is parallel to the x-y plane. The transducer and the vibration line sources are in the same plane. The x direction corresponds to the width of the phantom and the y direction corresponds to the depth of the phantom. The phantom is moved along the z direction for examination at different cross sections. The shear vibration is along the y axis and the shear wave propagates along the x axis. If the line extensions are longitudinally in good contact with the phantom, then the particles in the phantom at different depths are disturbed by equal forces. Thus, the waves traveling in the imaging plane can be considered as plane waves.
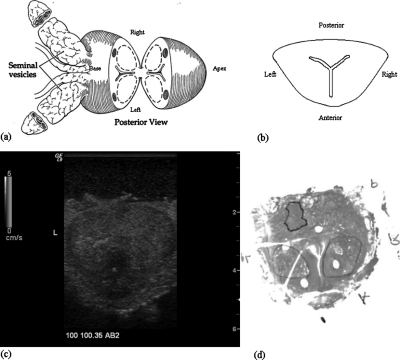
The ex vivo experiments on prostate cancer detection were performed using the system. Each prostate gland was embedded in 10.5% gelatin with the dimension of 12.5×10×15 cm3. Three sections perpendicular to the posterior of the prostate gland were chosen for imaging. One (AB1) was close to the apex, another (AB2) was at the middle gland, and the other (AB3) was close to the base. Crawling wave movies at 100, 120, and 140 Hz were taken at each section. In our current system, this bandwidth represents the optimal window for crawling waves in larger (5 cm diameter) prostates. Above 140 Hz, the increasing shear wave attenuation with frequency24 makes the signal too weak in larger prostates. Below 100 Hz, the wavelengths become too large for our estimator. It is likely that this window can be extended using improved sources and estimators. The frequency offset was adjusted so that the crawling wave pattern crawls at least one wavelength through the movie. After imaging each section, two needles were inserted into the imaging plane to mark the section. An expert pathologist read the slides and outlined the cancerous regions. The histology slides provided the ground truth of cancer distribution for the crawling wave imaging method. An illustration of an imaging section taken at the middle gland is shown in Fig. 2. Figures 2a, 2b show the posterior view and the transverse view of the gland, respectively. Figure 2c shows the B-mode scan of the cross section with the left gland marked with “L.” The gland is positioned so that the posterior is closer to the transducer and it is at the top of the image and the patient’s left is clearly marked on B-scan. Figure 2d shows the histology slide corresponding to the scan. The left gland, the right gland, the anterior, and the posterior are marked with “L,” “R,” “A,” and “P,” respectively.
Figure 2.
Illustration of an imaging section at the middle gland. (a) View of the prostate and attached seminal vesicles after a single slide has been made through the midprostate posteriorly (Ref. 25). (b) Transverse view of the slide for imaging. (c) The B-mode scan. (d) The histology slide marked for cancer (dark outline) and BPH (lighter outlines).
METHODS
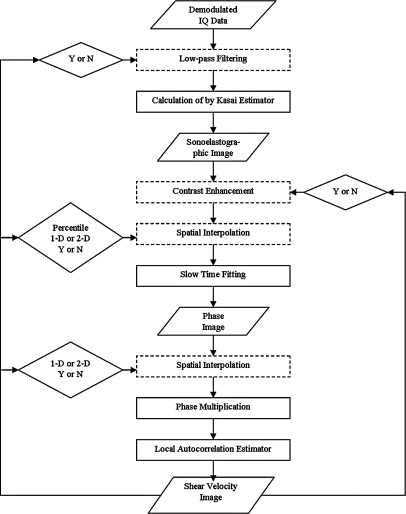
In this section, effort was made to clear the noise in signals and hence improve the contrast of the elasticity map and increase the credibility of lesion detection. The signal processing procedures for noise reduction are illustrated in the flow chart in Fig. 3. Procedures shown in dotted rectangular areas may or may not improve the final estimation results. They are simulated both with and without other procedures. The comparison between estimation results determines whether or not to apply them. Conditions represented by diamond shapes are optimized in simulation to determine the parameters or the procedures for best estimations. The input and output data forms are shown in parallelograms. The phase multiplication step and the final one-lag local autocorrelation estimate of shear wave speed have been described in detail previously.19
Figure 3.
The flow chart of signal processing for local elasticity estimation.
Four signal processing methods were proposed for noise reduction. Except for the slow-time fitting method, it is undecided whether these methods will be used in the final signal processing sequence. Each of the methods was performed solely with slow-time fitting. Combinations of the methods were also tested. The procedures were done on a crawling wave movie for the 6 mm inclusion phantom at 100 Hz.
The contrast-to-noise ratio (CNR) results are shown in Table Table I.. The CNR is chosen because we wish to display maximum contrast of a stiff lesion with minimal variation in a homogeneous background. The first item in the table corresponds to the denoising procedure with slow-time fitting only. The first row corresponds to procedures with low-pass filtering on IQ data, contrast enhancement, or low-pass filtering and contrast enhancement in addition to slow-time fitting. The first column corresponds to procedures using the spatial interpolation method (1D linear, 1D spline or 2D interpolation, and interpolation performed on sonoelastographic images or on phase images) in addition to slow-time fitting. The rest of the table shows results from combinations of methods.
Table 1.
Contrast-to-noise ratio results.
| CNR | No procedure | IQ low pass | Contrast enhance | IQ low pass and contrast enhance |
|---|---|---|---|---|
| No procedure | 1.6336 | 2.6149 | 1.5651 | 2.4094 |
| 2D interp 10% (phase) | 1.779 | 2.7874 | 1.5647 | 2.4654 |
| 2D interp 10% (sono) | 1.905 | 2.9366 | 1.8157 | 2.6717 |
| 1D spline interp 10% (phase) | 1.8542 | 2.698 | 1.8759 | 2.4456 |
| 1D spline interp 10% (sono) | 2.0572 | 3.0363 | 1.9056 | 2.8414 |
| 1D linear interp 10% (phase) | 2.1412 | 3.0279 | 1.9933 | 2.8423 |
| 1D linear interp 10% (sono) | 2.1153 | 3.1144 | 2.0634 | 2.9067 |
| 1D linear interp 15% (sono) | 2.3047 | 3.4255 | 2.4325 | 3.3086 |
| 1D linear interp 20% (sono) | 2.3695 | 3.573 | 2.5376 | 3.1084 |
| 1D linear interp 25% (sono) | 2.3983 | 3.4493 | 2.5922 | 3.3384 |
| 1D linear interp 30% (sono) | 2.5717 | 3.4357 | 2.6598 | 3.3118 |
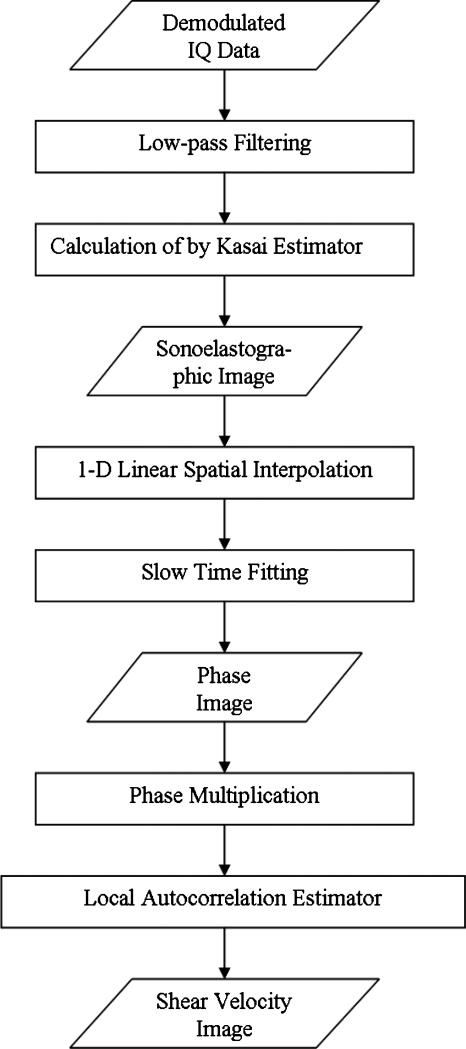
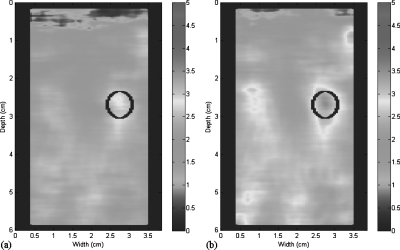
It can be seen that among all spatial interpolation algorithms, 1D linear interpolation provides the best results. Thus, various percentiles of interpolation were tested with this method. The combination of low-pass filtering on IQ data and 1D linear interpolation on sonoelastographic images yields the highest CNRs compared to other combinations. The highest value, 3.573, was reached with 20% interpolation, that is, the lowest 20% of signals ranked by Doppler energy are dropped and interpolated. Dropping 25% and 30% produces poorer overall CNR, evidently the required interpolations are inadequate. The optimal procedure to obtain shear velocity estimations with high CNR is illustrated in Fig. 4. A comparison between the shear velocity maps estimated from the procedure with only slow-time fitting (a) and from the optimal procedure (b) is shown in Fig. 5.
Figure 4.
The final flow chart for the optimal local elasticity estimation.
Figure 5.
Shear velocity estimations. (a) Estimation by the denoising procedure with only slow-time fitting. (b) Estimation by the optimal denoising procedure. Color scale units are in cm∕s.
RESULTS
The CrW approach
Forty-three ex vivo prostate glands were examined using the CrW approach. For each exam, shear velocity images were extracted for three cross sections of the prostate gland. Crawling wave movies of 129 sections were acquired and 10 sections were discarded because of extremely low SNR. The selected 119 sections were divided by quadrant (upper left, upper right, lower left, and lower right) and the 476 quadrants were compared to the corresponding histology slices for diagnostic accuracy analysis.
153 quadrants were true positives (TPs). Among the TPs, 22 were tumors (indicated in the histology slices) with a small size (effective diameter <4 mm). 152 quadrants contained false positives (FPs). Among the false positives, 17 were related to tumors (indicated in the segmented shear wave velocity maps) with a small size (effective diameter <4 mm) and 41 coincided with benign prostatic hyperplasia (BPH). Forty-eight quadrants were false negatives (FNs). Among the false negatives, nine were related to tumors (indicated in the histology slices) with a small size (effective diameter <4 mm). 123 quadrants were true negatives (TNs). The tumor statistics of the CrW approach are listed in Table Table II.. The statistics not including small tumors (excluding those with effective diameter <4 mm) are summarized at the bottom half of the table. As shown in Table Table III., sensitivity, specificity, and diagnostic accuracy were calculated based on the collected information of tumor statistics to evaluate the performance of the approach in prostate cancer detection. The performance, when not considering false positives caused by BPH, is summarized at the bottom half of the table.
Table 2.
Tumor statistics of the CrW approach.
| CrW | Gland No. | Quadrant No. | TP No. | FP No. | TN No. | FN No. | BPH No. |
|---|---|---|---|---|---|---|---|
| All size | 43 | 476 | 153 | 152 | 123 | 48 | 41 |
| ≥4 mm | 43 | 428 | 131 | 135 | 123 | 39 | 38 |
Table 3.
Performance of the CrW approach in ex vivo prostate cancer detection.
| CrW | Accuracy (%) | Sensitivity (%) | Specificity (%) |
|---|---|---|---|
| All size w∕BPH | 57.98 | 76.12 | 44.73 |
| ≥4 mm w∕BPH | 59.35 | 77.06 | 47.67 |
| All size w∕o BPH | 63.45 | 76.12 | 52.56 |
| ≥4 mm w∕o BPH | 65.13 | 77.06 | 55.91 |
It was observed that the performance was enhanced when not considering quadrants with small size tumors (<4 mm). Diagnostic accuracy and specificity were increased when quadrants with false positives possibly caused by BPH were discarded in the analysis.
Combination of CrW sonoelastography and amplitude-sonoelastography
As shown in Table Table III., the specificity of CrW sonoelastography was low due to false positives. It was possibly caused by reflections at tissue boundaries where the intensity was typically saturated in the CrW movies. As a result, the false positives were often shown as a brighter region in amplitude-sonoelastographic images, which reveal the amplitude of the crawling waves. Since the brighter regions can be segmented and excluded, these false positives were eliminated when we considered the assessment by amplitude-sonoelastography. Furthermore, hard cancers should result in a localized amplitude deficit, which can be segmented. To enhance the performance of the CrW approach, we combined it with the amplitude-sonoelastography method.
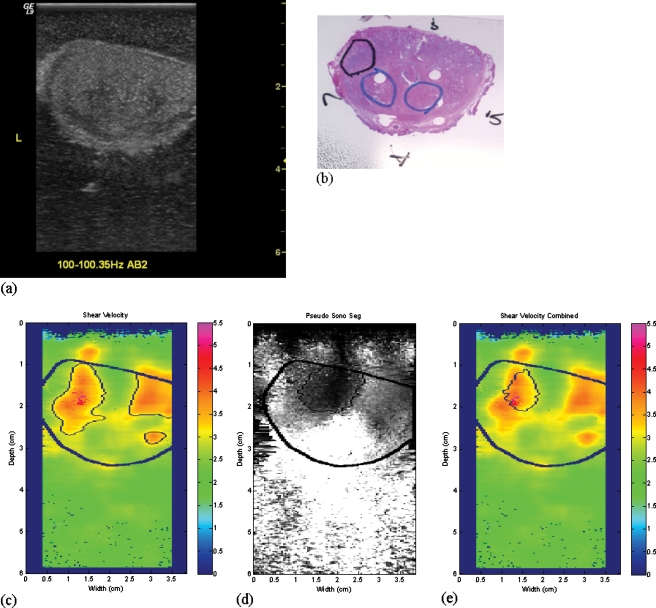
First, the amplitude-sonoelastographic images were generated from the CrW movies. Second, tumors shown as a darker area were segmented from the images. Then, the intersection of the amplitude-sonoelastography segmentation and the CrW segmentation was obtained as the final tumor area. An example of the combined approach is shown in Fig. 6. The false positives in the segmented tumor regions obtained using the CrW approach were eliminated when combining the segmentation results from the amplitude-sonoelastography approach. The final segment was in approximately the same position as the outline of the tumor (in black color) on the histological slice.
Figure 6.
An illustration of the combined approach. Shown are coregistered images of a transverse slice of a prostate. (a) The B-mode image. (b) The histology slice with thick black circle indicating cancer and other light clue circles indicating BPH. (c) The CrW segment. (d) The amplitude-sonoelastography segment. (e) The final segment. Color scale units are cm∕s.
The tumor statistics of the combined approach are listed in Table Table IV.. The statistics, not including small tumors (effective diameter <4 mm), are summarized in the bottom half of the table. As shown in Table Table V., sensitivity, specificity, and diagnostic accuracy were calculated based on the collected tumor statistics to evaluate the performance of the approach in prostate cancer detection. The performance, when not considering false positives caused by BPH, is summarized at the bottom half of the table. We observed a similar trend when the tumor size consideration and the BPH consideration were varied as discussed in the CrW approach.
Table 4.
Tumor statistics of the combined approach.
| Combined | Gland No. | Quadrant No. | TP No. | FP No. | TN No. | FN No. | BPH No. |
|---|---|---|---|---|---|---|---|
| All Size | 43 | 476 | 109 | 49 | 236 | 77 | 15 |
| ≥4 mm | 43 | 428 | 97 | 36 | 236 | 59 | 12 |
Table 5.
Performance of the combined approach in ex vivo prostate cancer detection.
| Combined | Accuracy (%) | Sensitivity (%) | Specificity (%) |
|---|---|---|---|
| All size w∕BPH | 73.25 | 58.60 | 82.81 |
| ≥4 mm w∕BPH | 77.80 | 62.18 | 86.76 |
| All size w∕o BPH | 75.66 | 58.60 | 87.41 |
| ≥4 mm w∕o BPH | 80.05 | 62.18 | 90.77 |
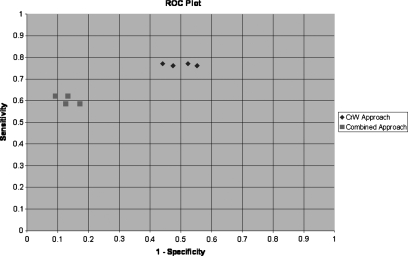
The receiver operating characteristic (ROC) plot of both the CrW approach and the combined approach is shown in Fig. 7. It was observed that the medical decision points resulting from the combined approach (shown in square symbols) were clustered in the area of high specificity and low sensitivity; on the other hand, the points obtained by using the CrW approach (shown in diamond symbols) were clustered in the area of high sensitivity and low specificity. In other words, the combined approach increased the specificity of the CrW approach. However, its sensitivity was lowered as a trade-off. The combined approach without considering BPH and small size tumors (the leftmost diamond symbol) yielded the highest diagnostic accuracy of 80.05% among all studied methods.
Figure 7.
The ROC plot of different approaches.
Elasticity contrast
Twenty sections with both true positive quadrants and true negative quadrants were selected to evaluate the elasticity range of cancerous vs noncancerous tissues. The shear wave velocity estimations of cancerous and noncancerous tissues were 3.49±0.49 and 2.40±0.19 m∕ s, respectively. The contrast was 1.45. Based on the square root relationship between the elasticity modulus and the shear wave velocity of the tissue, the estimated Young’s moduli of the cancerous and noncancerous tissues were 37.28±10.47 and 17.42±2.73 kPa, respectively. The values are within the ranges of 40.4±15.7 kPa for cancerous prostate tissues and 15.9±5.9 kPa for noncancerous tissues reported from mechanical testing.24 Our estimated elasticity contrast is 2.1, similar to the contrast value of 2.6 in prostate cancer found by mechanical testing.24
CONCLUSIONS
The motivation of the thesis was to establish a complete and reliable protocol to quantify the local tissue elastic modulus based on the CrW sonoelastography method. The protocol then could be applied to clinical applications, primarily ex vivo prostate cancer detection.
To accomplish the task, the study was first concentrated on developing and improving signal and imaging processing methods to obtain tissue elasticity maps with higher CNR. The improvement was focused on reduction of noise in the sonoelastographic movies of CrW propagation. The variety of imaging processing algorithms was considered with respect to both the characteristics of raw sonoelastographic signals and the properties of CrW propagation. The combination of low-pass filtering on IQ data, 1D linear interpolation on sonoelastographic images, and the slow-time fitting method was found to be the optimal image processing procedure. The CNR value of the 6 mm inclusion phantom resulting from this combination of algorithms was 3.57, which was much higher than the CNR of 1.63 resulting from solely using the slow-time fitting method.
After the signal processing protocol of the CrW approach was completed by studying the inclusion phantoms, it was then transferred and applied to ex vivo prostate cancer detection. Its diagnostic performance was evaluated by inspecting 43 excised prostate glands and comparing the indicated cancerous region to the histological outline of tumors.
476 quadrants in total were assessed to be TP, FP, TN, or FN. The statistics further yielded the sensitivity, the specificity, and the accuracy of the CrW approach. The combination of the CrW approach and amplitude-sonoelastography increased the specificity yet lowered the sensitivity. The highest accuracy, 80.05%, was achieved by the combined method after excluding BPH and small size (<4 mm) tumors. The specificity was 90.77% and the sensitivity was 62.18%. This point was closest to the upper left corner of the ROC space. This compares to an accuracy of 76% in a major study in Germany13 using compression elastography, which creates strain images. This group also used step section pathology analysis as their gold standard, similar to our analysis methods. Other groups using strain images employed biopsy results as the gold standard.11, 12 In the context of image guided biopsies, a false negative from imaging implies that an existing cancer was not identified. A false positive from imaging implies the biopsy for a suspect region was negative. Since 6–12 needle biopsies are commonly used, the problem of false positives may not be weighted as highly by some in considering trade-offs between sensitivity and specificity.
Lastly, the estimated elastic moduli and the elasticity contrast of cancerous and noncancerous areas from 20 prostate sections were investigated. The estimated elasticity values of the normal tissues and the tumors fell into the ranges provided by mechanical testing.24 The contrast was also in agreement with the mechanical testing results.
The results suggested that the CrW approach in combination with amplitude-sonoelastography could be adapted to detect prostate cancer. The quantitative estimation of elasticity obtained by using the CrW approach was in agreement with the mechanical testing result and was trustworthy. The estimated contrast of tumors and normal tissue supported the feasibility of the CrW approach to detect cancer and may be of particular value in guiding biopsy needles to suspect regions.
ACKNOWLEDGMENTS
This research was supported by the NIH Grant No. 5 R01 AG016317-06. The authors greatly acknowledge Laurie Baxter and LeeAnn Kushner from the Surgical Pathology Department at University of Rochester Medical Center for acquiring the histology slices. The authors also thank the reviewers for their constructive comments.
References
- Lerner R. M., Parker K. J., Holen J., Gramiak R., and Waag R. C., “Sonoelasticity: Medical elasticity images derived from ultrasound signals in mechanically vibrated targets,” Acoust. Imaging 16, 317–327 (1988). [Google Scholar]
- Parker K. J., Huang S. R., and Musulin R. A., “Tissue response to mechanical vibrations for sonoelasticity imaging,” Ultrasound Med. Biol. 16, 241–246 (1990). 10.1016/0301-5629(90)90003-U Medline [DOI] [PubMed] [Google Scholar]
- Huang S. R., Lerner R. M., and Parker K. J., “On estimating the amplitude of harmonic vibration from the Doppler spectrum reflected signals,” J. Acoust. Soc. Am. 88, 2702–2712 (1990). 10.1121/1.399673 [DOI] [Google Scholar]
- Ophir J., Céspedes I., Ponnekanti H., Yazdi Y., and Li X., “Elastography: A quantitative method for imaging the elasticity of biological tissues,” Ultrason. Imaging 13, 111–134 (1991). 10.1016/0161-7346(91)90079-W Medline [DOI] [PubMed] [Google Scholar]
- Garra B. S., Cespedes E. I., Ophir J., Spratt S. R., Zuurbier R. A., Magnant C. M., and Pennanen M. F., “Elastography of breast lesions: Initial clinical results,” Radiology 202, 79–86 (1997). [DOI] [PubMed] [Google Scholar]
- Zhi H., Ou B., Luo B., Feng X., Wen Y., and Yang H., “Comparison of ultrasound elastography, mammography, and sonography in the diagnosis of solid breast lesions,” J. Ultrasound Med. 26, 807–815 (2007). [DOI] [PubMed] [Google Scholar]
- Scacchi M., Andrioli M., Carzaniga C., Vitale G., Moro M., Poggi L., Pecori Giraldi F., Fatti L. M., and Cavagnini F., “Elastosonographic evaluation of thyroid nodules in acromegaly,” Eur. J. Endocrinol. 161, 607–613 (2009). 10.1530/EJE-09-0558 Medline [DOI] [PubMed] [Google Scholar]
- Miyagawa T., Tsutsumi M., Matsumura T., Kawazoe N., Ishikawa S., Shimokama T., Miyanaga N., and Akaza H., “Real-time elastography for the diagnosis of prostate cancer: Evaluation of elastographic moving images,” Jpn. J. Clin. Oncol. 39, 394–398 (2009). 10.1093/jjco/hyp026 Medline [DOI] [PubMed] [Google Scholar]
- Venkatesh S. K., Yin M., Glockner J. F., Takahashi N., Araoz P. A., Talwalkar J. A., and Ehman R. L., “MR elastography of liver tumors: Preliminary results,”AJR, Am. J. Roentgenol. 190, 1534–1540 (2008). 10.2214/AJR.07.3123 [DOI] [PMC free article] [PubMed] [Google Scholar]
- Parker K. J., Doyley M. M., and Rubens D. J., “Imaging the elastic properties of tissue: The 20 year perspective,” Phys. Med. Biol. 56, R1–R29 (2011). 10.1088/0031-9155/56/1/R01 Medline [DOI] [PubMed] [Google Scholar]
- Kamoi K., Okihara K., Ochiai A., Ukimura O., Mizutani Y., Kawauchi A., and Miki T., “The utility of transrectal real-time elastography in the diagnosis of prostate cancer,” Ultrasound Med. Biol. 34, 1025–1032 (2008). 10.1016/j.ultrasmedbio.2007.12.002 Medline [DOI] [PubMed] [Google Scholar]
- Pallwein L., Mitterberger M., Pinggera G., Aigner F., Pedross F., Gradl J., Pelzer A., Bartsch G., and Frauscher F., “Sonoelastography of the prostate: Comparison with systematic biopsy findings in 492 patients,” Eur. J. Radiol. 65, 304–310 (2008). 10.1016/j.ejrad.2007.03.032 Medline [DOI] [PubMed] [Google Scholar]
- Salomon G., Kollerman J., Thederan I., Chun F. K. H., Budaus L., Schlomm T., Isban H., Heinzer H., Huland H., and Graefen M., “Evaluation of prostate cancer detection with ultrasound real-time elastography: A comparison with step section pathological analysis after radical prostatectomy,” Eur. Urol. 54, 1354–1362 (2008). 10.1016/j.eururo.2008.02.035 Medline [DOI] [PubMed] [Google Scholar]
- Wu Z., Taylor L. S., Rubens D. J., and Parker K. J., “Sonoelastographic imaging of interference patterns for estimation of the shear velocity of homogenous biomaterials,” Phys. Med. Biol. 49, 911–922 (2004). 10.1088/0031-9155/49/6/003 Medline [DOI] [PubMed] [Google Scholar]
- Lin K., McLaughlin J., Renzi D., and Thomas A., “Shear wave speed recovery in sonoelastography using crawling wave data,” J. Acoust. Soc. Am. 128, 88–97 (2010). 10.1121/1.3442575 Medline [DOI] [PMC free article] [PubMed] [Google Scholar]
- Wu Z., Hoyt K., Rubens D. J., and Parker K. J., “Sonoelastographic imaging of interference patterns for estimation of shear velocity distribution in biomaterials,” J. Acoust. Soc. Am. 120, 535–545 (2006). 10.1121/1.2203594 Medline [DOI] [PubMed] [Google Scholar]
- McLaughlin J., Renzi D., Parker K., and Wu Z., “Shear wave speed recovery using moving interference patterns obtained in sonoelastography experiments,” J. Acoust. Soc. Am. 121, 2438–2446 (2007). 10.1121/1.2534717 Medline [DOI] [PubMed] [Google Scholar]
- Hoyt K., Parker K. J., and Rubens D. J., “Sonoelastographic shear velocity imaging: Experiments on tissue phantom and prostate,” Proc.-IEEE Ultrason. Symp. 1686–1689 (2006). 10.1109/ULTSYM.2006.423 [DOI] [Google Scholar]
- Hoyt K., Castaneda B., and Parker K. J., “Two-dimensional sonoelastographic shear velocity imaging,” Ultrasound Med. Biol. 34, 276–288 (2008). 10.1016/j.ultrasmedbio.2007.07.011 Medline [DOI] [PubMed] [Google Scholar]
- Zhang M., Castaneda B., Wu Z., Nigwekar P., Joseph J. V., Rubens D. J., and Parker K. J., “Congruence of imaging estimators and mechanical measurements of viscoelastic properties of soft tissues,” Ultrasound Med. Biol. 33, 1617–1631 (2007). 10.1016/j.ultrasmedbio.2007.04.012 Medline [DOI] [PMC free article] [PubMed] [Google Scholar]
- Hoyt K., Castaneda B., and Parker K. J., “Muscle tissue characterization using quantitative sonoelastography: Preliminary results,” Proc.-IEEE Ultrason. Symp. 365–368 (2007). 10.1109/ULTSYM.2007.101 [DOI] [Google Scholar]
- Castaneda B., An L., Wu S., Baxter L. L., Yao J. L., Joseph J. V., Hoyt K., Strang J., Rubens D. J., and Parker K. J., “Prostate cancer detection using crawling wave sonoelastography,” Proc. SPIE 7265, 726513-1–726513-10 (2009). 10.1117/12.811720 [DOI] [Google Scholar]
- Kasai C., Namekawa K., Koyano A., and Omoto R., “Real-time two-dimensional blood flow imaging using an autocorrelation technique,” IEEE Trans. Sonics Ultrason. 32, 458–464 (1985). 10.1109/T-SU.1985.31615 [DOI] [Google Scholar]
- Zhang M., Nigwekar P., Castaneda B., Hoyt K., Joseph J. V., di A. Sant’Agnese, Messing E. M., Strang J. G., Rubens D. J., and Parker K. J., “Quantitative characterization of viscoelastic properties of human prostate correlated with histology,” Ultrasound Med. Biol. 34, 1033–1042 (2008). 10.1016/j.ultrasmedbio.2007.11.024 Medline [DOI] [PubMed] [Google Scholar]
- Ohori M., Kattan M., Scardino P. T., and Wheeler T. M., “Radical prostatectomy for carcinoma of the prostate,” Mod. Pathol. 17, 349–359 (2004). 10.1038/modpathol.3800056 Medline [DOI] [PubMed] [Google Scholar]


