

Abstract
Second Harmonic Generation microscopy has emerged as a powerful new optical imaging modality. This Feature describes its chemical and physical principles and highlights current applications in disease diagnostics.
In the last decade, there has been a fruitful marriage of traditional chemical nonlinear optical (NLO) spectroscopic methods with biological microscopy. For example, chemists have long used modalities such as Second Harmonic Generation (SHG), Third Harmonic Generation (THG), Coherent anti-Stokes Raman (CARS), and multiphoton excitation (MPE) and are now applying these to optical imaging of cells and tissues. A strong emphasis has been on developing these methods as quantitative tools not just for basic science research, but also as future diagnostic tools for clinical applications because of the submicron resolution afforded by optical wavelengths. In contrast, clinical tomographic modalities such as computed tomography (CT), MRI, and positron emission tomography (PET) are limited to ~1 mm. This capability is particularly relevant given the size scales of cells/tissues, which display architectures ranging from ~50 nm for organelles to tens of microns for whole cells, and alterations on these scales in the 3D tissue environment accompany many diseases.
Historically, clinical imaging at the cellular level has been performed by pathologists on ex vivo biopsies removed by the surgeon. While histology remains the “gold standard”, its accuracy depends on the experience and interpretation skill of the pathologist. Furthermore, histological samples are fixed and sliced into thin sections (~5–10 μm), making spatial correlations difficult.
An important potential role exists for quantitative optical microscopy approaches that eliminate the pitfalls of both noninvasive imaging (lack of resolution/specificity) and traditional histology (subjectivity). High resolution nonlinear optical microscopy can meet many of these challenges in imaging and quantifying tissue structural changes during disease progression. For example, collagen in the extracellular matrix (ECM), upon which epithelial cells are supported, is highly altered in cancer, connective tissue diseases, autoimmune disorders, and cardiovascular diseases. In this Feature, we will focus on SHG imaging microscopy for quantitative analysis of diseased states.
Overview of SHG microscopy
SHG is a second order coherent process in which two lower energy photons are up-converted to exactly twice the incident frequency (half the wavelength) of an excitation laser. Biological SHG imaging was first reported in 1986, when Freund investigated the polarity of collagen fibers in rat tail tendon at a resolution of ~50 μm.1 In 2002, Mohler and Campagnola2 reported practical implementation of tissue imaging at high resolution and rapid data acquisition using laser scanning, and since then, SHG microscopy has been an increasingly used imaging tool.
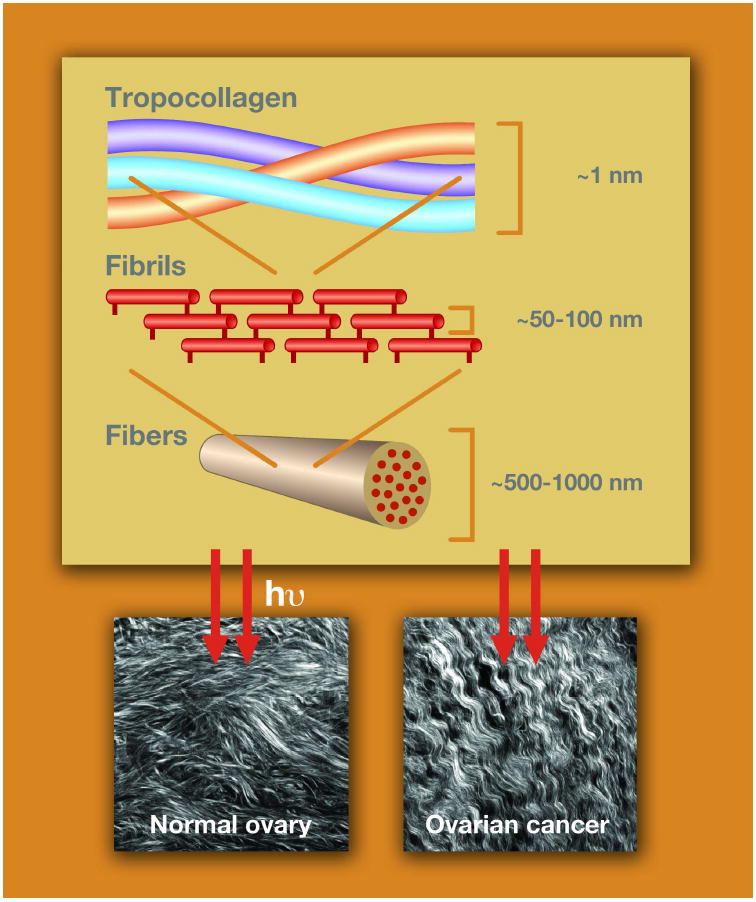
The majority of the recent reports on SHG microscopic imaging of the ECM focus on visualizing collagen fibers in a variety of connective tissues and internal organs.3-18 Of the ~20 isoforms of collagen, type I is the predominant component of the ECM and connective tissues. It is a triple helix (~300 kD) in which the three α-chains are hydrogen bond to each other. The individual molecules then self-assemble covalently into fibrils of ~20–250 nm diameter and then form fibers of ~500 nm to several microns diameter. The study of the collagen molecular and supramolecular structure has a rich history in the chemistry literature, dating back to Pauling.19
SHG microscopy has several advantages that make it ideal for imaging tissues in situ. A particularly strong attribute is that SHG microscopy directly visualizes the tissue structure because the contrast is produced purely from endogenous species. Conversely, imaging with exogenous dyes and colored proteins can only infer structural aspects. SHG signals arise from an induced polarization rather than from absorption, which leads to substantially reduced photobleaching and phototoxicity relative to fluorescence methods (including multiphoton). In addition, because laser fundamental wavelengths are typically in the NIR spectral range (700–1000 nm), SHG microscopy can achieve high resolution imaging to depths of several hundred microns.
Chemical and physical underpinnings
SHG is a second order process and governed by the nonlinear susceptibility tensor χ(2). Figure 1a is a Jablonski diagram showing the process and representative images from normal and malignant human ovarian biopsies.20 The second order symmetry of χ(2) imposes severe restrictions on the harmonophores (and their assembly) that can be imaged because the environment must be non-centrosymmetric on the size scale of λSHG.
Figure 1.

Overview of SHG photophysics, representative images, and instrumentation. A) The Jablonski diagram for non-resonant SHG. Typical laser and SHG wavelengths are 900 and 450 nm, respectively. The images are representative single optical sections (field size = 170 μm) of the collagen fibers in normal human ovary (left) and malignant ovary (right), in which striking differences in collagen morphology are revealed by SHG. B) Schematic of a typical SHG microscope optimized for forward and backward detection. Polarization optics in the excitation and signal paths (omitted from the backward path for figure clarity) allow detailed structural analysis of collagen organization. The forward and backward detectors are identical, and the paths are calibrated for collection and detection efficiency. PMT=photomultiplier, GLP=Glan-Laser Polarizer, λ/2 and λ/4=half and quarter wave plates, respectively.
Though χ(2) is the bulk quantity measured in an experiment, the molecular level property of the nonlinearity, i.e., the first hyperpolarizability, β, forms the basis of the contrast mechanism. Schanne-Klein recently used Hyper-Rayleigh Scattering measurements to show that the molecular origin of β in collagen arises from coherent amplification of peptide bonds along the length of the molecule.21 This finding was consistent with our previous polarization analysis that showed the measured response arises from the pitch angle (~50°) of the individual α-helices in the collagen molecule.22 Additionally, polarization resolved sum-frequency generation (SFG) imaging has now shown that both achiral and chiral components contribute to the overall signal.23 These molecular aspects are relevant to imaging of diseased tissues because genetic/structural changes that alter the helical pitch angle and/or interchain crosslinking will then alter the physical assembly of fibrils and fibers, which yield different signatures when viewed in the SHG microscope. For example, we used SHG to quantitatively delineate normal tissues at the fibril and fiber levels for the connective disorder Osteogenesis Imperfecta (OI), which results from genetic mutations within the individual α-chains.24,25
Phase matching considerations that are specific to SHG from tissues are different from the more familiar environment of uniaxial doubling crystals.26 In the latter case, SHG is perfectly phase matched, i.e., Δk = k2ω-2kω = 0 (k2ω and kω are the wave vectors for the SHG and incident photon, respectively). SHG emission from such perfectly phase matched systems is 100% forward directed. Though collagen has been described as a nematic liquid crystal,27 the inherent randomness and dispersion in real biological tissues results in a distribution of nonzero Δk values. The relative SHG intensity scales as sin(mΔkL/2) (in which m is an integer) and becomes less efficient for larger phase mismatch. Another consequence of imperfect phase matching is that the SHG emission from tissues has a distribution of emitted forward and backward components, whose ratio is FSHG/BSHG. The extent of mismatch (and resulting directionality) depends on the regularity of the fibril/fiber assembly: structures that are ordered on the size of λSHG in the axial direction will give rise to predominantly forward SHG, whereas smaller structures will be less forward directed.26 The degree of phase-mismatch can differentiate normal and diseased tissues. For example, we showed that OI tissues were characterized by greater Δk values, and correspondingly smaller SHG intensity, than normal tissues.26
SHG instrumentation
The two primary requirements for SHG microscopy are a mode-locked femtosecond laser and a laser-scanning microscope. The most common laser for SHG imaging is the tunable (700–1000 nm) titanium sapphire oscillator. Several modifications to a laser scanning microscope are required to optimize the optical path, detection geometry, and detection electronics for full exploitation of the SHG contrast mechanism (directionality, polarization) in tissue imaging.
The complete SHG microscope requires both reflection (backward; B) and transmission (forward; F) paths, and their relative detection efficiencies must be well calibrated to perform quantitative assessments. Figure 1b shows a typical layout. Backward SHG is collected using the epi-illumination path of the microscope, where the signal is first isolated with a dichroic mirror and bandpass filter (~10 nm full width at half maximum) in the infinity space and then detected with an identical photomultiplier tube (PMT) as used in the forward geometry. The forward signal is detected using a high numerical aperture (NA) condenser or objective and filtered in the same manner as the backward component. Both a half wave (λ/2) and quarter wave (λ/4) plates precisely control the linear and circular polarization of the laser at the focal plane of the microscope. This level of control is important to perform accurate polarization methods that allow the determination of fibril/fiber structural properties. For example, Glan–Laser polarizers in the forward or backward collection paths are used for SHG polarization analysis with a well-defined excitation polarization.
Image analysis methods
Analysis of fibrosis by SHG image segmentation
A potential important medical application of SHG microscopy is imaging/characterizing fibrosis of internal organs including the kidney, liver, and lung. Fibrosis is an increased density of fibrillar collagen arising from an inflammatory response associated with many diseases (e.g., diabetes, hepatitis) and is often associated with poor prognoses.
SHG microscopy has several advantages over standard histological scoring procedures for imaging fibrosis. SHG microscopy can acquire 3D image sets through tissues of several hundred microns thick and can obtain more data than possible by histologic sections. In the latter case, the staining protocols used in histology can result in uneven staining of the fixed and thinly sliced (~5–10 μm) tissue sections, possibly leading to erroneous interpretation. There is also often little control over the angle in which the tissue is cut, and this can lead to incorrect aspect ratios.
Schanne-Klein performed the first demonstration of SHG microscopy for scoring fibroses using a mouse model of kidney disease.28 For quantification of the collagen changes in the images, they used a thresholding process for image segmentation to identify individual fibers. They distinguished fibrotic collagen from normal tissue using metrics of the fractional area of collagen coverage (density), average brightness over the image, and average value in the regions of substantial collagen (ratio of the last two). They found a quantitative increase in all these metrics in the disease model. Based on this success and the general advantages described above, they suggested the method might provide a better measure of moderate kidney fibrosis than histology.
A somewhat more sophisticated segmentation approach was taken by Yu and coworkers for imaging liver fibrosis in a rat model.29 In this study, liver ducts were mechanically damaged and then allowed to heal, resulting in fibrosis. The researchers used Otsu segmentation to score the amount of resulting collagen, and the results of the automated approach were compared to standard pathology analysis of the same tissues. They found a good correlation between these approaches at areas of low collagen coverage, but at higher densities, the results somewhat diverged. The respective absolute accuracies of these approaches require further evaluation, but with no staining required and a more objective measurement, SHG may still have advantages over traditional pathology.
Quantification of fiber alignment in cancer
Collagen deposition, or desmoplasia, increases during the progression of many cancers. To determine if changes in collagen organization can be an early diagnostic of breast cancer and if SHG is sensitive to these alterations, Keely and coworkers measured the alignment of collagen fibers in murine tumor models representing a range of disease progression. They characterized three “Tumor-Associated Collagen Signatures” (TACS), which are reproducible during defined stages of tumor progression.30,31 These signatures are characterized by (i) the presence of dense collagen localized around small tumors during early disease; (ii) collagen fibers that are parallel to the tumor boundary for in situ carcinoma; and (iii) collagen fibers that are normal to the tumor boundary for invasive disease. Representative images for these TACS are shown in Figure 2 (courtesy of Keely) along with the histograms of the distribution of angles for the latter two cases. Based on this data and the ability of cells to align fibers in self-assembled collagen gels, these authors concluded that alterations of alignment by the cells were an integral part of the invasion process in breast cancer.
Figure 2.
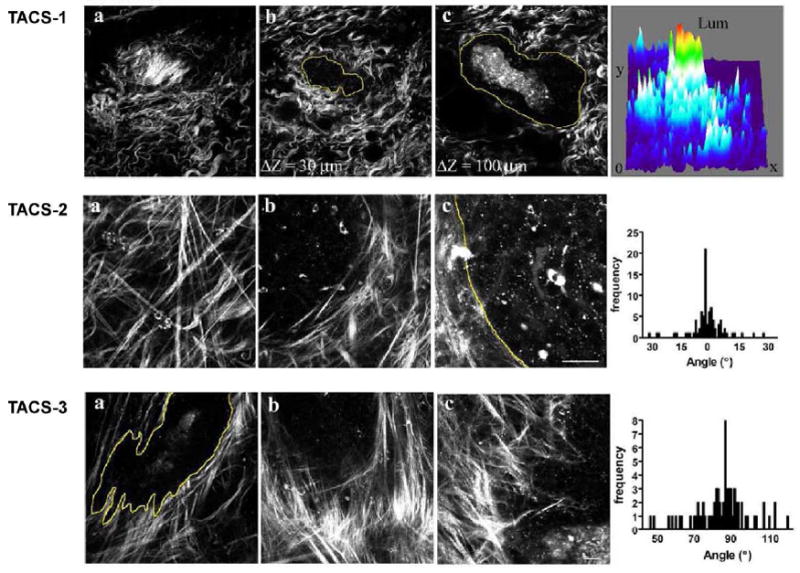
Representative methods of quantifying changes in protein fiber alignment in breast cancer by SHG microscopy. SHG probes changes in collagen in the stroma in breast cancer in a mouse model, in which disease progresses through three identifiable stages (TACS, see text) with different collagen organization. Adapted from ref. 31; images courtesy of Patricia Keely.
The TACS measurements are made relative to the tumor boundary, which is readily identifiable in breast cancer. However, in human ovarian cancer, the normal stroma is replaced by new collagen around the perimeter of the ovary, and the tumor boundary does not exist in the same manner. In this case, the characteristic anisotropy of SHG can be used to quantify the alignment of collagen molecules within fibers. This anisotropy, β, is calculated by:
| [1] |
where Ipar and Iperp correspond to the SHG intensity detected after a polarizer is oriented parallel and perpendicular to the laser polarization, respectively (see transmission path in Fig. 1b). Values of β from biological tissues range from −0 to 1, in which 0 represents completely random organization and 1 represents completely ordered fibers. This polarization analysis from single optical sections (as shown in Fig 1a) yielded β values of 0.88 and 0.76 for the malignant and normal ovary, respectively.20 The higher β for the malignant sample corresponds to greater fiber alignment, as can be inferred from the respective morphologies.
Signal processing approaches to SHG microscopy of musculoskeletal disorders
Reiser and coworkers applied spectral moment texture analysis to quantify intervertebral disk damage in a mouse model.32 Because the spectral moments are derived directly from the 2D Fourier spectrum, this approach is insensitive to scale or scan geometries, unlike other approaches such as wavelet transform analysis. The authors found that the linear discriminate classifier provided significantly different results for normal disks and those loaded under strain. Moreover, they suggested this approach may be more generally applicable to complex tissues without significant fibril/fiber alignment.
SHG creation/photon migration analysis
Image analysis schemes based on signal processing have great potential for clinical applications but may not be applicable for all cases, especially if the morphologies are too complex or irregular to quantify. As an alternative, our lab developed a general approach of quantifying differences in normal and diseased states by measuring the SHG directionality (forward to backward ratio; F/B) and attenuation (not discussed here) as a function of depth into the tissue. In a tissue imaging experiment, the measured SHG signal will be comprised of a convolution of the initially emitted directionality (FSHG/BSHG; described above) and the subsequent scattering of these photons at λSHG. The scattering coefficient, μs, is the inverse of the distance a photon will propagate before undergoing a scattering collision and changing direction and therefore is a measure of density. For most tissues, these scattering lengths are typically ~20–50 μm in the visible/NIR region of the spectrum. The scattering anisotropy, g, is related to the directionality of the scattering and varies from 0 to 1, with higher values corresponding to greater organization. Differentiating the FSHG/BSHG and incoherent components (from scattering) is an important consideration for clinical applications because either or both may be different in diseased states that have changes in fibril size and/or organization. We have previously demonstrated this approach for OI24 and summarize this analysis here for human ovarian cancer.20
Cancer of the ovary is usually asymptomatic (or presents nonspecific symptoms) until late stage disease and is thought to invade and metastasize almost simultaneously. Given the <30% five year survival rate, there remains an unmet need for new methods for early detection. Probing alterations in the ovarian ECM by SHG imaging may be a promising approach because the cancer cells interact with the underlying matrix in both invasion into the stroma (almost all type I collagen) and subsequent metastasis into the blood and lymph systems.
As a first step, we examined the respective cell content and corresponding spatial distribution within the ECM (Figure 3A) using 3D SHG imaging and conventional H&E (hematoxylin and eosin stains) histological cross sections from the same biopsies (for both normal and malignant tissues). This is an important comparison because cells are transparent in SHG contrast, whereas hematoxylin (blue) and eosin (red) visualize the cell nuclei and protein content, respectively. Compared to the normal tissue (top panels), the cancer (bottom panels) is highly acellular away from the surface epithelium, where it consists of almost exclusively of dense collagen. This densely packed structure is also apparent in the 3D SHG rendering showing tightly packed helical fibrils (as also seen in the single optical section in Figure 1). By contrast, the collagen fibers in the normal tissue are less tightly woven so the interfiber spaces can accommodate stromal cells.
Figure 3.
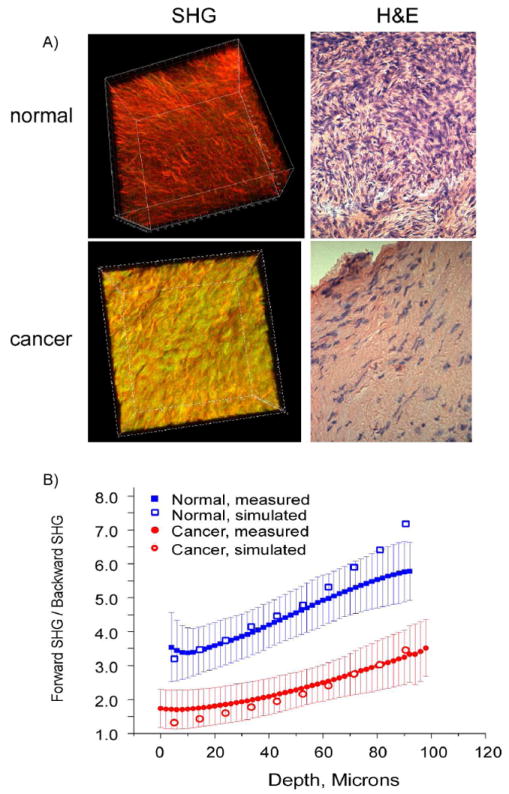
SHG imaging of human ovarian cancer. A) 3D SHG renderings (left panels) and H&E staining (right panels) of normal (top) and malignant (bottom) ovarian tissues. The field size for the 3D renderings was 170 μm and the histology cross sections were captured at 40x. Both the SHG and histological images reveal that the malignant tissues are characterized by a denser 3D collagen structure with lower cell density. B) Monte Carlo simulations of the measured F/B response for normal (blue) and malignant (red) ovarian tissues using measured bulk optical parameters. The best fit simulation to the data in each case is overlapped with the experimental data.
Though these are clearly characterized by different morphologies, we employed objective quantitative metrics based on SHG directionality and attenuation (not shown here). The emitted directionality, FSHG/BSHG, which is based on subresolution fibril organization, cannot be measured directly but is extracted through measurement of the forward–backward intensity ratio (F/B) and subsequent deconvolution via Monte Carlo simulations using the independently measured scattering coefficient and anisotropy. A series of simulations revealed %FSHG best-fit values of 93% and 77% for the normal and cancer, respectively.20 The experimental data and simulated data are shown in Figure 3B. These values are consistent with that predicted by our phase matching model (see above)26 and the TEM data (not shown), which showed the cancer to have more regularly packed fibrils. Thus, though the fibril size (~60–70 nm) is below the optical resolution of the SHG microscope, the coherence of SHG can discern differences in subresolution structure in the stroma.
This aspect of cancer progression has not been typically examined by pathologists. Thus, we envision that 3D SHG imaging/analysis of the ECM may become a new tool for ex vivo analysis not just for ovarian cancer, but for many other epithelial cancers involving ECM remodeling (e.g., breast, colon).31,33 This imaging/simulation approach, though computationally intensive, is quite general and may be effective when overly complex morphologies prevent simpler approaches based on image analysis.
Multimodal nonlinear optical approaches
Though SHG imaging predominantly probes collagen, a combination of SHG imaging with other nonlinear optical methods can provide additional information on tissue structure/composition. Specifically, multiphoton excited autofluorescence (MAF), THG, and CARS images can be acquired using largely the same instrumentation (although CARS requires two independent wavelengths) and their respective underlying chemical and physical origins yield different information. Though this approach has been used for several disease states,34-36 here we focus on the application to imaging atherosclerosis in cardiovascular diseases and the cornea.
i) Cardiovascular Disease
Cardiovascular diseases including heart attack and stroke are the most common causes of death in the U.S. Atherosclerosis, or the buildup of arterial plaques consisting of extracellular deposits of low-density lipids (LDLs), gradually develops over a period of many years. Current clinical methods such as ultrasound and MRI do not have sufficient resolution to follow the structural changes in the elastin/collagen composition of the arterial lumen, which requires imaging on the micron size scale. Multimodal approaches including SHG imaging may be suitable for imaging changes in arterial wall structure and composition.
Using tissues from Ossabaw swine, which represent metabolic syndrome induced plaques, Cheng and coworkers used SHG imaging in conjunction with MAF and CARS to compare the elastin/collagen distribution in normal tissues against those in a lesion.37 This multimodal approach is demonstrated in Figure 4 for normal tissue (a–c) and the disease model (d–f). They found that the elastin barrier (red; MAF), which is believed to prevent penetration of LDL droplets, is continuous in the normal tissue but intermingled with collagen (green; by SHG) in the lesions. Additionally, dense fibrillar collagen was across the elastin barrier near the lumen surface, where the organization was different than the distal side. Using CARS and MAF, they also identified LDL droplets and lipid rich cells on the proximal side of the lumen (not shown). The authors suggest that understanding changes in structure and spatial distribution of protein composition at this level of resolution and specificity may identify areas at risk of rupture and lead to specific treatments based on these alterations.
Figure 4.
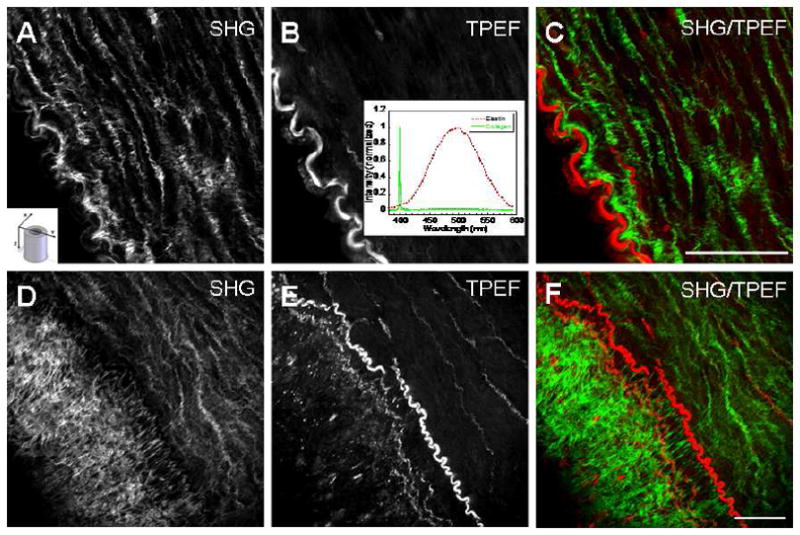
Combined SHG and two-photon excited fluorescence (TPEF, or MAF) of cardiovascular disease in a porcine model of obesity reported by Cheng and coworkers. The top panel shows data for the control animal around the vessel lumen: (A) is the collagen component and (B) is the autofluorescence from the elastin barrier and (C) is the two color overlap depicting the clear spatial separation of these proteins (green is collagen and red is elastin) present in normal anatomy. The insets depict (A) the imaging orientation relative to the vessel and (B) the SHG and fluorescence spectra. Panels D–F show the analogous images in the disease model, revealing dense collagen on the distal side of elastin, where this is the beginning of an arterial plaque. The figure is reproduced from ref. 37 with permission from SPIE Publications.
Balaban and coworkers also examined these ideas in mouse and pig models.18 Branch points may be most susceptible to plaque formation because of local wall stress and turbulence heterogeneities, so to probe branch point dynamics at the molecular level, they used SHG and MAF imaging (of collagen and elastin, respectively). At the branch points, the elastin mingled with dense collagen without a clear elastin barrier, and increased collagen levels caused LDL to preferentially bind at the branches. This study showed that mechanical considerations alone are not sufficient to understand risk of rupture and that local changes in biochemical composition must also be considered. In both of these studies, the multimodal microscopic approach was essential in elucidating these molecular assembly details that cannot be discerned by clinical imaging modalities or identified by standard histology. These methods for cardiovascular imaging could eventually be integrated into an endoscope and used in the clinic.
ii) Pathologies of the cornea
Though reflected confocal microscopy is an effective technique for imaging the corneal epithelium,38 the collagenous stroma is virtually invisible by this contrast. Furthermore, the potential for permanent injury prevents application of traditional histological procedures for diagnosing pathologies. Because the composition of corneal stroma is mostly type I collagen,39 SHG microscopy is a natural choice for label-free imaging and diagnosis of pathological degradations of this architecture in conjunction with simultaneous MAF imaging of the epithelial cells.40 In another example, Tan et al. used SHG imaging to characterize collagen disruption in infectious keratitis while simultaneously using the MAF signal for the label-free, morphological identification of infectious pathogens.41 This approach has been applied for the characterization of bacterial (Serratia marcescens), fungal (Alternaria), and protozoa/bacterial (Acanthamoeba/Pseudomonas aeruginosa) infected corneas under ex vivo conditions.
Technology improvements
The increased resolution and specificity of SHG techniques come at the expense of limited penetration depths (100–300 μm with laser excitation in the 800–1000 nm range) relative to established clinical imaging modalities (MRI, CT, PET), which typically image through several millimeters or centimeters of tissue. Though applicable to imaging ex vivo sliced samples, micrometer depths are often inadequate for in vivo applications. Though water absorption limits the biological transparency window to wavelengths < ~1.3 μm, longer wavelengths with decreased scattering are not a possible solution. Here we highlight two approaches that can be combined with SHG imaging to improve fundamental depth limitations.
Optical Clearing
A combination of SHG imaging with optical clearing42 has achieved increased image depths. 43,44 In this process, a high refractive index, hyper-osmotic reagent (e.g., glycerol, sugars, or sugar alcohols) is added to tissue such as skin, muscle, and tendon to increase transparency,42 and thus penetration depth, by several fold.
A representative result is the clearing of tendon with glycerol. Figure 5 shows the forward SHG attenuation data for the control and 50% glycerol treated tendon, which was cleared for 5 h.45 The imaging depth in each case represents the physical thickness of the tendons before and after clearing. The SHG for the uncleared tissue experiences a rapid attenuation through 100 μm, whereas the cleared tissue only decays to ~80% of the initial value at this depth. The experimental attenuation data agreed with Monte Carlo simulations based on measuring scattering coefficients and thus the increase in depth and intensity can be predicted a priori if these parameters are known. Though the optical clearing approach has not been used in vivo in humans, development of appropriate administration and washing procedures could allow clinical use.
Figure 5.
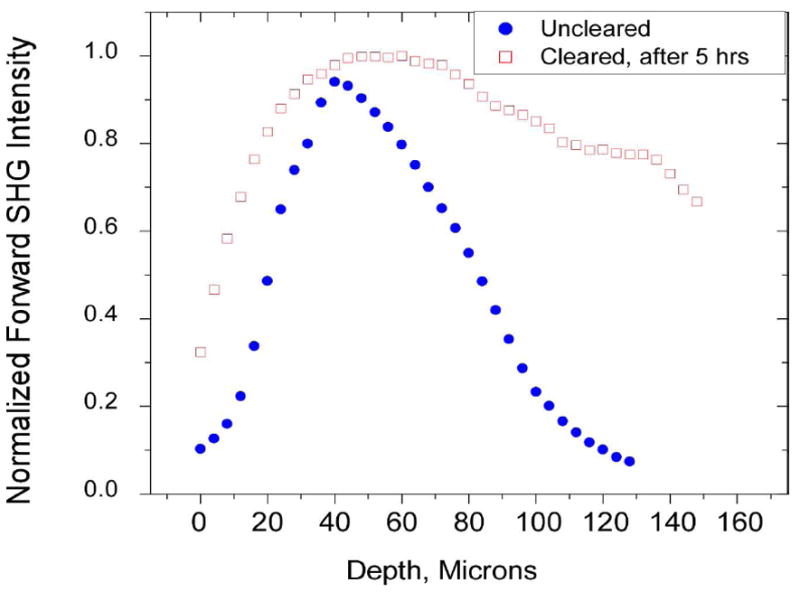
SHG imaging of optical clearing in tendon. Forward SHG attenuation data for the uncleared and cleared tendon (5 h treatment with 50% glycerol). Clearing results in increased swelling and a decrease in the rate of the axial attenuation. Integration under the curves reflects the entire SHG intensity before and after clearing, in which the SHG enhancement factor was ~2×. Reproduced from ref. 45 with permission from SPIE Publications.
Adaptive optics
All optical microscopes have aberrations that increase the focal volume of the excitation laser [Point Spread Function (PSF)] beyond that of the Abbe limit. Aberrations in the microscope optics as well as those that are induced by scattering in the specimen increase PSF (and thus decrease resolution). Such an increase is especially important for SHG (and all nonlinear optical modalities) because of the quadratic (or higher) dependence of the signal on excitation peak power. Because refractive index mismatch causes scattering, spherical aberration (resulting in uneven illumination across the field of view and blurring) decreases achievable contrast deeper into specimens. To rectify this situation, there has been recent interest in adaptive approaches to optimize the PSF in deep tissue. Adaptive optics schemes use either a multi-element micro-mirror or liquid crystal spatial light modulator to pre-compensate the incoming waveform for system and specimen induced aberrations, thereby maximizing the signal strength. This approach has now been demonstrated for CARS,46 two-photon imaging, and more recently, for SHG and THG,47 in which aberration corrections increased the signal by ~2–3 fold at depths of several hundreds of microns. Based on these successful lab-based implementations, we foresee that as the field advances, adaptive optics schemes could become part of commercial instruments.
Outlook for clinical applications/instrumentation
Significant progress has been made in establishing SHG as a viable microscopic imaging technology for biomedical applications, both in terms of exploration of its physical principles, development of the technology, and identification of practical applications. Before full practical translation to clinical applications can occur, several areas under development must improve. First, SHG imaging instrumentation needs to be user friendly and of a size compatible with clinical practices. However, “turn-key” Ti:sapphire lasers and small footprint solid state platforms at specific wavelengths are now commercially offered, and available wavelengths and power should continue to improve. These technology improvements would be immediately effective for imaging superficial regions of tissues, including skin and breast, in which SHG alone and in multimodal form have been effective in delineating normal and malignant tissues.11,31,36,48
Microendoscopy techniques are also advancing and could be integrated into standard clinical endoscopes and laparoscopes. For example, photonic crystal fibers and gradient refractive index lens (GRIN) lens technology have been combined with miniaturized scanning systems, affording true in vivo image acquisition. For example, Llewellyn et al. recently demonstrated that minimally invasive SHG microendoscopy could measure changes in sarcomere lengths in a live mouse through a stick objective (GRIN lens puncturing the tissue) inserted into the muscle.49 Li and coworkers50 developed an alternate scheme in which the distal end is scanned; this is ideal for imaging organs such as the esophagus or colon where conventional endoscopes are already used routinely in clinical imaging applications.
Hybrid systems could be developed in the near future. One possible scenario would be to use a larger area imaging modality such as optical coherence tomography to guide the higher resolution SHG probe. Otherwise, the intrinsic small field area of SHG/NLO imaging would make it impractical as a stand-alone method. Moreover, this approach would be best suited for imaging accessible tissue such as the colon and esophagus, where the lens system would be minimally invasive.
With the exciting and recent technical development of SHG imaging and its applications, the technique could become a useful diagnostic tool capable of providing real time spatial guidance for biopsies. The job will soon rest in the hands of the commercial instrument community to integrate all these pieces into a viable clinical instrument.
Acknowledgments
P. J. C. gratefully acknowledges support under NIH CA136590-01. We thank Prof. Patti Keely and Prof. Ji-Xin Cheng for providing images. We thank Kevin Eliceiri for reading the manuscript.
References
- 1.Freund I, Deutsch M, Sprecher A. Biophys J. 1986;50:693. doi: 10.1016/S0006-3495(86)83510-X. [DOI] [PMC free article] [PubMed] [Google Scholar]
- 2.Campagnola PJ, Millard AC, Terasaki M, Hoppe PE, Malone CJ, Mohler WA. Biophys J. 2002;82:493. doi: 10.1016/S0006-3495(02)75414-3. [DOI] [PMC free article] [PubMed] [Google Scholar]
- 3.Tai S-P, Tsai T-H, Lee W-J, Shieh D-B, Liao Y-H, Huang H-Y, Zhang K, Liu H-L, Sun C-K. Optics Express. 2005;13:8231. doi: 10.1364/opex.13.008231. [DOI] [PubMed] [Google Scholar]
- 4.Zoumi A, Lu X, Kassab GS, Tromberg BJ. Biophys J. 2004;87:2778. doi: 10.1529/biophysj.104.042887. [DOI] [PMC free article] [PubMed] [Google Scholar]
- 5.Yeh AT, Nassif N, Zoumi A, Tromberg BJ. Opt Lett. 2002;27:2082. doi: 10.1364/ol.27.002082. [DOI] [PubMed] [Google Scholar]
- 6.Williams RM, Zipfel WR, Webb WW. Biophys J. 2005;88:1377. doi: 10.1529/biophysj.104.047308. [DOI] [PMC free article] [PubMed] [Google Scholar]
- 7.Theodossiou TA, Thrasivoulou C, Ekwobi C, Becker DL. Biophys J. 2006;91:4665. doi: 10.1529/biophysj.106.093740. [DOI] [PMC free article] [PubMed] [Google Scholar]
- 8.Yeh AT, Choi B, Nelson JS, Tromberg BJ. J Invest Dermatol. 2003;121:1332. doi: 10.1046/j.1523-1747.2003.12634.x. [DOI] [PubMed] [Google Scholar]
- 9.Stoller P, Kim B-M, Rubinchik AM, Reiser KM, Da Silva LB. J Biomed Opt. 2001;7:205. doi: 10.1117/1.1431967. [DOI] [PubMed] [Google Scholar]
- 10.Stoller P, Reiser KM, Celliers PM, Rubinchik AM. Biophys J. 2002;82:3330. doi: 10.1016/S0006-3495(02)75673-7. [DOI] [PMC free article] [PubMed] [Google Scholar]
- 11.Lin SJ, Jee SH, Kuo CJ, Wu RJ, Lin WC, Chen JS, Liao YH, Hsu CJ, Tsai TF, Chen YF, Dong CY. Opt Lett. 2006;31:2756. doi: 10.1364/ol.31.002756. [DOI] [PubMed] [Google Scholar]
- 12.Han M, Giese G, Bille JF. Optics Express. 2005;13:5791. doi: 10.1364/opex.13.005791. [DOI] [PubMed] [Google Scholar]
- 13.Han M, Zickler L, Giese G, Walter M, Loesel FH, Bille JF. J Biomed Opt. 2004;9:760. doi: 10.1117/1.1756919. [DOI] [PubMed] [Google Scholar]
- 14.Cox G, Kable E, Jones A, Fraser I, Manconi F, Gorrell MD. J Struct Biol. 2003;141:53. doi: 10.1016/s1047-8477(02)00576-2. [DOI] [PubMed] [Google Scholar]
- 15.Pena AM, Fabre A, Debarre D, Marchal-Somme J, Crestani B, Martin JL, Beaurepaire E, Schanne-Klein MC. Microsc Res Tech. 2007;70:162. doi: 10.1002/jemt.20400. [DOI] [PubMed] [Google Scholar]
- 16.Drury JL, Mooney DJ. Biomaterials. 2003;24:4337. doi: 10.1016/s0142-9612(03)00340-5. [DOI] [PubMed] [Google Scholar]
- 17.Odin C, Le Grand Y, Renault A, Gailhouste L, Baffet G. Journal of Microscopy-Oxford. 2008;229:32. doi: 10.1111/j.1365-2818.2007.01868.x. [DOI] [PubMed] [Google Scholar]
- 18.Kwon GP, Schroeder JL, Amar MJ, Remaley AT, Balaban RS. Circulation. 2008;117:2919. doi: 10.1161/CIRCULATIONAHA.107.754614. [DOI] [PMC free article] [PubMed] [Google Scholar]
- 19.Pauling L, Corey RB. Proc Natl Acad Sci U S A. 1951;37:272. doi: 10.1073/pnas.37.5.272. [DOI] [PMC free article] [PubMed] [Google Scholar]
- 20.Nadiarnykh O, Lacomb RB, Brewer MA, Campagnola PJ. BMC Cancer. 2010;10:94. doi: 10.1186/1471-2407-10-94. [DOI] [PMC free article] [PubMed] [Google Scholar]
- 21.Deniset-Besseau A, Duboisset J, Benichou E, Hache F, Brevet PF, Schanne-Klein MC. J Phys Chem B. 2009;113:13437. doi: 10.1021/jp9046837. [DOI] [PubMed] [Google Scholar]
- 22.Plotnikov SV, Millard AC, Campagnola PJ, Mohler WA. Biophys J. 2006;90:693. doi: 10.1529/biophysj.105.071555. [DOI] [PMC free article] [PubMed] [Google Scholar]
- 23.Rocha-Mendoza I, Yankelevich DR, Wang M, Reiser KM, Frank CW, Knoesen A. Biophys J. 2007;93:4433. doi: 10.1529/biophysj.107.111047. [DOI] [PMC free article] [PubMed] [Google Scholar]
- 24.Lacomb R, Nadiarnykh O, Campagnola PJ. Biophys J. 2008;94:4104. doi: 10.1529/biophysj.107.114405. [DOI] [PMC free article] [PubMed] [Google Scholar]
- 25.Nadiarnykh O, Plotnikov S, Mohler WA, Kalajzic I, Redford-Badwal D, Campagnola PJ. J Biomed Opt. 2007;12:051805. doi: 10.1117/1.2799538. [DOI] [PubMed] [Google Scholar]
- 26.Lacomb R, Nadiarnykh O, Townsend SS, Campagnola PJ. Optics Comm. 2008;281:1823. doi: 10.1016/j.optcom.2007.10.040. [DOI] [PMC free article] [PubMed] [Google Scholar]
- 27.Prockop DJ, Fertala A. Journal of Structural Biology. 1998;122:111. doi: 10.1006/jsbi.1998.3976. [DOI] [PubMed] [Google Scholar]
- 28.Strupler M, Pena AM, Hernest M, Tharaux PL, Martin JL, Beaurepaire E, Schanne-Klein MC. Optics Express. 2007;15:4054. doi: 10.1364/oe.15.004054. [DOI] [PubMed] [Google Scholar]
- 29.Sun WX, Chang S, Tai DCS, Tan N, Xiao GF, Tang HH, Yu H. Journal of Biomedical Optics. 2008;13:064010. doi: 10.1117/1.3041159. [DOI] [PubMed] [Google Scholar]
- 30.Provenzano PP, Inman DR, Eliceiri KW, Knittel JG, Yan L, Rueden CT, White JG, Keely PJ. BMC Med. 2008;6:11. doi: 10.1186/1741-7015-6-11. [DOI] [PMC free article] [PubMed] [Google Scholar]
- 31.Provenzano PP, Eliceiri KW, Campbell JM, Inman DR, White JG, Keely PJ. BMC Med. 2006;4:38. doi: 10.1186/1741-7015-4-38. [DOI] [PMC free article] [PubMed] [Google Scholar]
- 32.Wang M, Reiser KM, Knoesen A. J Opt Soc Am A. 2007;24:3573. doi: 10.1364/josaa.24.003573. [DOI] [PubMed] [Google Scholar]
- 33.Roy HK, Turzhitsky V, Kim YL, Goldberg MJ, Muldoon JP, Liu Y, Brand RE, Hall C, Hasabou N, Jameel M, Backman V. Dis Colon Rectum. 2008;51:1381. doi: 10.1007/s10350-008-9384-3. [DOI] [PMC free article] [PubMed] [Google Scholar]
- 34.Tan HY, Sun Y, Lo W, Lin SJ, Hsiao CH, Chen YF, Huang SC, Lin WC, Jee SH, Yu HS, Dong CY. Invest Ophthalmol Vis Sci. 2006;47:5251. doi: 10.1167/iovs.06-0386. [DOI] [PubMed] [Google Scholar]
- 35.Debarre D, Supatto W, Pena AM, Fabre A, Tordjmann T, Combettes L, Schanne-Klein MC, Beaurepaire E. Nat Methods. 2006;3:47. doi: 10.1038/nmeth813. [DOI] [PubMed] [Google Scholar]
- 36.Cicchi R, Massi D, Sestini S, Carli P, De Giorgi V, Lotti T, Pavone FS. Optics Express. 2007;15:10135. doi: 10.1364/oe.15.010135. [DOI] [PubMed] [Google Scholar]
- 37.Le TT, Langohr IM, Locker MJ, Sturek M, Cheng JX. Journal of Biomedical Optics. 2007;12 doi: 10.1117/1.2795437. [DOI] [PMC free article] [PubMed] [Google Scholar]
- 38.Masters BR, Bohnke M. Annual Review of Biomedical Engineering. 2002;4:69. doi: 10.1146/annurev.bioeng.4.092701.132001. [DOI] [PubMed] [Google Scholar]
- 39.Forrester JV. The eye : basic sciences in practice. 2. W.B. Saunders; Edinburgh ; New York: 2002. [Google Scholar]
- 40.Matteini P, Ratto F, Rossi F, Cicchi R, Stringari C, Kapsokalyvas D, Pavone FS, Pini R. Optics Express. 2009;17:4868. doi: 10.1364/oe.17.004868. [DOI] [PubMed] [Google Scholar]
- 41.Tan HY, Sun Y, Lo W, Teng SW, Wu RJ, Jee SH, Lin WC, Hsiao CH, Lin HC, Chen YF, Ma DH, Huang SC, Lin SJ, Dong CY. J Biomed Opt. 2007;12:024013. doi: 10.1117/1.2717133. [DOI] [PubMed] [Google Scholar]
- 42.Tuchin VV. Journal of Physics D-Applied Physics. 2005;38:2497. [Google Scholar]
- 43.Plotnikov S, Juneja V, Isaacson AB, Mohler WA, Campagnola PJ. Biophys J. 2006;90:328. doi: 10.1529/biophysj.105.066944. [DOI] [PMC free article] [PubMed] [Google Scholar]
- 44.Hirshburg JM, Choi B, Nelson JS, Yeh AT. Lasers in Surgery and Medicine. 2006;1 doi: 10.1002/lsm.20417. [DOI] [PubMed] [Google Scholar]
- 45.LaComb R, Nadiarnykh O, Carey S, Campagnola PJ. J Biomed Opt. 2008;13:021108. doi: 10.1117/1.2907207. [DOI] [PubMed] [Google Scholar]
- 46.Wright AJ, Poland SP, Girkin JM, Freudiger CW, Evans CL, Xie XS. Optics Express. 2007;15:18209. doi: 10.1364/oe.15.018209. [DOI] [PubMed] [Google Scholar]
- 47.Rueckel M, Mack-Bucher JA, Denk W. Proceedings of the National Academy of Sciences of the United States of America. 2006;103:17137. doi: 10.1073/pnas.0604791103. [DOI] [PMC free article] [PubMed] [Google Scholar]
- 48.Cicchi R, Kapsokalyvas D, De Giorgi V, Maio V, Van Wiechen A, Massi D, Lotti T, Pavone FS. J Biophotonics. 2010;3:34. doi: 10.1002/jbio.200910062. [DOI] [PubMed] [Google Scholar]
- 49.Llewellyn ME, Barretto RP, Delp SL, Schnitzer MJ. Nature. 2008;454:784. doi: 10.1038/nature07104. [DOI] [PMC free article] [PubMed] [Google Scholar]
- 50.Wu YC, Leng YX, Xi JF, Li XD. Optics Express. 2009;17:7907. doi: 10.1364/oe.17.007907. [DOI] [PMC free article] [PubMed] [Google Scholar]