Abstract
Inferior olive (IO) neurons project to the cerebellum and contribute to motor control. They can show intriguing spatio-temporal dynamics with rhythmic and synchronized spiking. IO neurons are connected to their neighbors via gap junctions to form an electrically coupled network, and so it is considered that this coupling contributes to the characteristic dynamics of this nucleus. Here, we demonstrate that a gap junction-coupled network composed of simple conductance-based model neurons (a simplified version of a Hodgkin–Huxley type neuron) reproduce important aspects of IO activity. The simplified phenomenological model neuron facilitated the analysis of the single cell and network properties of the IO while still quantitatively reproducing the spiking patterns of complex spike activity observed by simultaneous recording in anesthetized rats. The results imply that both intrinsic bistability of each neuron and gap junction coupling among neurons play key roles in the generation of the spatio-temporal dynamics of IO neurons.
Keywords: Inferior olive, cerebellum, gap junction, synchronization, bifurcation analyses
1. Introduction
The axons of inferior olive (IO) neurons end as climbing fibers on cerebellar Purkinje cells, whose axons in turn comprise the only output from the cerebellar cortex. Each Purkinje cell receives input from only one climbing fiber, and activation of its climbing fiber evokes a high frequency burst of action potentials, known as a complex spike (CS) in the Purkinje cell [Eccles et al., 1966]. IO neurons fire (and therefore CSs occur) at a very low average rate of about 1 Hz. CS activity is also characterized by a transient rhythmicity with about 10 Hz and a tendency for synchronization [Lang et al., 1999; Sasaki et al., 1989]. CS activity has been hypothesized to play such roles in motor control as contributing to the timing of motor commands [Welsh et al., 1995] and relaying an error detection signal [Kawato & Gomi, 1992; Schweighofer et al., 1998]; however, its exact roles remain a controversial subject in part because of the unusual firing properties just described. Moreover, these characteristics of olivocerebellar activity, namely, rhythmicity and synchronicity, should be incorporated into the various hypotheses concerning the roles of the IO in motor control and cerebellar learning, but typically are not.
Understanding the mechanisms by which rhythmic and synchronous CS activity patterns are generated may aid in remedying this situation, yet these mechanisms have only begun to be explored. Synchronous CS activity was proposed to be due to gap junction-mediated electrical coupling between IO neurons [Llinas et al., 1974]. Evidence strongly supporting this hypothesis has been obtained recently [Blenkinsop & Lang, 2006; Lang, 2001; Marshall et al., 2007]. In contrast, the low firing rate and rhythmicity of CSs are thought to originate from the intrinsic properties of IO neurons [Llinas & Yarom, 1981a, 1981b], particularly because rhythmic activity can also be observed at a subthreshold level in neurons in slices of the IO [Bal & McCormick, 1997; Benardo & Foster, 1986; Llinas & Yarom, 1986]. However, gap junction coupling may contribute to the firing rates of IO neurons [Blenkinsop & Lang, 2006], and also may be required for rhythmic IO activity, but this still remains a controversial issue [Bleasel & Pettigrew, 1992; Blenkinsop & Lang, 2006; Lampl & Yarom, 1997; Leznik & Llinas, 2005; Llinas & Yarom, 1986; Long et al., 2002; Manor et al., 1997; Marshall et al., 2007; Placantonakis et al., 2006]. Indeed, little is known about how gap junction coupling interacts with the other membrane conductances of the neurons to give rise to the dynamics of IO activity.
Mathematical modeling may be useful for exploring the underlying mechanisms of the spatio-temporal dynamics of IO neurons, but selection of a proper model is a key issue. One approach to studying neuronal dynamics is to focus on the structural and physiological details of individual neurons, as is, for example, done in building multicompartment models of neurons based on dynamics of different kinds of ion channels and dendritic tree structures. Such physiologically realistic models replicate the details of the activity of individual neurons. However, such models require solving high-dimensional systems of equations, and when trying to simulate a network of cells, it can be hard to define the underlying dynamics that are displayed by such models. Another approach is to simplify the individual model neurons, but still have a network that displays the core features of the activity of the modeled system. Two-variable conductance-based models, which have been well investigated, are often suitable for this purpose [Izhikevich, 2006].
In previous modeling studies of IO neurons, the subthreshold oscillation that these cells display has been replicated using two-variable models [Manor et al., 1997]. In addition, several spiking patterns can be realized using a two-compartment (soma and dendrite) model of an IO neuron [Schweighofer et al., 1999]. However, neuronal gap junction density in the IO is among the highest in the adult CNS [Belluardo et al., 2000; Condorelli et al., 1998], and thus electrical coupling is likely to be a key factor for determining the dynamics of IO neuronal activity. Here, we show that a system composed of simple two-variable conductance-based model neurons coupled by gap junctions quantitatively reproduces the spatio-temporal dynamics of CS activity that was recorded from multiple Purkinje cells simultaneously. Furthermore, phase plane and bifurcation analyses demonstrated that the model IO network has intrinsic bistability, which suggests that this property may play a key role in shaping the characteristic activity of IO neurons.
2. Methods
2.1. Experimental data
The data used to constrain the quantitative modeling were simultaneous recordings of CS activity from crus 2a Purkinje cells in anesthetized adult female Sprague–Dawley rats. Because each CS in a Purkinje cell is evoked by the firing of a single IO neuron and each IO discharge causes a CS, the firing of IO neurons can be represented by that of CSs in Purkinje cells. One should note that spontaneous CS activity patterns under ketamine-xylazine anesthesia are similar to those in awake animals, so the system appears to be operating within its normal physiological range [Lang et al., 1999].
Recording procedures
Experiments involving animals were carried out in accordance with the National Institutes of Health guidelines for the care and use of laboratory animals. Experimental protocols were approved by the IACUC committee of New York University School of Medicine. Detailed descriptions of the surgical and recording procedures have already been published [Sasaki et al., 1989]. In brief, Sprague–Dawley rats (225–300 gm) were anesthetized with an intraperitoneal injection of ketamine (100 mg/kg) and xylazine (8 mg/kg). Supplemental anesthetic doses were given to prevent spontaneous and reflex movements. Rectal temperature was maintained at 36–37°C by an electric heating pad. Animals were mechanically ventilated, and given supplemental oxygen when necessary. Following anesthetization, the bone, dura, and overlying tissues were removed to expose the cerebellar cortex, which was then covered by a platform that allowed access to lobule crus 2a. Glass micro-electrodes (~1 MΩ) were inserted through the platform and into the cerebellar cortex using a joy-stick-controlled piezoelectric micromanipulator (Burleigh Instruments, NY). Each micro-electrode was positioned to record CS activity from a single Purkinje cell. The data used in this paper were collected in two experiments using either a 6 × 4 or 10 × 4 (mediolateral × rostrocaudal) rectangular array of electrodes, with an inter-electrode spacing of 250 μm. In one experiment 16 of 24 electrodes showed well-isolated CS activity, and in the other 22 of 40 electrodes did. CSs were viewed on an oscilloscope, and their times of occurrence were recorded using a multichannel amplifier system (1000× gain, 6 kHz per channel sampling rate) with a single voltage level threshold. Following electrode implantation, a control recording of spontaneous CS activity was obtained. Next, an injection pipette was lowered to the IO and either a pressure injection of picrotoxin (1 mg/mL in Ringers or saline, ~1 μL/min) or carbenoxolone (500 μM in Ringers, 0.1 μL/min) was made.
2.2. Statistical analyses
To ensure that the model was robust, that is, to increase the likelihood that its dynamics would reflect some general principles of the IO rather than the dynamics of a particular condition, the model was required to reproduce the spatio-temporal dynamics of the olivocerebellar system under three different conditions (four experimental data sets): before (control) and after an injection of picrotoxin, a gamma-aminobutyric acid-A (GABAA) antagonist, and before (control) and after an injection of carbenoxolone, a gap junction antagonist that blocks electrical coupling of IO neurons. The data from the injections of picrotoxin and the carbenoxolone were collected in separate experiments.
To assess how closely the simulated data produced by the model and the experimental data correspond, both were characterized using several measures of population activity, including population auto- and cross-correlograms, and the minimal distance distribution, which are described below.
2.2.1. Population auto- and cross-correlograms
To generate population correlograms, auto- or cross-correlograms were calculated for all neurons and pairs of neurons, respectively, and then averaged. The mean and standard deviation of each histogram bin was determined using the appropriate population (all neurons and all cell pairs). Population auto- and cross-correlograms were then obtained from these average correlograms by normalizing the latter such that the sum of all bins in a correlogram equaled unity.
2.2.2. Minimal distance distribution
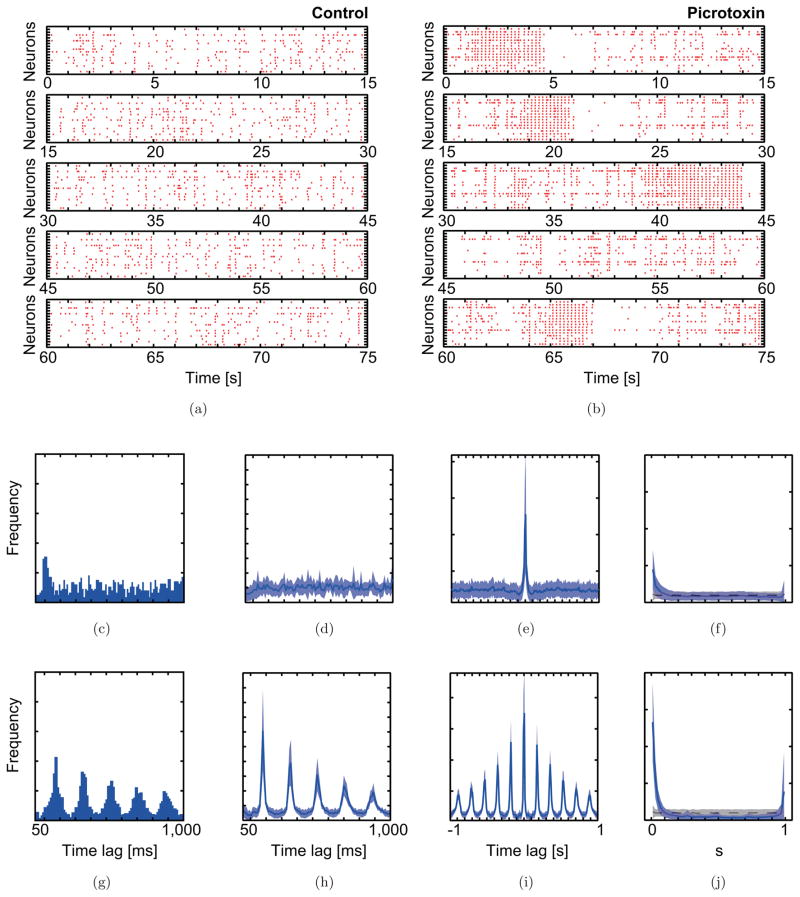
To visualize the difference between the spike data and a random process, the minimal distance distribution was used [Figs. 1(f), 1(j), 2(f) and 2(j)]. The minimal distance between the kth spike of neuron i and a spike of neuron j is given as follows:
| (1) |
where is the k is the kth spike time of neuron i; d̄j mean interspike interval of neuron j; and m runs from 1 to the total number of spikes by neuron j. If spike k is synchronous with a spike in neuron j, the quantity equals zero. If the minimal interval between spike k and any spike in neuron is large relative to d̄j, the quantity will be close to one. Note that is normalized so that if the spike sequence is a random process (Poisson point process), then will be distributed uniformly between 0 and 1. Thus, the difference from the uniform distribution can be regarded as that from a Poisson process.
Fig. 1.
Spiking patterns of rat CS activity and statistical distributions that characterize the CS activity in the picrotoxin experiment. Raster plots of CS activity simultaneously recorded from 16 Purkinje cells before (a) and after (b) the injection of picrotoxin. In each plot, the vertical axes represent neurons, and the horizontal axes represent time. Each red dot indicates the time of a CS, and each row in the raster shows the CSs of one Purkinje cells. Typical 75 s durations are shown. Statistical distributions illustrate the characteristic CS activity before (c)–(f) and after (g)–(j) picrotoxin injection. (c, g) Auto-correlograms of CS activity from a typical Purkinje cell before and after picrotoxin injection. (d–f and h–j) show 16-channel averaged statistics of (d, h) auto-, (e, i) cross-correlograms, and (f, j) minimal distance distributions. The standard deviations are indicated with light blue bands. In the case of random spiking (the Poisson point process), the minimal distance distribution should be flat at the level indicated by the black dotted line and gray bar (mean +/− SD).
Fig. 2.
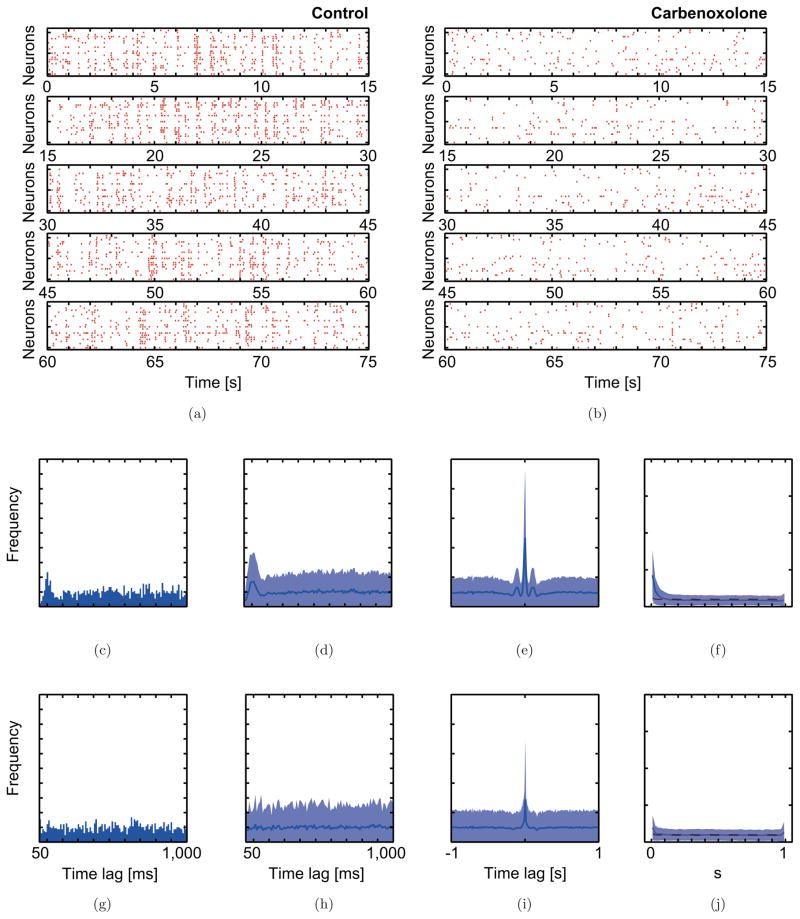
Spiking patterns of rat CS activity and statistical distributions that characterize the CS activity in the carbenoxolone experiment. Raster plots of CS activity simultaneously recorded from 22 Purkinje cells before (a) and after (b) the injection of carbenoxolone. Statistical distributions illustrate the characteristic CS activity before (c)–(f) and after (g)–(j) carbenoxolone injection. (c, g) Auto-correlograms of CS activity from a typical Purkinje cell before and after carbenoxolone injection. (d–f and h–j) show 22-channel averaged statistics of (d, h) auto-, (e, i) cross-correlograms, and (f, j) minimal distance distributions.
The statistical measures described below were used for assessing the effect of varying the parameters of the model on basic characteristics of CS activity, namely firing rates, synchrony and rhythmicity.
In the present paper, the following measure of rhythmicity was defined. Suppose that {T1, T2, …, Tn} is a consecutive sequence of inter-spike intervals, then the rhythmicity of that cell is defined as follows:
| (2) |
where the second term is the local variance which is known as a measure of irregularity [Shinomoto et al., 2005]. When rhythmic activity occurs, successive interspike intervals are equal or nearly so. In the case of a highly rhythmic cell, many of the terms in the summation will be equal to or close to zero, and the rhythmicity value will approach unity. In contrast, if the spike sequence is a Poisson random point process, the rhythmicity will equal to zero.
To quantify the degree of synchrony, we computed a correlation coefficient of spike trains [Lang et al., 1996]. The spike train of the ith neuron was represented xi(k), where k represents the time step (k = 1, 2, …, K). xi(k) = 1 if the CS occurred in the kth time bin, otherwise xi(k) = 0. We set the bin width to be 10 ms. The synchrony between neuron i and neuron j was calculated as
| (3) |
where yi(k) is the normalized form of xi(k):
| (4) |
2.3. The model
We simulated an IO-like network by creating a model consisting of electrically-coupled simplified neuronal elements. Each neuron was modeled as a simple two-variable conductance-based element, which nevertheless could generate many of the features of single neurons [Izhikevich, 2006]. The model can be viewed as a reduced Hodgkin–Huxley (HH) model [Hodgkin & Huxley, 1952]. In their pioneering work, Hodgkin and Huxley found that the neuronal dynamics of a squid giant axon could be well described with three main currents: an ohmic leak current and voltage-gated sodium and potassium currents, the latter two of which depolarize and hyperpolarize the membrane potential, respectively. They showed that the nonlinear dynamics of these currents allows for the generation of action potentials by the model axon. The HH model includes four variables: the membrane potential and three variables related to ion channel activation and inactivation. In contrast, the present model uses two variables: the membrane potential V and the activation of an ion channel n. These variables are governed by the following equations [Izhikevich, 2006]:
| (5) |
| (6) |
where C = 1 μF/cm2 is the membrane capacitance; gL, gD and gH are the conductances of ion channels for the leak, depolarizing and hyperpolarizing currents, respectively; and EL, ED and EH are the corresponding reversal potentials. We choose the following parameters so that the model shows a sub-critical Hopf bifurcation and that these parameters are in biologically plausible range [Schweighofer et al., 1999]. For the second term on the right-hand side of Eq. (5), we set gL = 0.05 mS/cm2 and EL = −78 mV for the leak current. For the third term, we set gD = 0.05 mS/cm2 and ED = 120 mV for the depolarizing current. The function m(V) depends on V and represents the level of activation of the depolarizing current. The activation of the voltage-dependent channel is represented as
| (7) |
This activation curve is specified with V1 = −60 mV and V2 = 5 mV. We set gH = 0.2 mS/cm2 and EH = −100 mV for the hyperpolarizing current. The dynamics of n is specified with a time constant τn and a steady state function n∞(V ) defined as
| (8) |
where we set V3 = −70 mV and V4 = 5 mV.
Using this neuron model as a basic building block, we constructed a network of 25 neurons coupled with gap junctions as a model of the IO system. Each neuron is driven by an external input and three types of currents as follows.
| (9) |
where Vi is the membrane potential of the ith neuron. The activation dynamics of the hyperpolarizing channel of the ith neuron ni is represented by the following equation:
| (10) |
The external current consists of the constant current I0, the fluctuating input ξi(t), and the current induced with the gap junctions as follows:
| (11) |
The IO is innervated both by excitatory terminals, derived from either ascending or descending inputs, and by inhibitory GABAergic terminals, derived mainly from the cerebellar nuclei [Nelson & Mugnaini, 1989; Sotelo et al., 1986]. Both the excitatory and inhibitory terminals can be divided into two classes based on their site of termination on IO neurons. Roughly half of the terminals (both excitatory and inhibitory) synapse onto the main dendrites or soma [de Zeeuw et al., 1989]. Such synapses are likely to affect the overall excitability of an IO neuron. Thus, the effects of this first class of synapses (those onto the main dendrites and soma) were modeled by the constant and variable input currents, I0 and ξi(t), where I0 was applied equally to all neurons, and ξi(t) was generated using Gaussian white noise with standard deviation σ, and was applied to each neuron independently at every integration time step of 0.05 ms. Note that by using a single parameter, I0, for the level of constant synaptic input, we are treating loss of inhibition as equivalent to an increase in excitatory synaptic input.
The other approximately half of the IO terminals synapse onto the dendritic spines adjacent to gap junctions that connect the spines of neighboring IO neurons [de Zeeuw et al., 1989; Sotelo et al., 1986], as shown schematically in Fig. 3(a). These synapses, because of their locations, are typically thought to affect primarily the effective coupling between IO neurons. This modulation in effective electrical coupling is not due to the transmitter acting directly on the gap junction itself, but rather due to the increase in conductance of the spine membrane adjacent to the gap junction [Llinas et al., 1974]. By changing the conductance of the spine membrane, these synapses will selectively alter the amount of current flowing across a specific gap junction without significantly altering the overall membrane properties of the cell. Thus, particularly in terms of the phenomenological model used in this paper, modulating the conductance of the spine membrane will have an equivalent but inverse effect on electrical coupling as modulating the gap junction conductance directly. That is, an increase in spine membrane conductances by transmitter release would be equivalent to reducing the gap junction conductance: in both cases, a smaller fraction of the current will flow across the gap junction and therefore there will be a decrease in electrical coupling between the cells connected by the gap junction.
Fig. 3.
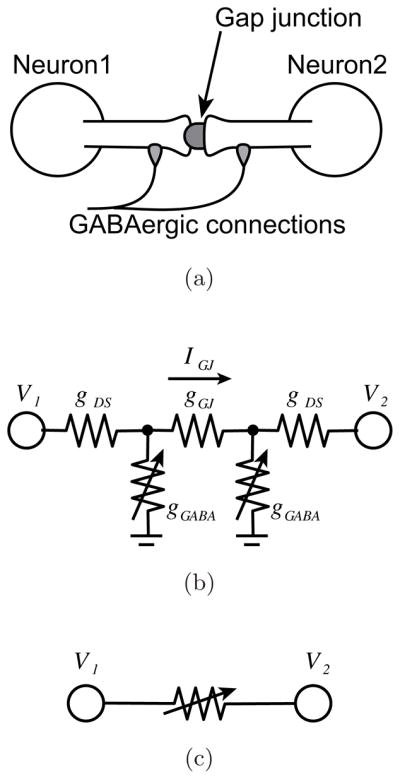
Gap junction coupled IO neurons and an effective conductance. (a) IO neurons are coupled via a gap junction, which locates on the spine membrane at the edge of the dendritic shaft. GABAergic synapses are connected on the dendritic shaft. The pircrotoxin injection modulates the GABAergic conductance and leads change on the current flow on the dendritic shaft. (b) The equivalent circuit model of this gap junction coupled IO neurons. V1 and V2 are the membrane potential of each neuron. gGABA, gGJ, and gDS indicate conductances of the GABAergic synapses, the gap junction, and the dendritic shafts. The conductance of GABAergic synapses gGABA varies with the picrotoxin injection, and leads to a change on the current flow on the gap junction IGJ. (c) Simplified equivalent circuit that we used in the present model.
In order to model the electrical coupling via gap junctions in IO, we assumed that each neuron is randomly coupled to other neurons with a probability of 20%, and that for a given experimental condition (control, picrotoxin, carbenoxolone), the effective conductance of the connection, gG, is the same for all cell pairs that are coupled. Thus, the summation in Eq. (11) runs over all gap junction-coupled neurons, and the magnitude of the current flowing between two cells was determined from their potential difference and the effective conductance between them.
To approximately estimate the effective coupling conductance between two IO neurons, the equivalent circuit shown in Fig. 3(b) was used as a model of two IO neurons coupled via the gap junction between two dendritic spines on which GABAergic synapses are formed. If gGABA, gGJ and gDS are conductances of the GABAergic synapses, the gap junction, and the dendritic spines respectively, the current IGJ and effective conductance, gG, between two neurons are described as follows:
| (12) |
According to this equation, it can be seen that picrotoxin increases the effective conductance gG between the two neurons by decreasing gGABA, the conductance due to the GABAergic synapses on the spine membrane. In contrast, carbenoxolone reduces the effective conductance gG by directly decreasing the conductance of the gap junction gGJ. Although the mechanisms by which these drugs act are distinct, the functional effects in terms of the coupling strength in IO network are opposite (i.e. opposite changes in the effective coupling conductance between two neurons). Thus, for the sake of simplicity, we replaced the equivalent circuit in Fig. 3(b) by an approximate circuit model shown in Fig. 3(c), in which a single element represents the effective coupling conductance between two IO neurons.
2.4. Parameter estimation
The parameters were determined so that the model quantitatively reproduced the experimental spiking pattern. The unknown parameters that were estimated are the magnitude of the constant input, I0; the intensity of fluctuating input, σ; and the effective conductance of gap junction, gG. Although, one of our interests was to evaluate how the injection of picrotoxin or carbenoxolone affected these parameters, we also wanted to estimate the time constant, τn, which is highly sensitive to the periodicity of the neuronal firing. Therefore, the estimation procedure was first done by using a dataset which showed more periodic activity in each experiment: the picrotoxin dataset in the picrotoxin experiment and the control dataset in the carbenoxolone experiment. Then τn was fixed to keep the periodicity, and the values of the other parameters were estimated again, using the less periodic dataset.
To obtain a criterion for the goodness of the parameter estimation, we used the following statistics of the spiking patterns: the firing rate, the minimal distance distribution, and the auto- and cross-correlogram distributions. The estimation was performed by minimizing the differences of these statistics between the experimental data and the simulation result as follows. The summed difference function, Dtotal, consisted of four terms, each of which is based on the statistics of the spiking patterns:
| (13) |
The first term DMD is the mean square error (MSE) of the minimal distance distribution. The second and third terms are the MSEs of the auto- and cross-correlograms. The quantity DFR is the difference of mean firing rates divided by the mean experimental firing rate, DFR = |fmodel − fdata|/fdata, where fmodel and fdata are the mean firing rates of the simulated neurons and that of the experimentally recorded cells, respectively. ρ is a coefficient that weights the contribution of DFR. We choose ρ = 1 × 10⁻⁴ so that the amount and change of DFR are nearly equal to those of other distances. In order to minimize Dtotal, the Nealder–Mead method [Nelder & Mead, 1965] was used. The duration of the simulation was set as 1000 s.
3. Results
3.1. Population statistics of the experimental data
The effects of picrotoxin and carbenoxolone on CS activity have been reported previously. Picrotoxin was shown to increase the CS firing rate, synchrony, and rhythmicity [Lang, 2002; Lang et al., 1996]. Carbenoxolone had much the opposite effect, reducing the CS firing rate, synchrony and rhythmicity [Blenkinsop & Lang, 2006]. Here, the data from the two experiments that were part of those studies were analyzed using the statistical measures of population activity that were described in Methods (Sec. 2.2).
The patterns of CS activity in the picrotoxin experiment are illustrated in raster displays in Fig. 1. The spiking pattern of the control condition has a mean firing rate of 1.13 ± 0.67 Hz, typical of CS activity. Significant correlations do exist for the activity of some cell pairs, particularly those pairs in which both cells are located within the same rostro-caudally running strip of cortex [Lang et al., 1999; Sasaki et al., 1989], but such correlations are hard to detect in the raster format [Fig. 1(a)], because the activity of most cells are not correlated. After picrotoxin injection, the average firing rate (2.09 ± 1.10 Hz), synchrony, and rhythmicity all increased significantly, and correlated activity among the cells is easily observable in the picrotoxin rasters. Further, the CS activity shows a pattern of switching between a rhythmic synchronous spiking state and a desynchronized state [Fig. 1(b)].
The picrotoxin-induced changes in CS activity can be demonstrated more clearly by using statistical distributions that characterize the spiking patterns [Figs. 1(c)–1(j)]. Auto-correlograms of a typical cell recorded before and after picrotoxin injection are shown in Figs. 1(c) and 1(g). The preinjection auto-correlogram shows one peak at ~100 ms, which is indicative of the tendency of CS rhythmicity to occur at a frequency of about 10 Hz. Picrotoxin injection greatly enhanced the rhythmicity, which is indicated by the many peaks in the auto-correlogram, and lengthened the oscillation period to ~ 180 ms.
In the case of this dataset, the preinjection population auto-correlogram [Fig. 1(d)] does not show a prominent peak at ~ 100 ms, which partly reflects a relatively low rhythmicity in this set of cells, but also that Purkinje cells at different cortical locations display CS activity with somewhat different oscillation frequencies [Sasaki et al., 1989], leading to smearing of the peaks in the single cell autocorrelograms into a shallow, indistinct, and broad hump in the population autocorrelogram. After picrotoxin injection, however, the population autocorrelogram shows multiple peaks, which reflect both an increase in the rhythmicity of individual cells and a greater uniformity of the oscillation frequencies across the population [Fig. 1(h)]. The preinjection population cross-correlogram [Fig. 1(e)] had a peak at 0 ms, indicating synchronous CS activity among at least some Purkinje cells. Injection of picrotoxin into the IO greatly enhanced the level of synchrony [Fig. 1(i)].
The effect of picrotoxin was also apparent using the MDD statistic. In the control condition, most of the distribution for the CS activity is flat, however, the bins near zero are higher than the baseline, which indicates the existence of synchronization at higher than chance levels among at least some of the cells. In the picrotoxin condition, the zero and neighboring bins in the minimal distance distribution are much higher than the baseline or than the corresponding values for the control condition, consistent with previous correlational analyses showing increased synchronization of CS activity following injection of picrotoxin [Lang, 2002; Lang et al., 1996]. Surprisingly, under picrotoxin there is also an increase in the height of the bins at the upper end of the distribution, leading to a bimodal distribution. This second peak indicates that desynchronized states (i.e. less simultaneous spikes than expected by chance) also occurred. Thus, in the picrotoxin condition, CS activity seems to cycle between synchronous and asynchronous states, as can be seen in the raster plot [Fig. 1(b)]. It will be shown below that the model can reproduce both the changes in the correlograms and in the MDD distribution (unimodal to bimodal) that were induced by picrotoxin.
Statistical analysis of the spiking pattern of the control condition in the carbenoxolone experiment, like the control condition of the picrotoxin experiment, showed that synchronous spiking was limited to a few cell pairs, and that CS activity had a mean firing rate of 1.02 ± 0.70 Hz [Figs. 1, 2(c)–2(f)]. After injection of carbenoxolone, the mean firing rate (0.58 ± 0.43 Hz), synchrony levels, and rhythmicity all decreased significantly [Figs. 2(b), 2(g)–2(j)]. Specifically, the number and height of the peaks in auto- and cross-correlograms and in the minimal distance distribution all are decreased by carbenoxolone. This suggests that gap junction coupling is important for both the rhythmicity and synchrony of CS activity.
3.2. Matching of simulated data and parameter estimation of the model
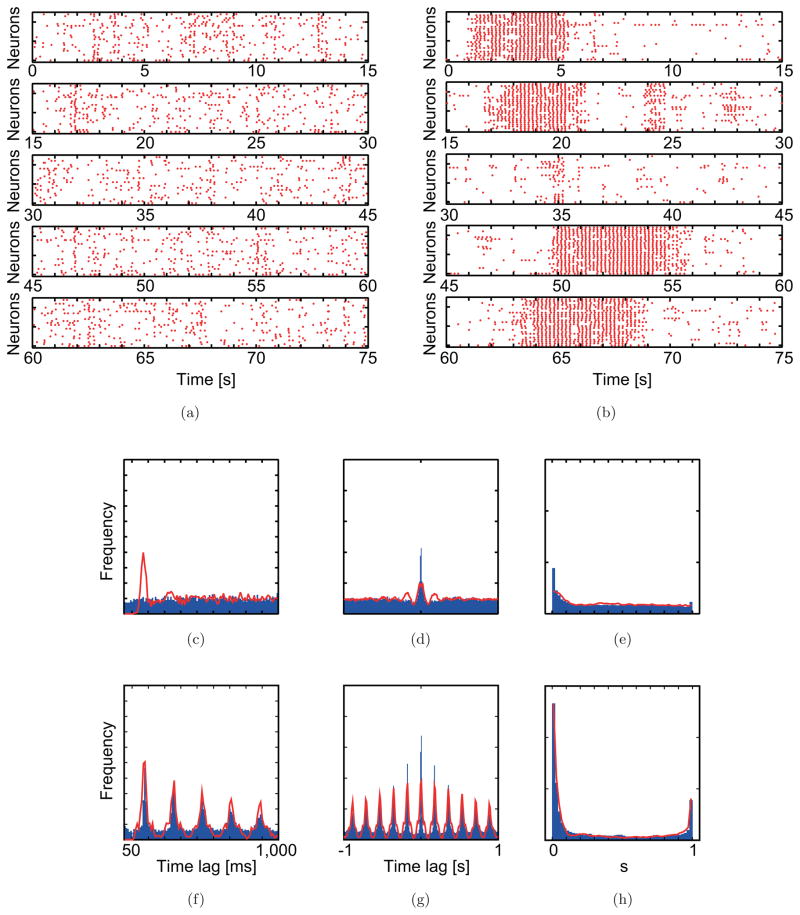
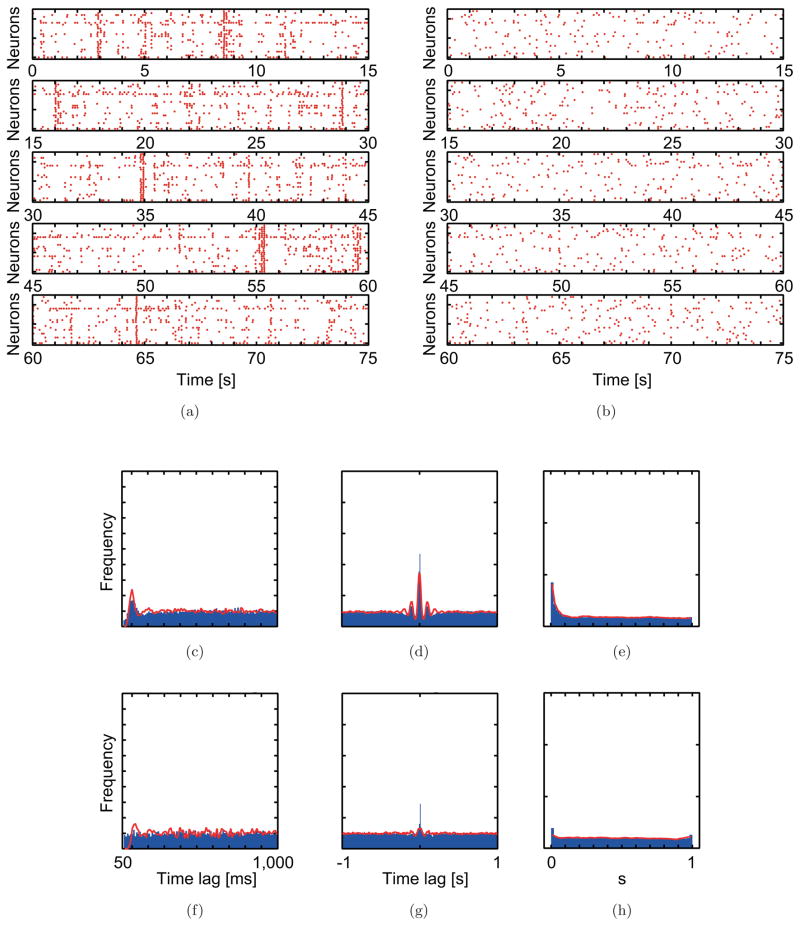
Figures 4 and 5 show that the model behavior with the estimated parameter values found by minimizing Dtotal reproduces the patterns shown by the experimental data in each experimental condition. For example, in control, the spikes of most neurons in the network are uncorrelated, with only a limited number of cells showing synchronous CS activity [Figs. 4(a) and 5(a)], whereas in the simulation of the picrotoxin condition, the model generates activity that switches between a rhythmic synchronously spiking state and an asynchronously spiking state [Fig. 4(b)].
Fig. 4.
Simulation results obtained using optimized parameter values reproduce the spiking pattern of CS activity before (a and c–e) and after (b and f–g) picrotoxin injection. In the raster plots (a, b), the vertical axes of each plot indicate an index of 25 neurons. The horizontal axes indicate time. Each dot indicates the time of a CS. Typical 75s durations are shown. In the statistical distribution plots, blue bars and red curves show experimental and simulation data, respectively. (c, f) Averaged auto-correlograms. (d, g) Averaged cross-correlograms. (e, h) The minimal distance distributions.
Fig. 5.
Simulation results obtained using optimized parameter values reproduce the spiking pattern of CS activity before (a and c–e) and after (b and f–g) carbenoxolone injection. (a, b) Raster plots. (c, f) Averaged auto-correlograms. (d, g) Averaged cross-correlograms. (e, h) The minimal distance distributions.
The population statistical distributions generated from the model data are in good agreement with those from the experimental data, except for the control population autocorrelogram in the picrotoxin experiment [Figs. 4(c)–4(h) and 5(c)–5(h)]. In this one exception, the model population autocorrelogram had a primary peak that was absent from the autocorrelogram from the experimental data [Fig. 4(c)]; however, as already mentioned, the absence of the peak in the control population autocorrelogram from the experimental data is unusual in that a peak is often observed, as in the control population autocorrelogram from the carbenoxolone experiment.
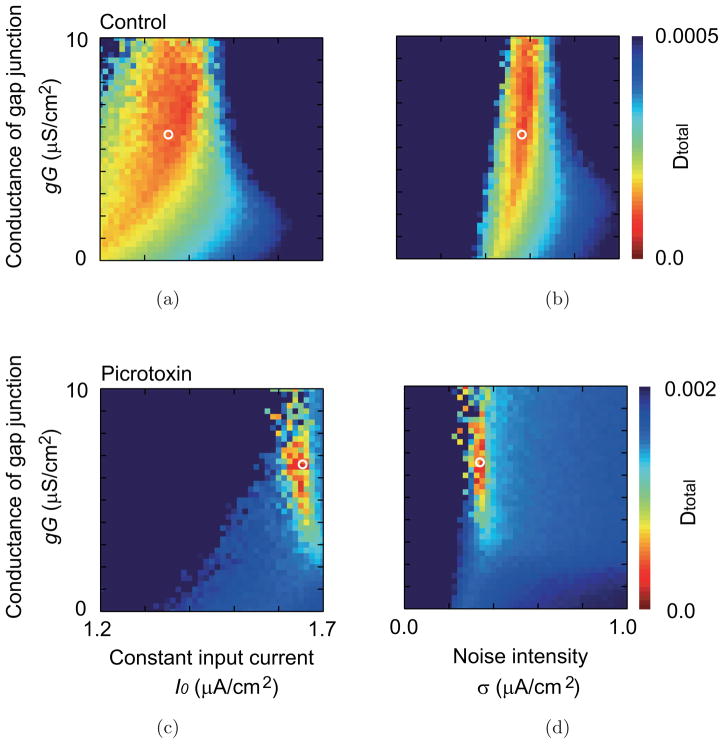
The estimated parameter values are summarized in Table 1. In the picrotoxin experiment, the I0 and gG are increased, and σ is decreased by the injection of picrotoxin. In the carbenoxolone experiment, on the other hand, I0, gG, and σ are all decreased by the injection of carbenoxolone. Figure 6 shows the dependence of the summed difference function Dtotal on those parameters and suggests that the obtained parameter value locates on a minimum of Dtotal and is a unique solution for the parameter space.
Table 1.
Estimated parameter values for the model with two experiments. For the time constant of variable n, a common value was used for two conditions. Parameters that correspond to the gap junction, the magnitude of the constant input, and that of the fluctuating input were obtained for each condition.
| Experiment | Injection of Drug | Time Constant of Variable n τn (ms) | Gap Junction Coupling gG (μS/cm2) | Constant Input I0 (μA/cm2) | Fluctuating Input σ (μA/cm2) |
|---|---|---|---|---|---|
| Picrotoxin | Before (After) | 49.72 | 5.19(6.51) | 1.36 (1.64) | 0.56 (0.33) |
| Carbenoxolone | Before (After) | 25.76 | 23.9 (5.14) | 1.24 (0.78) | 1.45 (1.22) |
Fig. 6.
The parameter dependence of the summed difference function Dtotal (a) on the constant input and the gap junction and (b) on the fluctuating input and the gap junction. (a, b) Control condition (c, d) Picrotoxin condition. The white circles show the estimated values of the parameters.
3.3. Phase plane and bifurcation analyses
Once the model accurately reproduced the experimental data in both conditions, phase plane and bifurcation analyses were used to clarify the differences in spatio-temporal dynamics of the model network. First, we considered the single-neuron dynamics in the absence of fluctuating input and gap junction coupling by illustrating the V –n trajectory on the two-dimensional phase plane.
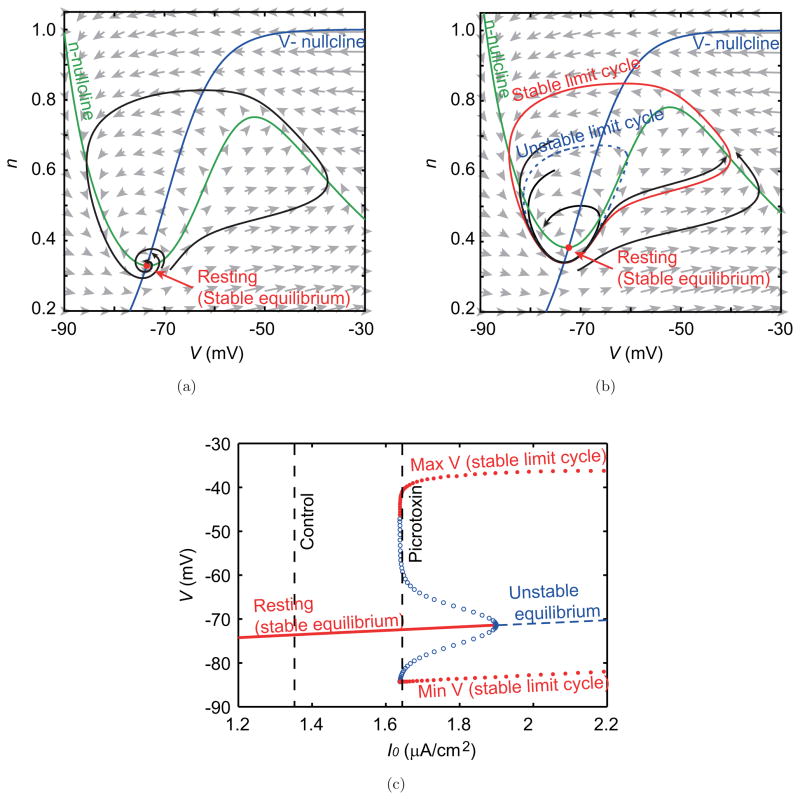
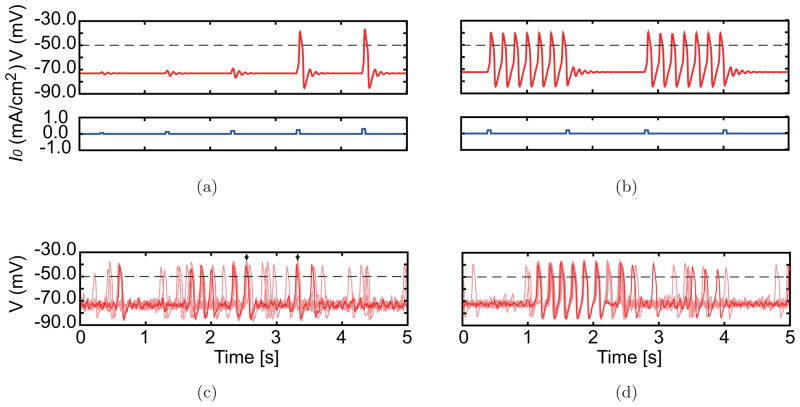
In the case of the control condition [see Figs. 7(a), 8(a) and 9(a)], the trajectory in the phase plane converges to the stable equilibrium point, which corresponds to the resting state. In the resting state, if the neuron receives a weak stimulation, only a small perturbation of the membrane potential is produced, and the system quickly returns to the resting state. In contrast, a sufficiently strong stimulus induces a large excursion of the system’s state that corresponds to the genesis of an action potential. Figure 8(a) indicates that, in the control condition, action potentials are generated only by pulse current inputs whose amplitudes are 0.4 and 0.5 mA/cm2.
Fig. 7.
Phase planes and bifurcation diagram in the picrotoxin experiment. (a, b) Phase planes describing the nonlinear dynamics of the model without fluctuating inputs and gap junction interactions under the constant input magnitudes that are estimated for (a) the control condition and (b) the picrotoxin condition. Blue and green curves show nullclines that satisfy V̇ = 0 and ṅ = 0, respectively. Crossings of these curves, marked by red points, are the equilibrium points. Under both of the above two conditions, these equilibrium points are stable and correspond to the resting state. Gray arrows indicate the direction and the magnitude of the vector field of this dynamics. Black curves with arrows show the typical trajectories in the V –n space. (c) The bifurcation diagram showing a relation between the membrane potential and the magnitude of constant input, which describes the change in the dynamics. Red and blue dashed curves indicate stable and unstable equilibrium points. Red filled circles indicate the maximum and minimum values of the membrane potential in the stable limit cycle that correspond to the periodically spiking state. Blue open circles indicate those of the unstable limit cycles. The two dashed vertical lines show input magnitudes that correspond to the control and picrotoxin conditions.
Fig. 8.
Membrane potential responses to current stimulations in simulations. Membrane potential time courses of 5s durations are shown. Horizontal dashed lines indicate the threshold potential that could mark spike occurrence times. (a, b) Responses of a single neuron (red traces) to current pulses with 50 ms width, which are superimposed on a constant input whose magnitude is specified for the two conditions (blue traces). (c, d) Typical responses of gap junction-coupled neurons (N = 25) with fluctuating input (10 of 25 neurons are plotted). A typical trace of a single neuron is plotted by the bold curve. Some synchronous spikes are indicated by arrows in c.
On the other hand, in the picrotoxin condition [Figs. 7(b) and 8(b)], two attractors co-exist: the stable equilibrium point (the resting state) and the stable limit cycle that correspond to a periodically spiking state [Fig. 7(b)]. If the orbit starts at a point inside of an unstable limit cycle [the blue dashed curve in Fig. 7(b)], the orbit converges to the stable equilibrium. On the contrary, if the orbit starts from a point outside the unstable limit cycle, it converges to the stable limit cycle. These two attractors, i.e. the resting and periodically spiking states, are realized under the same magnitude of the constant input. This bistability is a key to explaining the activity of IO neurons. Figure 8(b) indicates that pulse inputs of amplitude 0.3 mA/cm2 induce the switching between the two states depending on the timing of the input. That is, the system can jump from one attractor to the other and vice versa if inputs of appropriate magnitude are given to the system.
How this qualitative difference of neuronal dynamics depends on the magnitude of the constant input, I0, is depicted in the bifurcation diagram [Fig. 7(c)]. The input magnitude estimated using the control condition data is relatively low, as indicated by the left vertical line in Fig. 7(c). In the range of such small I0, the resting state is the unique attractor. When the magnitude of I0 increases and reaches I0 = 1.637 μA/cm2, a pair of stable and unstable limit cycles appears through a saddle-node bifurcation. The input magnitude of the picrotoxin condition corresponds to the situation with I0 = 1.641 μA/cm2. Further, at I0 = 1.90 μA/cm2, the unstable limit cycle shrinks to an unstable point, the same one at which there had been a stable equilibrium. Thus for I0 ≥ 1.90 μA/cm2 the trajectory of the system will always converge to the stable limit cycle regardless of the starting point. This type of qualitative change in the dynamics of a system as the value of the constant input I0 is varied is a sub-critical Hopf bifurcation. To test whether the system could show other types of dynamics, such as a supercritical Hopf bifurcation or a homoclinic bifurcation, the model was run using a variety of sets of parameter values. However, the model did not display other types of dynamics while maintaining good agreement with the experimental data.
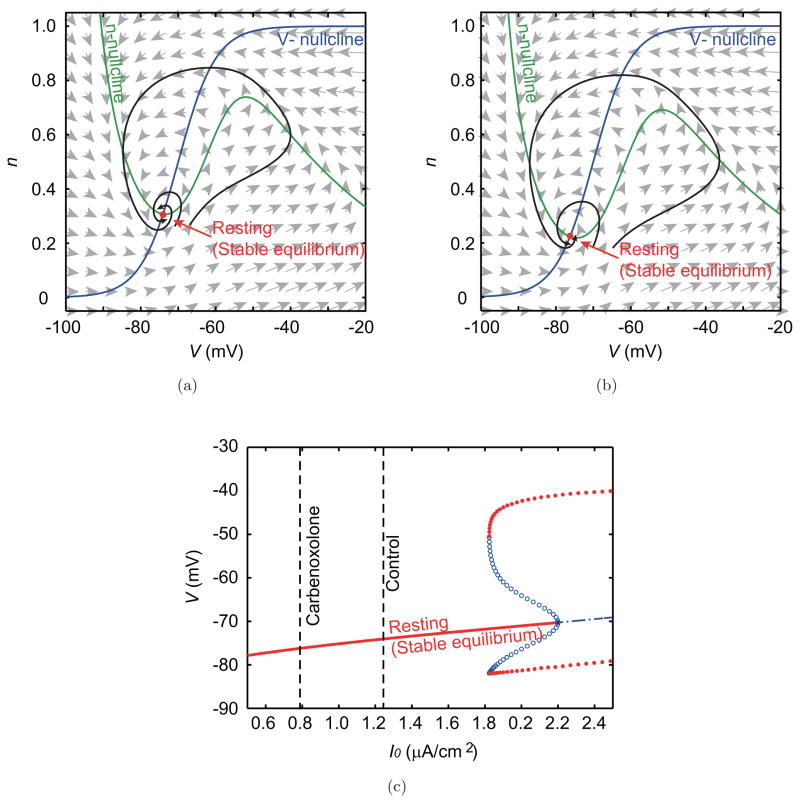
In contrast to picrotoxin, carbenoxolone did not cause a qualitative change of the phase plane and the appearance of any type of bifurcation (Fig. 9), because I0 decreased after the injection of carbenoxolone. Thus, the qualitative structure of the dynamics of the individual IO neurons did not change from that of the control condition.
Fig. 9.
Phase planes and the bifurcation diagram in the carbenoxolone experiment. Phase planes in (a) the control and (b) the carbenoxolone condition show the same qualitative structure, which consists of a stable equilibrium point (resting state). (c) The corresponding bifurcation diagram. Dashed vertical lines indicate the estimated magnitudes of the constant input.
Having defined the dynamics of individual simulated IO neurons, the effect of gap junction coupling and fluctuating synaptic input were investigated. Both were found to contribute to the population dynamics of IO neurons. Namely, the gap junctions help synchronize the membrane potentials of coupled neurons, while the fluctuating inputs tend to desynchronize them [Figs. 8(c) and 8(d)]. In the control condition [Fig. 8(c)], the membrane potential of each neuron mostly stays near the resting state, except when the magnitudes of the independent fluctuations are large enough for the neurons to produce action potentials. Mostly, the spikes of the different cells occur randomly with respect to each other; however, the attracting effect of gap junctions does lead to some synchronous spiking as indicated by arrows in Fig. 8(c). In the picrotoxin condition [Fig. 8(d)], the resting state and the periodically spiking state coexist, and the fluctuating inputs induce switching between the two states. The attracting effect of gap junctions results in a tendency for the neurons to function as a group and therefore all stay together in one of the two attractors or switch states simultaneously. This results in network dynamics in which there are both highly rhythmic synchronous spiking states and random spiking states, as shown by the rasters of Fig. 4(b).
3.4. Parameter dependence of CS activity
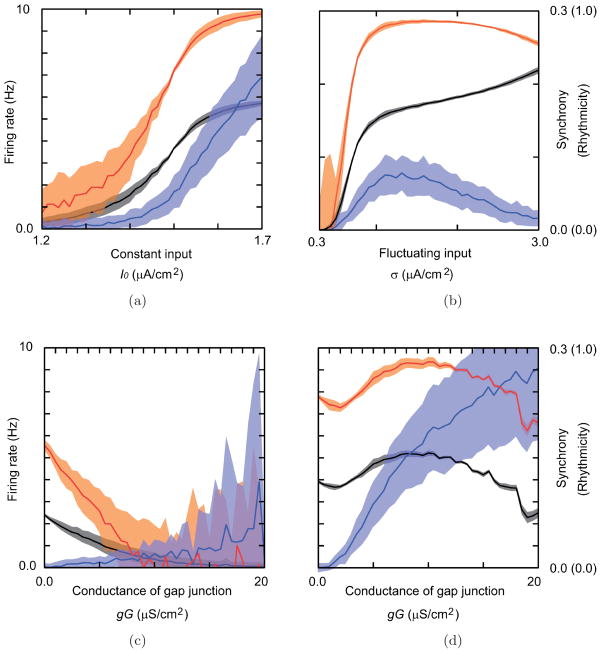
Picrotoxin and carbenoxolone induce alterations of parameter values that result in variations of the firing rate, rhythmicity and synchrony of IO activity. How these characteristics of IO activity depend on the model’s parameters is shown in Fig. 10.
Fig. 10.
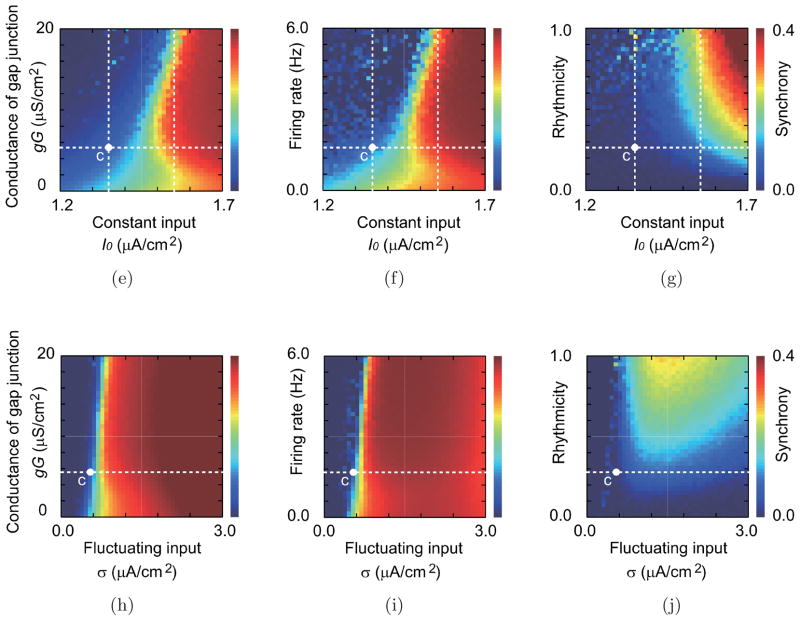
Parameter dependence of the firing rate, rhythmicity, and spike synchrony in simulations. (a–d) The mean and the standard deviation of the firing rate (black curves and gray bands), those of the rhythmicity (orange curves and orange band) and those of the synchrony of each pair (blue curves and blue bands) in the simulations. (a) Dependence on the magnitude of the constant input, and (b) that of the fluctuating input. (c, d) Dependence on the coupling of the gap junction in (c) a relatively low input current range as in the control condition (I0 = 1.35 μA/cm2), and in (d) a high input current range that corresponds to the picrotoxin condition (I0 = 1.55 μA/cm2). (e–j) Dependence of (e, h) the firing rate, (f, i) the rhythmicity, and (g, j) the synchrony, respectively, on the two parameters: namely, the constant input current and the conductance of gap junction (e–g), and the fluctuating input and the conductance of gap junction (h–j). White dashed lines indicate the parameter values of a–d. The white point with mark “c” indicates the parameter values specified with the control condition.
If the gap junction conductance is fixed and the magnitude of constant input varies, firing rate, rhythmicity, and synchrony all increase with the magnitude of the constant input [Fig. 10(a)]. The firing rate is also increased by the fluctuating input [Fig. 10(b)], which increases a tendency for the membrane potential to reach the spiking threshold. In the range below σ ≅ 1.4 μA/cm2, the dependency of CS activity on the fluctuating input [Figs. 10(h)–10(j)] shows similarity to that on the constant input [Figs. 10(e)–10(g)]. The fluctuating input contributes to the rhythmicity and synchrony in this range. In a relatively high fluctuating input range (σ > 1.4 μA/cm2), on the other hand, the fluctuation disrupts the regularity and coincidence of spike timing and decreases the rhythmicity and synchrony.
On the other hand, if the gap junction conductance value is also allowed to vary, the dependence of these measures of IO activity on the input current is more complex [Figs. 10(e)–10(j)]. Synchrony monotonically increases with increasing coupling for any value of the constant input current, but changes of the firing rate and rhythmicity show a more complicated dependence on the input current. Moreover, the changes in the firing rate and rhythmicity are highly correlated. In the range below I0 ≅ 1.45 μA/cm2, the firing rate and the rhythmicity are suppressed by increasing the gap junction conductance [Fig. 10(c)]. On the other hand, in a relatively high input current range (I0 > 1.45 μA/cm2), which corresponds to the picrotoxin condition, the firing rate and rhythmicity after initially decreasing, increase with increasing the gap junction conductance until gG ≅ 10 μS/cm2 [Fig. 10(d)]. With further increases in gG the firing rate and rhythmicity gradually decline. Consistent with the model, a decrease in rhythmicity (in contrast to the increase with picrotoxin) was observed in some experiments in which lesions of the cerebellar nuclei (origin of the GABAergic input to the IO) were made, and high levels of synchrony (higher than those typically found with picrotoxin injections) were produced [Lang et al., 1996].
The dependence of the firing rate on I0 and the gap junction conductance can be understood from the viewpoint of dynamical systems theory. The fluctuating current is what triggers action potentials. In the range below I0 ≅ 1.45 μA/cm2, the effect of gap junction coupling causes a decrease in the firing rate because coupled neurons attract their membrane potentials to each other and the fluctuating excitation randomly occurs in just a few cells at any moment. Thus, most cells are near the stable equilibrium (resting state), and therefore tend to suppress firing that would be caused by the fluctuating input in cells to which they are coupled. In contrast, in the upper range for I0 ≅ 1.45μA/cm2, the tendency for action potential generation is enhanced by an increase in gap junction conductance, because the fluctuating excitation occurs in several cells simultaneously, and membrane potentials of all cells tend to be attracted to spiking, leading to an increase in the firing rate.
4. Discussion
We have demonstrated that a gap junction-coupled system of two-variable conductance-based model neurons quantitatively reproduces the spatio-temporal dynamics of the spiking patterns in the IO network. Furthermore, phase plane and bifurcation analyses were used to show that qualitative properties of the dynamical system can be shifted by the injection of drugs.
A simplified neuronal model was used in order to reduce the complexity of multi-ion channel dynamics. Nevertheless, some functional correspondence may exist between some of the model’s conductances and those found in IO neurons. The model incorporated three major currents in its neurons: leak, depolarizing and hyperpolarizing currents. The depolarizing current may act similarly to the low threshold calcium current of IO neurons in that it acted to depolarize the membrane potential toward firing threshold. Furthermore, the depolarizing current often triggered the activation of the hyperpolarizing current, because of the dependence of n on the membrane voltage [Eqs. (5)–(8)]. Thus, the combined gD and gH mediated currents act to create depolarization–hyperpolarization sequences, which are phenomenologically similar to those displayed by IO neurons [Llinas & Yarom, 1986], even if the underlying mechanisms are somewhat distinct.
Evidence that the model captured essential aspects of IO network activity is that the model was able to generate data that were in good agreement with observations of CS activity under three distinct conditions: control, picrotoxin and carbenoxolone. Moreover, changes in the model’s parameters in the three conditions were generally consistent with what one would expect based on the pharmacological actions of the two drugs.
Picrotoxin is an antagonist of GABAA receptors, which are the main receptors through which IO neurons are inhibited. Thus, the disinhibition caused by the picrotoxin injection should essentially be equivalent to an increase of the excitatory input magnitude. This is consistent with the results of our parameter estimation suggesting that the picrotoxin condition has an increased constant synaptic input compared to control (Table 1). Our results further indicate that the picrotoxin injection would increase the parameter value that corresponds to the gap junction conductance, which is in accord with previous experimental results [Lang et al., 1996]. This dual action of GABA is consistent with the presence of GABAergic terminals both on the soma and main dendritic shafts of IO neurons, where they are in a position to influence the overall excitability of the cell, and on dendritic spine heads, where they can selectively influence the effective coupling between IO neurons by controlling the conductance of the spine membrane, as described earlier (see Methods). It should be noted that the effects of picrotoxin can be produced in vivo by firing of Purkinje cells which inhibits cerebellar nuclei neurons sending GABAergic terminals to IO neurons, for example.
Carbenoxolone is an antagonist of gap junctions, which electrically couple the dendritic spines of neighboring neurons. Thus, the blockade of gap junctions by the carbenoxolone injection is consistent with our parameter estimation suggesting that the effective conductances among neurons are reduced by carbenoxolone (Table 1). The parameter estimation also suggests that the carbenoxolone injection reduces magnitudes of constant and fluctuating inputs. Although the interpretation of the reduction of these parameters in the carbenoxolone condition is not certain, the decrease in the magnitude of currents flowing through the gap junctions would also reduce the absolute level of the fluctuations in these currents, which could be the source of the reduction of the fluctuating input predicted by the model.
Further correspondence between the model and experimental data on the IO is that the subthresh-old oscillation observed in IO neurons can also be reproduced by the model. As shown in Fig. 8, even in a single neuron, the small perturbation caused by each current pulse triggers a damped oscillation of the membrane potential that lasts for several cycles. Although there are different possible mechanisms of subthreshold oscillation [Manor et al., 1997], our results suggest that the oscillation is a damping process towards the stable equilibrium of a subcritical-Hopf type model. The process can be viewed as a helical orbit around the stable equilibrium in the phase plane [Figs. 7(a) and 7(b)].
How the level of gap junction coupling affects the rhythmicity of CSs is unclear so far, but our results suggest that the rhythmicity is effected not only by the gap junction but also by changes in the constant and fluctuating input currents as shown in Fig. 10. The rhythmicity corresponds to repetitive firing with a period nearly equal to that of the limit cycle which is generated by the saddle-node bifurcation. It is worth noting that the model could generate rhythmic CS activity in the absence of gap junction coupling between neurons, which is consistent with some experimental results, but not others [Bleasel & Pettigrew, 1992; Blenkinsop & Lang, 2006; Lampl & Yarom, 1997; Leznik & Llinas, 2005; Llinas & Yarom, 1986; Long et al., 2002; Manor et al., 1997; Marshall et al., 2007; Placantonakis et al., 2006].
The model also shows the clear dependence of CS synchrony on the gap junction coupling of IO neurons (Fig. 10). If there is no gap junction coupling, the fluctuating input current leads to completely asynchronous spiking of the neurons. However, in agreement with previous studies [Lang, 2002; Lang et al., 1996], synchrony is markedly enhanced by an increase in the effective level of gap junction coupling among IO neurons.
The spatiotemporal patterns of CS activity shown in the Results section demonstrated the distinctive transition behavior between synchronous and asynchronous spiking states in the picrotoxin condition [Fig. 4(b)]. Bimodal peaks in the minimal distance distribution in Fig. 4(h) also indicate the coexistence of these two states. The mechanism of the transition behavior can be explained by the characteristic structure of the neuron model. In the parameter region that corresponds to the picrotoxin condition, the neuron model has two attractors: the stable equilibrium point with the resting state and the stable limit cycle with the sustained spiking state that are easily switched by fluctuations, because a separatrix of these two states, which is formed by the unstable limit cycle, tends to be very close to the lower part of the stable limit cycle. When the state point on the stable limit cycle passes through this region, the state point can be easily trapped into the stable equilibrium. Conversely, the state point can easily exit from the trapped orbit around the stable equilibrium point by fluctuations because the position of the resting state, and hence parts of the orbit, are close to the separatrix.
Even if there is no gap junction coupling, these transitions can occur, but the times of these transitions in the network would not be synchronized. The gap junction coupling reduces differences in membrane potential among neurons, so that the resulting states of neurons in the network tend to be coherently biased either to the resting state or to the sustained spiking state, and so that the times of state transitions tend to be synchronized. It seems, thus, that the gap junction coupling facilitates bistability at the network level. How such bistability contributes to functions of the olivocerebellar system is an open problem. One possible role of this intrinsic bistable state is to act as a short-term memory [Loewenstein et al., 2005]. For example, a sufficiently large fluctuating input from IO afferents may trigger the synchronous state in IO, which can then be maintained for several hundred milliseconds. This maintained activity in the IO possibly affects cerebellar motor control and learning processes [Van Der Giessen et al., 2008].
Here, we conclude that the dynamics of IO neurons are of the subcritical Hopf bifurcation type. This qualitative classification of neuronal dynamics should be tested using a higher dimensional model. Thus, the identification of the qualitative property of neuronal dynamics may contribute to the development of more realistic and higher-dimensional models. We also note that the use of the simple reduced model was the key to the success of this initial modeling with which we have begun to define the dynamical structure of the IO. We have also demonstrated that the dynamical properties of neurons can be estimated with spatiotemporal patterns of spikes. This approach should be applied for estimating the dynamical properties of other neural systems.
Acknowledgments
This research is partially supported by Grant-in-Aids for Scientific Research from the Ministry of Education, Culture, Sports, Science and Technology of Japan (17022012 and 20246026); by a grant from the NIH of the United States (AA016566); and by the National Institute of Information and Communications Technology.
Contributor Information
YUICHI KATORI, Email: katori@sat.t.u-tokyo.ac.jp, Institute of Industrial Science, The University of Tokyo, 4-6-1 Komaba, Meguro-ku, Tokyo 153-8505, Japan.
ERIC J. LANG, Department of Physiology & Neuroscience, New York University, School of Medicine, 550 First Avenue, New York, NY 10016, USA
MIHO ONIZUKA, Graduate School of Information Science, Nara Institute of Science and Technology, Nara 630-9192, Japan, ATR Computational Neuroscience Labs, Department of Communiation and Cognitive Cybernetics, Hikaridai 2-2-2, Keihanna Science City, Kyoto 619-0288, Japan.
MITSUO KAWATO, ATR Computational Neuroscience Labs, Hikaridai 2-2-2, Keihanna Science City Kyoto 619-0288, Japan, Graduate School of Information Science, Nara Institute of Science and Technology, Nara 630-9192, Japan.
KAZUYUKI AIHARA, Institute of Industrial Science, The University of Tokyo, 4-6-1 Komaba, Meguro-ku, Tokyo 153-8505, Japan.
References
- Bal T, McCormick DA. Synchronized oscillations in the inferior olive are controlled by the hyperpolarization-activated cation current I(h) J Neurophysiol. 1997;77:3145–3156. doi: 10.1152/jn.1997.77.6.3145. [DOI] [PubMed] [Google Scholar]
- Belluardo N, Mudo G, Trovato-Salinaro A, Le Gurun S, Charollais A, Serre-Beinier V, Amato G, Haefliger JA, Meda P, Condorelli DF. Expression of connexin36 in the adult and developing rat brain. Brain Res. 2000;865:121–138. doi: 10.1016/s0006-8993(00)02300-3. [DOI] [PubMed] [Google Scholar]
- Benardo LS, Foster RE. Oscillatory behavior in inferior olive neurons: Mechanism, modulation, cell aggregates. Brain Res Bull. 1986;17:773–784. doi: 10.1016/0361-9230(86)90089-4. [DOI] [PubMed] [Google Scholar]
- Bleasel AF, Pettigrew AG. Development and properties of spontaneous oscillations of the membrane potential in inferior olivary neurons in the rat. Brain Res Dev Brain Res. 1992;65:43–50. doi: 10.1016/0165-3806(92)90006-i. [DOI] [PubMed] [Google Scholar]
- Blenkinsop TA, Lang EJ. Block of inferior olive gap junctional coupling decreases Purkinje cell complex spike synchrony and rhythmicity. J Neurosci. 2006;26:1739–1748. doi: 10.1523/JNEUROSCI.3677-05.2006. [DOI] [PMC free article] [PubMed] [Google Scholar]
- Condorelli DF, Parenti R, Spinella F, Trovato Salinaro A, Belluardo N, Cardile V, Cicirata F. Cloning of a new gap junction gene (C × 36) highly expressed in mammalian brain neurons. Eur J Neurosci. 1998;10:1202–1208. doi: 10.1046/j.1460-9568.1998.00163.x. [DOI] [PubMed] [Google Scholar]
- de Zeeuw CI, Holstege JC, Ruigrok TJ, Voogd J. Ultrastructural study of the GABAergic, cerebellar, and mesodiencephalic innervation of the cat medial accessory olive: Anterograde tracing combined with immunocytochemistry. J Comp Neurol. 1989;284:12–35. doi: 10.1002/cne.902840103. [DOI] [PubMed] [Google Scholar]
- Eccles JC, Llinas R, Sasaki K. The excitatory synaptic action of climbing fibres on the purinje cells of the cerebellum. J Physiol. 1966;182:268–296. doi: 10.1113/jphysiol.1966.sp007824. [DOI] [PMC free article] [PubMed] [Google Scholar]
- Hodgkin AL, Huxley AF. A quantitative description of membrane current and its application to conduction and excitation in nerve. J Physiol. 1952;117:500–544. doi: 10.1113/jphysiol.1952.sp004764. [DOI] [PMC free article] [PubMed] [Google Scholar]
- Izhikevich EM. Dynamical Systems in Neuroscience: The Geometry of Excitability and Bursting. MIT press; 2006. [Google Scholar]
- Kawato M, Gomi H. A computational model of four regions of the cerebellum based on feedback-error learning. Biol Cybern. 1992;68:95–103. doi: 10.1007/BF00201431. [DOI] [PubMed] [Google Scholar]
- Lampl I, Yarom Y. Subthreshold oscillations and resonant behavior: Two manifestations of the same mechanism. Neuroscience. 1997;78:325–341. doi: 10.1016/s0306-4522(96)00588-x. [DOI] [PubMed] [Google Scholar]
- Lang EJ, Sugihara I, Llinas R. GABAergic modulation of complex spike activity by the cerebellar nucleoolivary pathway in rat. J Neurophysiol. 1996;76:255–275. doi: 10.1152/jn.1996.76.1.255. [DOI] [PubMed] [Google Scholar]
- Lang EJ, Sugihara I, Welsh JP, Llinas R. Patterns of spontaneous purkinje cell complex spike activity in the awake rat. J Neurosci. 1999;19:2728–2739. doi: 10.1523/JNEUROSCI.19-07-02728.1999. [DOI] [PMC free article] [PubMed] [Google Scholar]
- Lang EJ. Organization of olivocerebellar activity in the absence of excitatory glutamatergic input. J Neurosci. 2001;21:1663–1675. doi: 10.1523/JNEUROSCI.21-05-01663.2001. [DOI] [PMC free article] [PubMed] [Google Scholar]
- Lang EJ. GABAergic and glutamatergic modulation of spontaneous and motor-cortex-evoked complex spike activity. J Neurophysiol. 2002;87:1993–2008. doi: 10.1152/jn.00477.2001. [DOI] [PubMed] [Google Scholar]
- Leznik E, Llinas R. Role of gap junctions in synchronized neuronal oscillations in the inferior olive. J Neurophysiol. 2005;94:2447–2456. doi: 10.1152/jn.00353.2005. [DOI] [PubMed] [Google Scholar]
- Llinas R, Baker R, Sotelo C. Electro-tonic coupling between neurons in cat inferior olive. J Neurophysiol. 1974;37:560–571. doi: 10.1152/jn.1974.37.3.560. [DOI] [PubMed] [Google Scholar]
- Llinas R, Yarom Y. Electrophysiology of mammalian inferior olivary neurones in vitro. Different types of voltage-dependent ionic conductances. J Physiol. 1981a;315:549–567. doi: 10.1113/jphysiol.1981.sp013763. [DOI] [PMC free article] [PubMed] [Google Scholar]
- Llinas R, Yarom Y. Properties and distribution of ionic conductances generating electroresponsiveness of mammalian inferior olivary neurones in vitro. J Physiol. 1981b;315:569–584. doi: 10.1113/jphysiol.1981.sp013764. [DOI] [PMC free article] [PubMed] [Google Scholar]
- Llinas R, Yarom Y. Oscillatory properties of guinea-pig inferior olivary neurones and their pharmacological modulation: An in vitro study. J Physiol. 1986;376:163–182. doi: 10.1113/jphysiol.1986.sp016147. [DOI] [PMC free article] [PubMed] [Google Scholar]
- Loewenstein Y, Mahon S, Chadderton P, Kitamura K, Sompolinsky H, Yarom Y, Hausser M. Bistability of cerebellar Purkinje cells modulated by sensory stimulation. Nat Neurosci. 2005;8:202–211. doi: 10.1038/nn1393. [DOI] [PubMed] [Google Scholar]
- Long MA, Deans MR, Paul DL, Connors BW. Rhythmicity without synchrony in the electrically uncoupled inferior olive. J Neurosci. 2002;22:10898–10905. doi: 10.1523/JNEUROSCI.22-24-10898.2002. [DOI] [PMC free article] [PubMed] [Google Scholar]
- Manor Y, Rinzel J, Segev I, Yarom Y. Low-amplitude oscillations in the inferior olive: A model based on electrical coupling of neurons with heterogeneous channel densities. J Neurophysiol. 1997;77:2736–2752. doi: 10.1152/jn.1997.77.5.2736. [DOI] [PubMed] [Google Scholar]
- Marshall SP, van der Giessen RS, de Zeeuw CI, Lang EJ. Altered olivocerebellar activity patterns in the connexin36 knockout mouse. Cerebellum. 2007;6:287–299. doi: 10.1080/14734220601100801. [DOI] [PubMed] [Google Scholar]
- Nelder JA, Mead R. A simplex method for function minimisation. Comput J. 1965;7:308–313. [Google Scholar]
- Nelson B, Mugnaini E. Origins of GABAergic inputs to the inferior olive. The Olivocerebellar System in Motor Control Berlin: Experimental Brain Research. 1989;17:86–107. [Google Scholar]
- Placantonakis DG, Bukovsky AA, Aicher SA, Kiem HP, Welsh JP. Continuous electrical oscillations emerge from a coupled network: A study of the inferior olive using lentiviral knockdown of connexin36. J Neurosci. 2006;26:5008–5016. doi: 10.1523/JNEUROSCI.0146-06.2006. [DOI] [PMC free article] [PubMed] [Google Scholar]
- Sasaki K, Bower JM, Llinas R. Multiple Purkinje cell recording in rodent cerebellar cortex. Eur J Neurosci. 1989;1:572–586. doi: 10.1111/j.1460-9568.1989.tb00364.x. [DOI] [PubMed] [Google Scholar]
- Schweighofer N, Spoelstra J, Arbib MA, Kawato M. Role of the cerebellum in reaching movements in humans. II. A neural model of the intermediate cerebellum. Eur J Neurosci. 1998;10:95–105. doi: 10.1046/j.1460-9568.1998.00007.x. [DOI] [PubMed] [Google Scholar]
- Schweighofer N, Doya K, Kawato M. Electrophysiological properties of inferior olive neurons: A compartmental model. J Neurophysiol. 1999;82:804–817. doi: 10.1152/jn.1999.82.2.804. [DOI] [PubMed] [Google Scholar]
- Shinomoto S, Miura K, Koyama S. A measure of local variation of inter-spike intervals. Biosystems. 2005;79:67–72. doi: 10.1016/j.biosystems.2004.09.023. [DOI] [PubMed] [Google Scholar]
- Sotelo C, Gotow T, Wassef M. Localization of glutamic-acid-decarboxylase-immunoreactive axon terminals in the inferior olive of the rat, with special emphasis on anatomical relations between GABAergic synapses and dendrodendritic gap junctions. J Comp Neurol. 1986;252:32–50. doi: 10.1002/cne.902520103. [DOI] [PubMed] [Google Scholar]
- Van Der Giessen RS, Koekkoek SK, van Dorp S, De Gruijl JR, Cupido A, Khosrovani S, Dortland B, Wellershaus K, Degen J, Deuchars J, Fuchs EC, Monyer H, Willecke K, De Jeu MT, De Zeeuw CI. Role of olivary electrical coupling in cerebellar motor learning. Neuron. 2008;58:599–612. doi: 10.1016/j.neuron.2008.03.016. [DOI] [PubMed] [Google Scholar]
- Welsh JP, Lang EJ, Suglhara I, Llinas R. Dynamic organization of motor control within the olivocerebellar system. Nature. 1995;374:453–457. doi: 10.1038/374453a0. [DOI] [PubMed] [Google Scholar]


