Summary
TNK-tPA products from the innovator and follow-on manufacturers were characterized and compared. All tryptic peptides including N-terminal, C-terminal and mutated peptides as well as the disulfide linked peptides were identified, with the demonstration of the same primary sequence and disulfide linkages between the innovator and follow-on products. The three N-linked and one O-linked fucose glycosylation sites were identified. The two N-linked (N103 and N448) and one O-linked fucose (T61) sites were fully glycosylated in both innovator and follow-on products. The other N-linked site (N184) was partially glycosylated and exhibited a ~2.5 fold difference between the innovator (60% occupancy) and follow-on (25% occupancy) products. Since the glycosylation occupancy at this site is known to affect biological activity in the clot lysis assay, this observed difference could cause a concern as to their bioequivalence. The cleavage site for the conversion of the zymogen form to active enzyme was also identified between R275 and I276, with a cleavage of 40% for the innovator and 10% for the follow-on products. Both the % glycosylation occupancy and the chain cleavage were determined by two independent approaches, starting from either the peptide or intact protein separation, with consistent results by both methods. Subtle differences of modifications such as deamidation and oxidation between innovator and biosimilar were shown at M207, M445, M490 and N58, N184. The observation of different extent of oxidation at M207 and deamidation at N184, which could influence the clot lysis activity, were also of potential concern in drug efficacy between the follow-on and innovator products.
Introduction
Protein therapeutics are often complex in nature, particularly for glycosylated proteins.1 The production of generic or follow-on biologicals with glycosylation thus presents a high degree of challenge as to reproduce a similar if not identical structure to their original innovator drugs. Therefore, to assure a similar or even same structure, a powerful analytical technique is needed to comprehensively characterize the structure of such protein drugs to the detailed molecular level. The recent advancement of proteomic technology, such as liquid chromatography coupled online with tandem mass spectrometry (LC-MS), has been shown to be able to comprehensively characterize targeted proteins.2–5 For example, our laboratory has extensively studied a biosimilar version of beta interferon using LC-MS.4 After comprehensive characterization, we discovered a low level, but potentially harmful modification, due to glycation at lysine amino acid residues on beta interferon as well as the carrier protein, human serum albumin.4 In addition, we further applied this approach to study recombinant human growth hormone obtained from the follow-on, counterfeit, and innovator manufacturers.5 This characterization included the identification of disulfide linkages using LC-MS with electron transfer dissociation.5–6 We were able to distinguish subtle but distinct differences in oxidation, deamidation and chain cleavages from the three manufacturers (the original innovator, biosimilar and counterfeit products). These subtle but distinct differences were likely due to a combination of nonidentical manufacturing, formulation procedures, and storage conditions.
In this work, we used a similar LC-MS approach combined with a multi-separation and multi-enzymatic digestion strategy for a more complex glycoprotein, TNK-tPA, a generic variant of tissue plasminogen activator (t-PA), which was approved for treatments of acute myocardial infarction and ischemic stroke.7–9 TNK-tPA has the same amino acid sequence as natural human t-PA except with the three substitutions, at T103 to N, at N117 to Q, and at KHRR (296–299) to AAAA. These substitutions lead to a longer half life and higher fibrin specificity than t-PA.10–11 In this study, differences in glycosylation occupancy and chain cleavage at the activation site of the enzyme have been observed between the innovator and follow-on products.
Experimental
Materials
TNK-tPA (Tenecteplase) (Genentech, So. San Francisco, CA), a lyophilized product, consisted of 50 mg of recombinant tissue plasminogen activator. The follow-on product, Elaxim (Gennova Biopharmaceuticals Ltd, Hinjwadi, Pune, India), a lyophilized product, consisted of 52.5mg of recombinant tissue plasminogen activator and similar excipients as for Genentech. Achromobacter protease I (Lys-C) was obtained from Wako Co. (Richmond, VA), endoproteinase Glu-C from Roche (Indianapolis, IN), and trypsin (sequencing grade) from Promega (Madison, WI). PNGase F, guanidine hydrochloride, α-cyano-4-hydroxycinnamic acid (CHCA), ammonium bicarbonate, trifluoracetic acid (TFA) and formic acid (FA) were from Sigma-Aldrich (St. Louis, MO). The CHCA matrix was recrystallized before use. LC-MS grade water was purchased from JT Baker (Phillipsburg, NJ), and HPLC grade acetonitrile was from Thermo Fisher Scientific (Fairlawn, NJ). Microcon YM-10 Centrifugal Filter Unit was obtained from Millipore (Bedford, MA).
Enzymatic digestion
Protein solution (2.5 mg/mL) was denatured with 6M guanidine hydrochloride containing 100mM ammonium bicarbonate, reduced with 5mM dithiothreitol (DTT) for 30 min at 37 °C and alkylated with 20mM of iodoacetamide (IAA) in the dark for 30 min at room temperature. The reduced and alkylated protein was buffer exchanged with trypsin digestion buffer (100mM ammonium bicarbonate, pH 8) using a 10kDa molecular weight cut-off (MWCO) filter. The endoproteinase Lys-C (1:100 w/w) was added to the protein solution for 4 hr at 37 °C. For trypsin digestion, trypsin (1:100 w/w) was added to the protein solution at room temperature for 8 hr and then added a second time (1:100 w/w) for 12 hr at room temperature. Digestion was stopped by addition of 1% formic acid. For Glu-C digestion, Glu-C (1:50 w/w) was added to the protein solution at 37 °C for 8 hrs. For PNGase F digestion (after trypsin digestion), PNGase F (10units/mg) was added to the trypsin digest solution for an additional 4 hr at 37 °C. In all cases, digestion was terminated by addition of 1% formic acid. For digestion without disulfide reduction, the same digestion protocol as above was applied except skipping the reduction and alkylation steps.
SDS-PAGE and in-gel digestion
An aliquot of protein solution (20 or 40 uG) diluted with the running buffer of a SDS-PAGE gel (10% Tris-HEPES-SDS gel) for separation. The gel bands of interest were cut for digestion. Briefly, the gel slices, after removed Coomassie stain, were reduced with dithiothreitol (DTT) by the addition of 250μL of 10 mM DTT in 0.1 M ammonium bicarbonate and incubated for 30 min at 56 °C, and alkylated with 250 μL of 55 mM iodoacetamide (IAA) in 0.1 M ammonium bicarbonate at room temperature for 1 hr in the dark. Then, a trypsin digestion reagent (12.5 ng/μL trypsin in 50 mM ammonium bicarbonate, pH 8.0) was added for 30–35 min at 4 °C, followed by further incubation overnight at 37 °C. The digested peptides were extracted from the gel with 25mM ammonium bicarbonate, then acetonitrile (37 °C for 15min), and further extracted with 5% formic acid at 37 °C for 5 min. All supernatants were collected and concentrated for the subsequent LC-MS analysis.
LC-MS
An Ultimate 3000 nanoLC pump (Dionex, Mountain View, CA) and a self-packed C18 column (Magic C8, 200Å pore and 5 μm particle size, 75 μm i.d. × 15 cm) (Michrom Bioresources, Auburn, CA) was coupled on-line to an LTQ-FT mass spectrometer (Thermo Fisher Scientific, San Jose, CA) through a nanospray ion source (New Objective, Woburn, MA). Mobile phase A was 0.1% formic acid in water, and mobile phase B was 0.1 % formic acid in acetonitrile. The gradient consisted of: (i) 20 minutes at 2 % B for sample loading; (ii) linear from 2 to 60% B over 60 min; (iii) linear from 60 to 80% B over 10 min; and finally (iv) isocratic at 80% B for 10 min. The flow rate of the column was maintained at 200 nL/min. The LTQ-FT MS was operated as follows : survey full-scan MS spectra (m/z 400 – 2000) were acquired in the FTICR cell with mass resolution of 100,000 at m/z 400 (with the ion target value of 2×10⁶ ions), followed by 8 sequential MS2 scans using LTQ portion. For disulfide linkage determination, an LTQXL with ETD mass spectrometer (Thermo Fisher Scientific) was operated in the data-dependent mode to switch automatically between MS (scan 1), CID-MS2 (scan 2), ETD-MS2 (scan 3), and MS3 (scan 4). Briefly, after a survey MS spectrum from m/z 400 to 2000, subsequent CID-MS2 and ETD-MS2 steps were performed on the same precursor ion with a ± 2.5 m/z isolation width. The CID-MS3 step was performed on the highest intensity ion from the ETD-MS2 spectrum (± 5 m/z isolation width).
MALDI-TOF/TOF
An aliquot of ~1 μg of TNK-tPA was mixed with matrix solution (7 mg/mL CHCA, 0.1% (v/v) TFA in 50% (v/v) ACN/water) at a ratio of 1:1, and the mixture was then deposited onto a stainless steel MALDI plate for MS and MS/MS measurement using a 4700 Proteomics Analyzer (Applied Biosystems Framingham, MA). Each spectrum was obtained from a total of 1000 laser shots across the entire spot (50 laser shots at each of 20 random positions within the spot). A maximum of 15 MS/MS spectra were acquired from each spot. The spectra were calibrated using a single internal standard with the 4700 Explorer software (Applied Biosystems), resulting in roughly 30 ppm mass accuracy across the entire MALDI plate.
Peptide Assignment
The spectra generated in the CID-MS2 step were searched against spectra of theoretical fragmentations (b and y ions) of TNK-tPA with a mass tolerance ± 1.4 Da (for both precursor and fragment ions) and with either trypsin or Lys-C specificity, using Xcorr (1+ precursor ion ≥1.9, 2+ ≥ 2.2, and 3+ and above ≥ 3.8 as the initial filter. The spectra generated in the ETD-MS2 were searched against spectra of theoretical fragmentations (c and z ions) of TNK-tPA but filtered using Xcorr (≥1) initially. Final confirmation of the assignment was obtained by manual inspection to match all high abundant product ions with the precursor ion mass accuracy (< 5 ppm for LTQ FT MS).
Results and Discussion
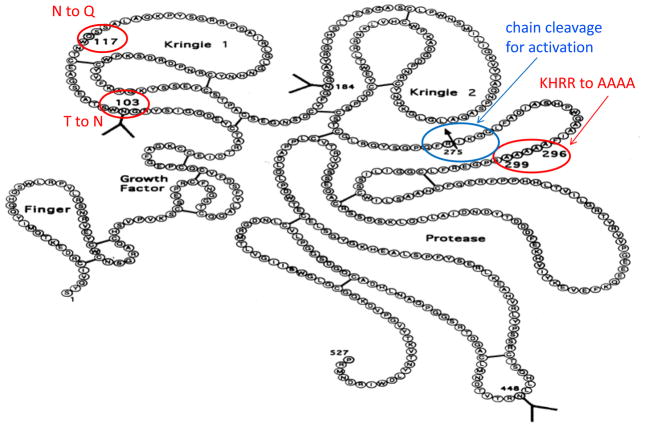
Recombinant tissue plasminogen activator (rt-PA) is a glycoprotein composed of 527 amino acids, which are homologous with five different protein families, namely finger, growth factor, two kringle regions, and a serine protease (see Figure 1). TNK-tPA has the same number of amino acids as rt-PA except for mutation at the three locations as described in the introduction and Figure 1 (amino acids with circles). Since the correct amino acid sequence is critical to assess the success of a recombinant DNA process, the primary structure of TNK-tPA was first extensively characterized by LC-MS analysis from the products of Lys-C, trypsin and Glu-C digestion.
Figure 1.
Primary structure of TNK-tPA. The positions of amino acid mutation from rt-PA and the chain cleavage for activation are indicated in the figure.
Primary structure identification
The entire amino acid sequence was identified by LC-MS tryptic mapping except for the 6 small peptides (RPDAIR, NPDR, HNYCR, NRR, TYR, and SDSSR), which were not retained in the LC separation but were further identified with MALDI-TOF analysis. In addition, we used Lys-C or Glu-C digestion and the corresponding peptide fragments with overlapped sequences at these six regions were also identified. The identifications of N and C-terminal tryptic peptides were shown in the supplementary material (see Figures S1 and S2).
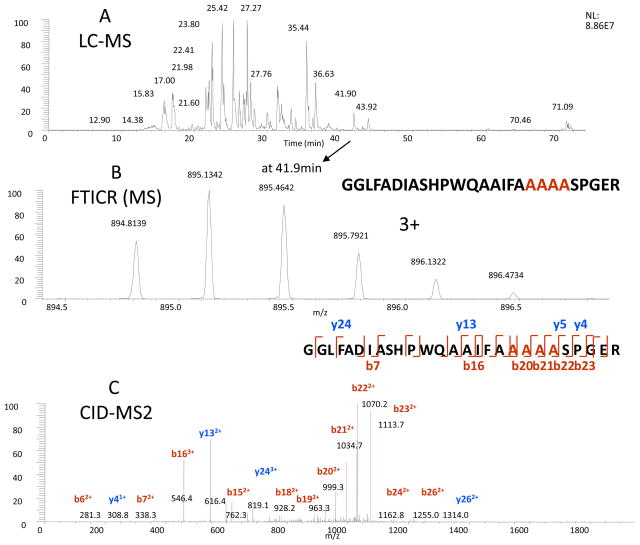
The peptide (T27) which contains the mutation sites of AAAA, as shown in Figure 2, was identified at 41.90 min (Figure 2A), with the accurate precursor mass measurement (m/z 895.1342, 2+ charge) (Figure 2B) and CID-MS2 of the precursor ion (Figure 2C). The high abundance product ions, as the results of characteristic fragmentation by CID, were indicated in the figure. In addition, compared with original rt-PA digestion, there was no un-mutated peptide in the TNK-tPA digest, which further confirmed the mutation is complete. Both the follow-on and the innovator drugs have the same primary and mutated sequence at the same sites.
Figure 2.
Determination of the mutation of KHRR to AAAA (296–299) at T27 peptide from the trypsin digest of TNK-tPA by the LC-MS analysis. The LC-MS elution profile (A), the precursor mass of T27 by FTICR (B), and the CID-MS2 of the precursor (C), with the annotation of the identified peptide sequence indicated in the inserts.
Glycosylation occupancy
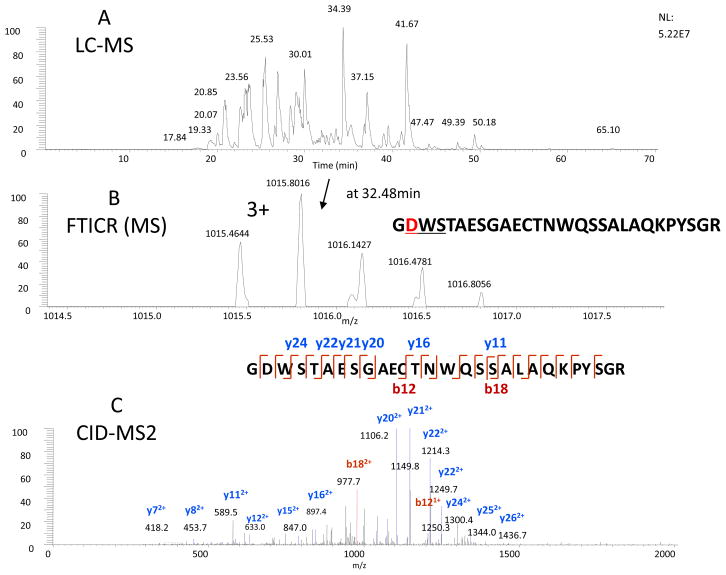
The other two mutation sites occurred in the same tryptic peptide (T11), GN(103)WSTAESGAECTNWQ(117)SSALAQKPYSGR, in which T103 was replaced by N and N117 by Q. As seen, these two mutations moved the glycosylation site from N117 to N103, which resulted to the elimination of high-mannose structure at N117 and with the gain of a complex-type glycan at N103. This change was believed to have a longer half life and higher fibrin-binding specificity than rt-PA.10–12 The full glycan structures of TNK-tPA will be extensively characterized and compared in a separate report. To confirm the gene mutations at these two sites, the protein was deglycosylated by PNGase F, and the remaining peptide backbone (T11) was analyzed. It should be noted that the asparagine (N103) was converted to aspartic acid (D103) after the removal of the glycans by PNGase F. Thus, as shown in Figure 3, the peptide backbone of T11 was identified using the same approach for the identification of T27. If this site (N103) is partially glycosylated, we should observe the non-glycosylated counterpart of T11 as N103, not D103 (which derived from the deglycosylation step). The mass of ~1 Da difference (similar to deamidation) should be readily differentiated by FTMS measurement. We did not observe any non-glycosylated counterpart of T11, which suggests that this site is indeed fully glycosylated. The N-linked site at N448, found as fully glycosylated, was also determined by this approach (see Figure S3 in the supplementary material). The O-linked fucose was identified at T61, based on the addition of fucose to the peptide mass as well as the characteristic neutral loss of fucose by CID-MS2 (see Figure S4 in the supplementary material). The site of fucose attachment was identified by ETD as described in our previous report.13 Both the follow-on and the innovator drugs have the same mutated sequence on the T11 peptide, with the glycosylation occupancy (full) on both N103 and N448 sites as well as at T61 (fucose) on both drugs.
Figure 3.
Determination of the mutation of T103N and N184Q at T11 peptide from the trypsin plus PNGase F digest of TNK-tPA by the LC-MS analysis. The LC-MS elution profile (A), the precursor mass of the deglycosylated T11 by FTICR (B), and the CID-MS2 of the precursor (C), with the annotation of the identified peptide sequence indicated in the inserts.
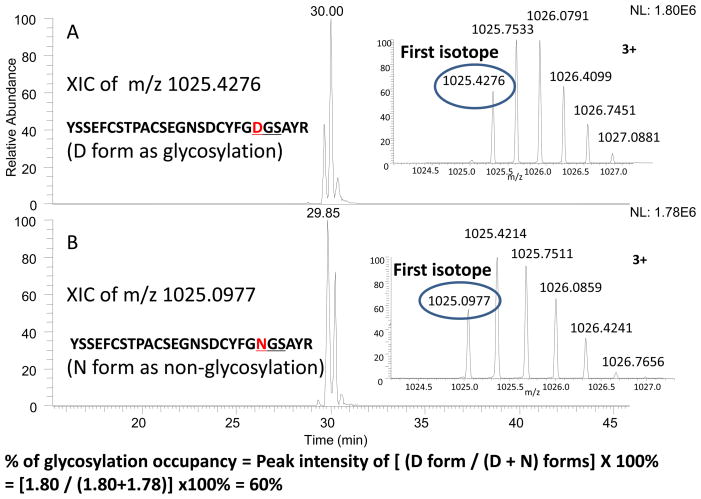
Similarly, the remaining N-linked site (N184) was found partially glycosylated since both N184 and D184 of the corresponding peptides (T17) were found after PNGase F treatment (see Figure 4). The % of glycosylation occupancy was determined by the ratio of the D184 peptide divided by the sum of N184 and D184 peptide intensities, using a similar method as described in our previous paper.5 In this calculation, the observed intensity of D184 was corrected from the D184 intensity derived from the sample without PNGase F treatment (caused by the deamidation of N184, see the next deamidation section). As a result, approximately 60% glycosylation occupancy for innovator and 25% for the follow-on drug were found (~2.5x difference). The glycosylation occupancy at this site has been reported to exhibit differences in biological activity,12, 14–16 as the type II t-PA (non-glycosylated at this site) has higher clot lysis activity than the type I t-PA (fully glycosylated at this site). Thus, the major difference in this glycosylation occupancy, which is related to biological activity, should again raise a concern as to if these products are biosimilar.
Figure 4.
Determination of the glycosylation occupancy at N184 of T17 peptide from the trypsin plus PNGase F digest of TNK-tPA. The extracted ion chromatography of D (aspartic acid) form representing the glycosylation occupancy and N (asparagine) form representing the non-glycosylation occupancy of T17 are shown as Figures 4A and 4B, respectively, with the accurate precursor masses representing for D and N forms indicated in the inserts. The % of glycosylation occupancy was estimated by the ratio of D divided by the sum of D and N peptide intensities, as indicated in the bottom of the figure.
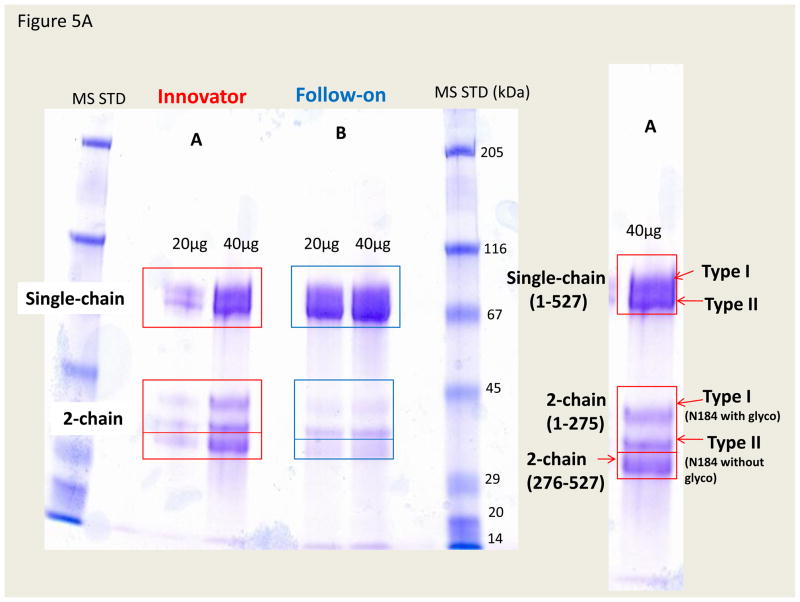
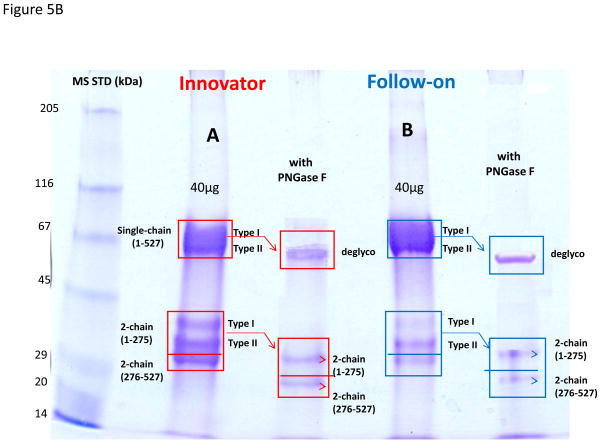
To further confirm the difference detected by the PNGase F treatment of tryptic glycopeptides, we used the SDS-PAGE to separate the glycosylated and non-glycosylated forms of the intact protein for analysis. As shown in Figure 5, both the follow-on and innovator drugs were first reduced and alkylated and then separated by SDS-PAGE side by side as indicated in the figure. It should be noted that alkylation of the reduced form of intact TNK-tPA is necessary prior to running the SDS-PAGE. As shown in the right (enlarged) panel of Figure 5A, the type I t-PA (full glycosylated at N184) eluted with a higher molecular weight than the type II t-PA (non-glycosylated at N184), along with the associated cleaved (2-chain) and intact (single-chain) forms of TNK-tPA. We will discuss analysis of the cleavage of TNK-tPA in the next paragraph. These type I or type II forms, as indicated in the gel of Figure 5A, were further confirmed by the PNGase F treatment. After deglycosylation, the gel bands were simplified to one band (single chain) or two bands (2 chains), as shown in Figure 5B. We also further confirmed their identities by analyzing these gel bands with the observation of the corresponding tryptic peptides with either N184 or D184 (with or without PNGase F treatment). In addition, we compared the ratio of type I and II from these in-gel peptide intensities isolated from the corresponding gel bands (see Figures S5 and S6 in the supplementary material). Again, we observed the similar trend, with the follow-on product at ~20% occupancy and the innovator drug with ~50% occupancy (~2.5× difference). The results, as shown in Table 1, are consistent by these two independent approaches, starting from either the peptide or intact protein separation.
Figure 5.
Figure 5A. Comparison of the reduced and alkylated TNK-tPA from the innovator and follow-on manufacturers by SDS-PAGE separation. The resolved single and 2-chain forms with their associated glycosylation such as type I (3 glycosylation sites) and type II (2 glycosylation sites) are indicated with squares and arrows in the figure.
Figure 5B. Comparison of the reduced and alkylated TNK-tPA (with and without PNGase F treatment) from the innovator and follow-on manufacturers by SDS-PAGE separation. The resolved single and 2-chain forms with their associated glycosylation such as type I (3 glycosylation sites) and type II (2 glycosylation sites) or deglycosylated forms (with PNFase F treatment) are indicated with squares and arrows in the figure.
Table 1.
Determination of glycosylation occupancy of TNK-tPA at N184 site using either PNGase F treatment for tryptic glycopeptides or in-gel digestion of the resolved glycosylated and non-glycosylated intact proteins.
| Product / Method | Innovator | Follow-on |
|---|---|---|
| PNGase F treatment (% occupancy at N184) | 60 (±3) % | 35 (±2) % |
| In-Gel Analysis (% occupancy at N184) | 50 (±5) % | 20 (±3) % |
Non-glycosylated and deglycosylated tryptic peptides and sites:
T17 (163–189): YSSEFCSTPACSEGNSDCYFGDGSAYR (deglycosylated)
T17 (163–189): YSSEFCSTPACSEGNSDCYFGNGSAYR (non-glycosylated)
Average of 3 measurements
2-chain cleavage
In addition to the variation in glycosylation occupancy, the major difference in the single-chain (intact) and 2-chain (cleaved) forms of the two products was readily seen in the gel, as the follow-on product with the higher amount of single-chain and lower 2-chain forms than the innovator drug. The intact (zymogen) form of t-PA (1–527 chain length) needs to be cleaved between R275 and I276 positions to become an active enzyme, which resulted in two separated chains as the 1–275 and 276–527 forms after the linked disulfides were reduced (see Figure 1). The peptide molecular weight of 276–527 is smaller than the 1–275 form. In addition, the 276–527 form has only one glycosylation site (N448) while the 1–275 has 2 glycosylation sites with fully glycosylated at N103 and partially glycosylated at N184. The glycosylated and non-glycosylated forms at N184 show a difference in molecular weight, with the glycosylated (type I) at a higher molecular than the non-glycosylated form (type II) as indicated at the bottom panel of the gel. Similarly, the single-chain form (1–527) with the extra glycosylation (type I) was observed with a higher molecular than the non-glycosylated form (type II) as indicated at the top panel of the gel. These bands which represent different 2-chain forms (i.e. 1–275 and 276–527) were analyzed by LC-MS to confirm their identities. The representative peptides from the 2-chain and single-chain forms were compared to estimate the relative % of the 2-chain cleavage, measured as 40% for the innovator and 10% for the follow-on product (see Figure S7 and S8 in the supplementary material).
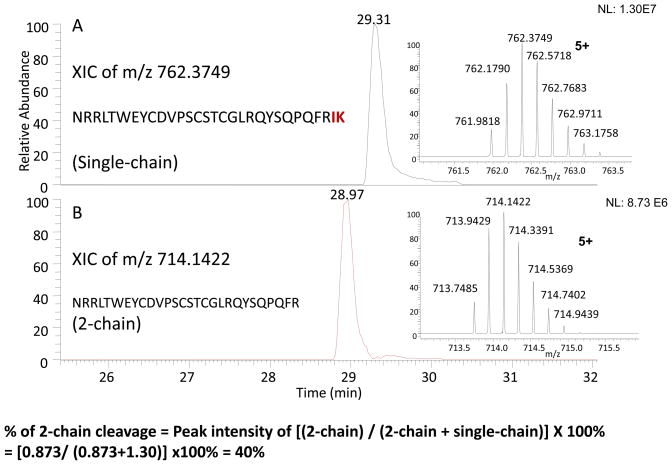
In addition, rather than separating the two intact forms by SDS-PAGE, the mixtures of the intact and 2-chain forms could be digested directly by Lys-C (after reduction and alkylation) since the 2-chain form produced the peptide fragment up to R (cleaved between R275 and I276) and the intact form generated the corresponding peptide length extended to IK (Lys-C could not cleave at a R residue position), as shown in Figures 6A and 6B. Thus, the % of 2-chain cleavage could be determined by the ratio of 2-chain peptide divided by the sum of 2-chain and single-chain peptide intensities. Again, the results, as shown in Table 2, were consistent with the results of SDS-PAGE in which the intact protein forms were separated.
Figure 6.
Determination of the extent of 2-chain cleavage from the Lys-C digest of TNK-tPA. The extracted ion chromatography of the cleaved (2-chain) and un-cleaved (single-chain) peptides are shown as Figures 6A and 6B, respectively. The % of 2-chain was estimated by the ratio of 2-chain divided by the sum of 2-chain and single-chain peptide intensities, as indicated in the bottom of the figure.
Table 2.
Determination of the extent of 2-chain cleavage (between R275 and I276) of TNK-tPA using either Lys-C digested peptide fragments or in-gel digestion of the resolved single and 2-chain forms.
| Product / Method | Innovator | Follow-on |
|---|---|---|
| Lys-C digestion (% 2-chain form) | 40 (±2) % | 8 (±1) % |
| In-gel Analysis (% 2-chain form) | 40 (±5) % | 10 (±3) % |
Lys-C digested peptide with and without 2-chain cleavage: NRRLTWEYCDVPSCSTCGLRQYSQPQFR (248–275)
NRRLTWEYCDVPSCSTCGLRQYSQPQFRIK (248–277)
Average of 3 measurements
Although a significant difference in the amount of 2-chain forms was observed between the innovator and follow-on products, any single-chain should convert into the 2-chain forms on contact with plasmin either with in vitro or in vivo experiments, and thus, the different levels should cause no variation in the biological activity.17 Instead, the observed difference could be used to represent the different manufacturer processes, and the consistency of the % 2-chain production should be a gauge of the manufacturer’s reproducibility.
Oxidation
Oxidation of methionine residues was determined by the observation of +16 Da in the precursor ion and the MS/MS of the precursor ion was used for site assignment, similar to our previous analysis of recombinant human growth hormone.5 Three oxidation sites at Met 207 (T18), Met 445 (T43), and Met 490 (T45) were identified, and the relative % of oxidation (the ratio of non-oxidized and oxidized counterpart) were estimated as shown in Table 3. The relative % of oxidation at these three sites exhibited higher amount in the follow-on as compared to the innovator products. Thus, the % of 2-chain cleavage could be determined by the ratio of 2-chain peptide divided by the sum of 2-chain and single-chain peptide intensities. Again, the results, as shown in Table 2, were consistent with the results of SDS-PAGE in which the intact protein forms were separated.
Table 3.
Determination of the extent of methionine oxidation of TNK-tPA products.
| Oxidation / Products | M 207 (T18) | M 445 (T46) | M 490 (T48) |
|---|---|---|---|
| Innovator | 11 (±1) % | 3 (±0.8) % | 6 (±1) % |
| Follow-on | 21 (±2) % | 6 (±1) % | 7 (±1) % |
Oxidized tryptic peptides and sites:
T18 (190–212): GTHSLTESGASCLPWNSMILIGK (Met 207)
T46 (450–462): TVTDNMLCAGDTR (Met 455)
T48 (490–505): MTLVGIISWGLGCGQK (Met 490)
Average of 5 measurements
Oxidation of t-PA with chloramine-T has been shown to abolish ~40% of fibrin binding and clot lysis activity of t-PA.18 The specific methionine oxidation sites at the Finger (Met 13) and Kringle II regions (Met 207) of t-PA were shown to weaken the interaction between fibrin and t-PA and thus reduce the activation for the subsequent thrombolytic activity. We did not observe Met 13 but did observe Met 207 oxidation, with a higher amount of Met 207 in the follow-on product which should raise the concern of lower efficacy relative to the innovator product.
Deamidation
Similarly, the deamidation of asparagines residues were determined by the observation of +1 Da in the precursor ion and the MS/MS of the precursor ion for site assignment. Two asparagines at N58 (T8) and N 184 (T17) were identified with deamidation. The site at N184 is also a glycosylation site, which should not be deamidated once it is glycosylated. However, this site was partially glycosylated and the non-glycosylated counterpart at this site is prone for deamidation (next to glycine residue). As described in the section of glycosylation occupancy, the follow-on TNK-tPA, with more of the non-glycosylated counterpart at this site, resulted in more deamidation than the innovator product (see the results in Table 4). Similar to oxidation, the relative % of deamidation was calculated from the deamidated species divided by the sum of the non-deamidated and deamidated species.
Table 4.
Determination of the extent of deamidation of TNK-tPA products.
| Deamidation / Products | N 58 (T8) | N 184 (T17) |
|---|---|---|
| Innovator | 13 (±2) % | 29 (±4) % |
| Follow-on | 28 (±3) % | 48 (±5) % |
Deamidated tryptic peptides and sites:
T8 (56–82): CFNGGT(Fu)CQQALYFSDFVCQCPEGFAGK (N58)
T17 (163–189): YSSEFCSTPACSEGNSDCYFGN(non-glycol)GSAYR (N184)
Average of 5 measurements
Although the non-glycosylated form at this site (type II) has higher clot lysis activity than the glycosylated form (type I), the presence of a higher level of deamidation in this region could change the activity. Thus, not only the glycosylation occupancy but also deamidation at this site should be consistent between different manufacturing lots or different manufacturers.
Disulfide linkages
In our previous report we successfully achieved mapping the connectivity of disulfide linkages using mass spectrometry with electron transfer and collision induced dissociation,6 in which several disulfide linkages of t-PA were assigned. In this study, the disulfide-linked peptides have the identical sequences in TNK-tPA as in t-PA. Thus, these assignments were straight forward for TNK-tPA on both innovator and follow-on products (see Figure S9 for one of the assignments in the supplementary material). The complete mapping of all 17 disulfide linkages has just been reported in a separate paper but based on our identifications so far,19 both the innovator and follow-on drugs have the same disulfide-linkages.
Conclusions
The comprehensive characterization and comparison of complex glycoprotein products from innovator and follow-on manufacturers were achieved using LC-MS analysis of the separated intact proteins as well as their enzymatic peptide mixtures. For such a complex molecule, to evaluate the comparability between the innovator and follow-on products, the analysis strategy was focused on regions that could impact the biologic activity.
A main concern was the observation of different glycosylation occupancy at N184, which could influence the clot lysis activity. Although the other modifications such as the deamidation at N184 and oxidation at M207 could also impact the activity, the capability of downstream purification and the formulation process to minimize the deamidation and oxidation should lessen the concern. However, the amount of glycosylation occupancy is not easy to be changed by the downstream processes or even at the beginning step of cell culture condition. Thus, this occupancy difference raises the question of whether these two products are indeed similar or not. The % chain cleavage at the activation site (R275 and I276) also greatly varied, but the nature of this protein is to convert all remaining single chain to 2-chain rapidly once it is administrated to a patient, and thus the observed difference in this case should be less of a concern.
The quantitative comparison of the % glycosylation occupancy and 2-chain cleavage was performed by two independent approaches, starting from either the peptide or intact protein separation. The quantitation by the peptide approach, which directly digested the mixture of various intact protein forms (type I, II, single, and 2-chain forms), was simple but required the identification and quantitation of the characteristic peptides representing the various forms, e.g., the peptides containing the glycosylation or cleavage sites. On the other hand, the direct protein analysis required the separation of various intact forms, a more complicated procedure than peptide separation. Nevertheless, once protein separation was achieved (using SDS-PAGE in this study), quantitation could be simplified since any peptide fragments from the corresponding gel bands could be used for relative comparison (no need to use the characteristic peptides). Thus, one of these representing peptides (highly reproducible from in-gel and LC-MS analysis) from each of the corresponding gel bands was used for relative comparison. In addition to the complementary (orthogonal) comparison, the intact protein separation (gel image) readily revealed the major differences between the innovator and follow-on products, and that directed our focus for this analysis. Other chromatographic approaches, such as hydrophobic interaction chromatography, have been shown to effectively separate the various intact forms (type I, II, single, and 2-chain) of rt-PA, and these approaches should be able to be adopted for the separation of TNK-tPA as well.20 We used SDS-PAGE initially, since the separation conditions should be more general for many glycoproteins in comparison to chromatographic approaches (rather specific). The detailed characterization and comparison of all glycan structures at each site may not be necessary, since several other major differences have already been defined in this work. Nevertheless, the full characterization and quantitative comparison of the glycan structures will be presented shortly in a separate report, for the purpose of evaluating our capability to differentiate structures using state of the art proteomic techniques. The application of the recent advanced proteomic techniques is proven again to be valuable for the comparison of follow-on or biosimilar products, even for complicated glycoproteins.
Supplementary Material
Acknowledgments
W.S. Hancock acknowledges the support of this work from the funding of NCI grant CA 128427, and Korean WCU grant R31-2008-000-10086-0. B.L. Karger acknowledges the support of NIH grant GM 15847. Contribution Number 964 from the Barnett Institute.
References
- 1.Schellekens H. J Nephrol. 2008;21(4):497–502. [PubMed] [Google Scholar]
- 2.Wu SL, Kim J, Hancock WS, Karger BL. J Proteome Res. 2005;4:1155–67. doi: 10.1021/pr050113n. [DOI] [PubMed] [Google Scholar]
- 3.Wu SL, Kim J, Bandle RW, Liotta L, Petricoin E, Karger BL. Mol Cell Proteomics. 2006;5:1610–27. doi: 10.1074/mcp.M600105-MCP200. [DOI] [PubMed] [Google Scholar]
- 4.Zheng X, Wu SL, Hancock WS. Int J Pharm. 2006;322:136–145. doi: 10.1016/j.ijpharm.2006.06.038. [DOI] [PubMed] [Google Scholar]
- 5.Jiang H, Wu SL, Karger BL, Hancock WS. Biotechnol Prog. 2009;25(1):207–218. doi: 10.1002/btpr.72. [DOI] [PubMed] [Google Scholar]
- 6.Wu SL, Jiang H, Lu Q, Dai S, Hancock WS, Karger BL. Anal Chem. 2009;81:112–22. doi: 10.1021/ac801560k. [DOI] [PMC free article] [PubMed] [Google Scholar]
- 7.Verstraete M, Arnold AE, Brower RW, Collen D, de Bono DP, De Zwaan C, Erbel R, Hillis WS, Lennane RJ, Lubsen J, et al. Am J Cardiol. 1987;60(4):231–7. doi: 10.1016/0002-9149(87)90219-0. [DOI] [PubMed] [Google Scholar]
- 8.Neuhaus KL, von Essen R, Tebbe U, Vogt A, Roth M, Riess M, Niederer W, Forycki F, Wirtzfeld A, Maeurer W, et al. J Am Coll Cardiol. 1992;19(5):885–91. doi: 10.1016/0735-1097(92)90265-o. [DOI] [PubMed] [Google Scholar]
- 9.Schehr RS. Nat Biotechnol. 1996;14(11):1549–54. doi: 10.1038/nbt1196-1549. [DOI] [PubMed] [Google Scholar]
- 10.Cannon CP, McCabe CH, Gibson CM, Ghali M, Sequeira RF, McKendall GR, Breed J, Modi NB, Fox NL, Tracy RP, Love TW, Braunwald E. Circulation. 1997;95(2):351–6. doi: 10.1161/01.cir.95.2.351. [DOI] [PubMed] [Google Scholar]
- 11.Benedict CR, Refino CJ, Keyt BA, Pakala R, Paoni NF, Thomas GR, Bennett WF. Circulation. 1995;92(10):3032–40. doi: 10.1161/01.cir.92.10.3032. [DOI] [PubMed] [Google Scholar]
- 12.Keyt BA, Paoni NF, Refino CJ, Berleau L, Nguyen H, Chow AA. Proc Natl Acad Sci. 1994;91:3670–3674. doi: 10.1073/pnas.91.9.3670. [DOI] [PMC free article] [PubMed] [Google Scholar]
- 13.Wu SL, Hühmer AF, Hao Z, Karger BL. J Proteome Res. 2007;6:4230–44. doi: 10.1021/pr070313u. [DOI] [PMC free article] [PubMed] [Google Scholar]
- 14.Berg DT, Burck PJ, Berg DH, Grinnell BW. Blood. 1993;81:1312–1322. [PubMed] [Google Scholar]
- 15.Wittwer AJ, Howard SC, Carr LS, Harakas NK, Feder J, Parekh RB, Rudd PM, Dwek RA, Rademacher TW. Biochemistry. 1989;28:7662–7669. doi: 10.1021/bi00445a022. [DOI] [PubMed] [Google Scholar]
- 16.Parekh RB, Dwek RA, Rudd PM, Thomas JR, Rademacher TW, Warren T, Wun TC, Hebert B, Reitz B, Palmier M, Ramabhadran T, Tiemeier DC. Biochemistry. 1989;28:7670–7679. doi: 10.1021/bi00445a023. [DOI] [PubMed] [Google Scholar]
- 17.Rijken DC, Hoylaerts M, Collen D. J Biol Chem. 1982;257(6):2920–5. [PubMed] [Google Scholar]
- 18.Stief TW, Martin E, Jimenez J, Digon J, Rodriguez JM. Thrombosis Research. 1991;61:191–200. doi: 10.1016/0049-3848(91)90095-e. [DOI] [PubMed] [Google Scholar]
- 19.Wu SL, Jiang H, Hancock WS, Karger BL. Anal Chem. 2010 May 19; doi: 10.1021/ac100766r. [Epub ahead of print] [DOI] [PMC free article] [PubMed] [Google Scholar]
- 20.Wu SL. LC-GC. 1992;10:430. [Google Scholar]
Associated Data
This section collects any data citations, data availability statements, or supplementary materials included in this article.


