

Abstract
OBJECTIVE
We conducted a prospective randomized trial to compare the clinical impact of conventional risk factor modification to that associated with coronary artery calcium (CAC) scanning.
BACKGROUND
Although CAC scanning predicts cardiac events, its impact on subsequent medical management and CAD risk is not known.
METHODS
We assigned 2,137 volunteers to groups that did versus did not undergo CAC scanning before risk factor counseling. The primary end-point was 4-year change in CAD risk factors and Framingham Risk Score (FRS). We also compared the groups for differences in downstream medical resource utilization.
RESULTS
Compared to the no-scan group, the scan group showed a net favorable change in systolic blood pressure (p=0.02), LDL-cholesterol (p=0.04), waist circumference for those with increased abdominal girth (p=0.01), and tendency to weight loss among overweight subjects (p=0.07). While mean FRS rose in the no-scan group, it remained static in the scan group (0.7±5.1 versus 0.002±4.9, p=0.003). Within the scan group, increasing baseline CAC score was associated with a dose-response improvement in systolic and diastolic blood pressure (p<0.001), total cholesterol (p<0.001), LDL-cholesterol (p<0.001), triglycerides (p<0.001), weight (p<0.001) and FRS (p=0.003). Downstream medical testing and costs in the scan group were comparable versus the no-scan group, balanced by lower and higher resource utilization for those with normal CAC scans and CAC scores ≥400, respectively.
CONCLUSIONS
As compared to no scanning, randomization to CAC scanning was associated with superior CAD risk factor control without increasing downstream medical testing. Further study of CAC scanning for improvement of cardiovascular outcomes may be warranted. (ClinicalTrials.gov, number NCT00927693).
Keywords: coronary calcification, risk factors, coronary artery disease, prevention
INTRODUCTION
Coronary artery calcium (CAC) scanning can predict adverse clinical events (1-4), but its direct impact on future coronary artery disease (CAD) risk and downstream medical costs, relative to that of conventional medical practice, is not yet known. To study this issue, we initiated the Early Identification of Subclinical Atherosclerosis by Noninvasive Imaging Research (EISNER) trial. This prospective randomized trial was designed to test the primary hypothesis that performing CAC scanning would lead to a beneficial sustained four-year effect on individuals’ CAD risk factors. Secondarily, we assessed the impact of CAC scanning on downstream medical resource utilization and healthcare costs.
METHODS
The trial participants consisted of 2,137 volunteers who were recruited between May 2001 and May 2005 at Cedars-Sinai Medical Center (CSMC). We preferentially selected subjects with CAD risk factors and excluded subjects with a history of cardiac or cerebrovascular disease or chest pain, age ≥80 years, pregnancy, significant medical co-morbidity, and prior coronary catheterization or prior CAC scanning. Following recruitment, subjects were randomized into a group that was either scheduled for CAC scanning (“scan” group) or not scheduled for calcium scanning (“no-scan” group). To encourage subjects’ enrollment into our study, the ratio of randomization was 2:1 for receiving a CAC scan. This research was approved by the CSMC Institutional Review Board and all subjects signed informed consent.
Baseline clinical assessment
Baseline measurements were obtained for the following: fasting total cholesterol, high density lipoprotein (HDL), low density lipoprotein (LDL) cholesterol, triglycerides, and fasting serum glucose; systolic and diastolic blood pressure measurements; height; weight; and waist circumference. Physical activity was assessed dichotomously (yes/no) according to subjects’ response to the following question: “Do you exercise regularly (3-4 times a week) for at least 30 minutes each time?” Ten-year risk of CAD was calculated by the Framingham risk score (FRS) in accordance with published guidelines (5). Subjects with diabetes were automatically assigned a high risk FRS of 20%, or higher if so calculated (6).
Risk factor counseling
At the baseline examination, one of our nurse practitioners, each having been trained regarding the need for impartiality and consistency in counseling, conducted a private risk factor counseling session. To further standardize counseling, the nurse practitioner printed a customized risk factor management packet for each subject containing the American Heart Association guidelines on cardiac risk factors (7), subjects’ results for each risk factor, and information on how to improve their risk profiles. The nurse practitioner reviewed the packet with each subject first, and then additionally also reviewed the CAC images, and CAC score and percentile score with subjects in the scan group. Subjects were instructed that the presence of any calcium constituted evidence of atherosclerosis. To preserve subject anonymity as required by our Institutional Review Board, test results were not sent directly to subjects’ physicians, but subjects were given two copies of their anonymized CAC scan report and were encouraged to share their results with their physician.
Coronary calcium scanning
Scanning was performed using electron beam (GE-Imatron Inc., San Francisco, California) or multislice computed tomography (Siemens Medical Systems, Forchheim, Germany). The imaging protocol involved acquiring a single scan of approximately 30 to 40 slices of 3mm or 2.5mm thickness (8). Foci of CAC were identified by an experienced radiographic technologist and scored using semiautomatic commercial software on a NetraMD workstation. Total calcium score was determined by summing lesion-specific scores, calculated as the product of the area of each calcified focus and peak CT number derived according to the Agatston method (9). Estimated radiation dose ranged from 1-2 mSv.
4-year clinic visit
Trial participants were asked to return for a follow-up clinic visit at four years during which all assessments obtained at baseline were repeated and CAC scanning was performed in all subjects. Of the 2,137 enrolled subjects, 713 (33.4%) were randomized to the no-scan group and 1,424 (66.6%) to the scan group (Figure 1). Of these, 584 (81.9%) no-scan and 1256 (88.2%) scan subjects completed the follow-up clinic evaluation and questionnaire (p < 0.001) There were 35 (4.9%) no scan and 38 (2.7%) scan subjects who could not return for the follow-up clinic evaluation and completed the questionnaire only; these subjects were not assessed for clinic-determined risk factors at four years. Within the no-scan group, 52 (7.3%) were lost to follow-up, 17 (2.4%) withdrew from the trial, and 4 (0.6%) died before four-year follow-up. Within the scan group, 61 (4.3%) were lost to follow-up, 13 (0.9%) withdrew, and 17 (1.2%) died before follow-up. There were 17 (2.4%) no-scan and 39 (2.7%) scan subjects who indicated they met eligibility criteria at enrollment but later disclosed an exclusion criterion that resulted in their subsequent exclusion.
Figure 1.
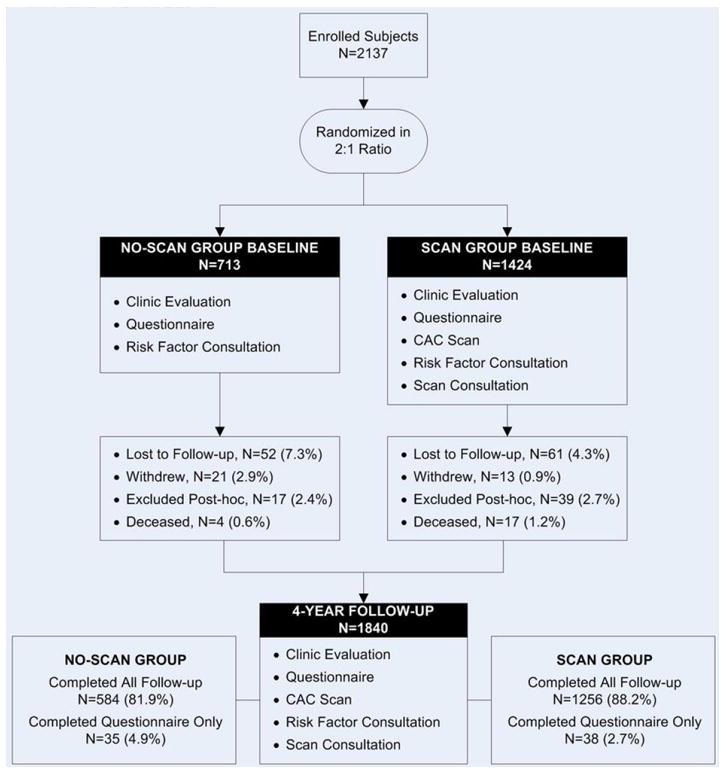
Summary of trial design and disposition of subjects at four-year follow-up. CAC = coronary artery calcium.
Primary outcomes
The primary outcome of our trial was change in CAD risk profiles at four years among the scan versus no-scan, including change in global risk as assessed by FRS.
Secondary outcomes
Secondary outcomes included comparison of the randomized groups relative to rates of downstream tests and procedures, health care costs, and occurrence of adverse clinical events. To assess costs, we applied nationwide, average Medicare diagnosis-related group reimbursement rates using the PC Pricer Prospective Payment System estimator. Outpatient service costs were derived by use of the Outpatient Prospective Payment amounts (nationwide and specific locality) based on Healthcare Common Procedure Codes. The Medicare planner for retail and mail-order pharmacy charges were used to derive drug costs in our trial (10). Costs were inflation-adjusted and discounted at a rate of 3% per year. A $150 charge was assigned for CAC scanning (although it was performed at no charge). Clinical events included cardiac and all-cause death and nonfatal myocardial infarction. Cause of death status was confirmed by medical record review. Diagnosis of myocardial infarction was confirmed by enzymatic elevation and electrocardiographic changes consistent with acute infarction.
Statistical analyses
Changes in risk factors were mainly expressed as the clinical value at 4 years minus the value at baseline, with negative change indicating a reduction in risk factor. All data were analyzed using STATA version 11 (www.stata.com). Continuous variables were expressed as mean ± standard deviation or median (25th, 75th percentile) and compared using two sample t-tests for approximately normal variables or Wilcoxon rank sum test for non-normal variables. Likewise, continuous variables in more than two groups were compared using one-way ANOVA or Kruskal-Wallis for non-normal variables, and if ordered, were also tested using Cuzick’s test for trend. Categorical variables were compared using Pearson’s Chi-squared test or Fisher’s Exact test where there were cell counts of <6. Ordered categorical variables were further assessed using the Chi-squared test for trend. Annual event rates were calculated as the % number of events divided by person-years. Progression of CAC scores in the scan group were assessed by comparing the CAC score at four years to that at baseline. Relative change in CAC scores were assessed according to the formula developed by the MESA study: ln(CACy4+25) - ln(CACbl+25). We identified progression of CAC to have occurred if subjects converted from a negative to a positive scan or if subjects were ≥75th percentile for progression by the MESA formula. All clinically relevant predictors were tested using logistic regression with progression as the outcome both alone and in conjunction with age, gender, and length of follow-up time. Furthermore, both forward and backward stepwise logistic regression was to find the best predictors of progression where candidate variables with p-value<0.05 were entered and those with p-value>0.10 were removed from the model. Separate models were made for baseline and treatment variables before combining into a single overall model. Models were evaluated for goodness of fit and other parameters (results not shown). A p-value of <0.05 was considered significant.
RESULTS
Subject characteristics
The clinical characteristics of the two randomized groups are shown in Table 1. The two groups were comparably matched in terms of age, gender, socioeconomic factors, cardiac risk factors, medication use, and FRS.
Table 1.
Baseline Characteristics.
| Parameters | Overall (n=1934) | No-Scan Group (n=623) | Scan Group (n=1311) | P-Value |
|---|---|---|---|---|
| Age | 58.5±8.4 | 58.4±8.2 | 58.6±8.5 | 0.75 |
| Male Sex | 1015 (52.5%) | 327 (52.5%) | 688 (52.5%) | 1.00 |
| Race/Ethnicity | ||||
| Caucasian | 1487 (77.0%) | 493 (79.1%) | 994 (76.0%) | |
| African-American | 97 (5.0%) | 26 (4.2%) | 71 (5.4%) | |
| Asian/Pacific Islander | 202 (10.5%) | 62 (10.0%) | 140 (10.7%) | |
| Hispanic/Latino | 81 (4.2%) | 23 (3.7%) | 58 (4.4%) | |
| Other | 64 (3.3%) | 19 (3.0%) | 45 (3.5%) | 0.65 |
| Level of education | ||||
| <High school | 13 (0.7%) | 3 (0.5%) | 10 (0.8%) | |
| High school/tech | 156 (8.3%) | 43 (7.1%) | 113 (8.9%) | |
| Some college | 412 (21.9%) | 137 (22.5%) | 275 (21.6%) | |
| College | 533 (28.3%) | 197 (32.3%) | 336 (26.4%) | |
| Graduate education | 767 (40.8%) | 230 (37.7%) | 537 (42.3%) | 0.87* |
| Annual income | ||||
| < $20,000 | 75 (4.2%) | 26 (4.5%) | 49 (4.0%) | |
| $20,000- $39,000 | 188 (10.5%) | 58 (10.0%) | 130 (10.7%) | |
| $40,000 - $59,000 | 262 (14.6%) | 77 (13.3%) | 185 (15.3%) | |
| $60,000 - $79,000 | 289 (16.1%) | 97 (16.8%) | 192 (15.8%) | |
| $80,000 - $99,000 | 243 (13.6%) | 78 (13.5%) | 165 (13.6%) | |
| ≥ $100,000 | 734 (41.0%) | 243 (42.0%) | 491 (40.5%) | 0.55* |
| Cardiac Risk Factors | ||||
| Hypertension | 1108 (57.3%) | 355 (57.0%) | 753 (57.4%) | 0.85 |
| High Cholesterol | 1498 (77.5%) | 468 (75.1%) | 1030 (78.6%) | 0.09 |
| Diabetes | 158 (8.2%) | 52 (8.4%) | 106 (8.1%) | 0.85 |
| Past-Smoker | 803 (41.5%) | 254 (40.8%) | 549 (41.9%) | 0.65 |
| Current-Smoker | 111 (5.7%) | 37 (5.9%) | 74 (5.6%) | 0.80 |
| Family history of CAD | 513 (26.5%) | 155 (24.9%) | 358 (27.3%) | 0.26 |
| Body Mass Index (kg/m2) | 26.4 (23.9, 29.9) | 26.3 (23.8, 29.7) | 26.5 (23.9, 29.9) | 0.23 |
| Waist circumference (inches) | 36 (32.5, 39) | 36 (32.3, 39) | 36 (32.5, 39.3) | 0.36 |
| Medications | ||||
| Hypertension Medications | 622 (32.2%) | 199 (32.1%) | 423 (32.3%) | 0.94 |
| ACE Inhibitors | 205 (10.6%) | 62 (10.0%) | 143 (10.9%) | 0.54 |
| Beta-blockers | 168 (8.7%) | 64 (10.3%) | 104 (8.0%) | 0.08 |
| Calcium blockers | 112 (5.8%) | 29 (4.7%) | 83 (6.4%) | 0.15 |
| Diuretics | 225 (11.7%) | 78 (12.6%) | 147 (11.2%) | 0.39 |
| ARBs | 104 (5.4%) | 31 (5.0%) | 73 (5.6%) | 0.60 |
| Others | 51 (2.7%) | 13 (2.1%) | 38 (2.9%) | 0.30 |
| Lipid medications | 501 (26.0%) | 169 (27.3%) | 332 (25.4%) | 0.37 |
| Statins | 452 (23.5%) | 152 (24.6%) | 300 (22.9%) | 0.43 |
| Niacin | 35 (1.8%) | 11 (1.8%) | 24 (1.8%) | 0.93 |
| Other lipid medications | 56 (2.9%) | 20 (3.2%) | 36 (2.8%) | 0.56 |
| Diabetic medications | 79 (4.1%) | 28 (4.5%) | 51 (3.9%) | 0.53 |
| Aspirin | 246 (12.8%) | 87 (14.1%) | 159 (12.2%) | 0.24 |
| Clinical Lab Values | ||||
| Total cholesterol (mg/dl) | 213 (187, 239) | 213 (187, 238) | 213 (187, 240) | 0.44 |
| HDL cholesterol (mg/dl) | 52 (42, 65) | 53 (42, 65) | 52 (42, 64) | 0.58 |
| LDL cholesterol (mg/dl) | 132 (110, 157) | 130 (109, 155) | 133 (111, 158) | 0.15 |
| Triglycerides (mg/dl) | 112 (79, 164) | 113 (78, 166) | 112 (79, 161) | 0.99 |
| Fasting glucose (mg/dl) | 93 (86, 101) | 94 (86, 101) | 93 (86, 101) | 0.40 |
| Systolic BP (mm/Hg) | 131 (120, 143) | 130 (119, 142) | 131 (121, 144) | 0.03 |
| Diastolic BP (mm/Hg) | 81 (75, 89) | 81 (75, 89) | 81 (76, 89) | 0.41 |
| Rest heart rate (beats/minute) | 66 (59, 72) | 66 (59, 72) | 66 (60, 72) | 0.73 |
ACE – angiotension converting enzyme; ARBs = angiotension receptor blockers; LDL = low density lipoprotein; HDL = high density lipoprotein; BP = blood pressure.
Values in () represent either percentages or 25th and 75th percentile values.
Test for trend
Comparison of CAD risk factors at four years in the randomized groups
Table 2 shows the change in CAD risk factor status in the randomized groups at four-year follow-up. Compared to the no-scan group, the scan group had significantly greater reduction in systolic blood pressure and serum LDL-cholesterol levels, reduction in waist circumference for those with increased abdominal girth at baseline, and modest tendency towards less weight gain among those subjects who were overweight (body mass index≥25 kg/m2). There was no significant difference between the two groups with respect to HDL-cholesterol, triglyceride and glucose levels, smoking cessation, and new exercise activity. The four-year mean FRS score increased in the no-scan group compared to baseline FRS, but remained essentially unchanged in the scan group: 0.7±5.1 versus 0.002±4.9, p=0.003.
Table 2.
Change in clinical risk factors, medical treatment, and incurred costs
| Parameters | Study Group at Baseline | No-Scan Group | Scan Group | P-Value |
|---|---|---|---|---|
| CAD risk factors | ||||
| Baseline SBP (mm/Hg) | All subjects | 130 (119, 142) | 131 (121, 144) | 0.03 |
| Change in SBP (mm/Hg) | All subjects | -5 (-16, 6) | -7 (-18, 3) | 0.02 |
| Baseline DBP (mm/Hg) | All subjects | 81 (75, 89) | 81 (76, 89) | 0.41 |
| Change in DBP (mm/Hg) | All subjects | -4 (-12, 4) | -5 (-12, 3) | 0.50 |
| Baseline CHOL (mg/dl) | All subjects | 213 (187, 238) | 213 (187, 240) | 0.44 |
| Change in CHOL (mg/dl) | All subjects | -16 (-44, 7) | -21 (-49, 6) | 0.08 |
| Baseline LDL (mg/dl) | All subjects | 130 (109, 155) | 133 (111, 158) | 0.15 |
| Change in LDL (mg/dl) | All subjects | -11 (-41, 10) | -17 (-44, 7) | 0.04 |
| Baseline HDL (mg/dl) | All subjects | 53 (42, 65) | 52 (42, 64) | 0.58 |
| Change in HDL (mg/dl) | All subjects | -1 (-7, 5) | -1 (-6, 5) | 0.28 |
| Baseline triglycerides (mg/dl) | All subjects | 113 (78, 166) | 112 (79, 161) | 0.99 |
| Change in triglycerides (mg/dl) | All subjects | -9 (-37, 14) | -10 (-42, 14) | 0.40 |
| Baseline glucose (mg/dl) | All subjects | 94 (86, 101) | 93 (86, 101) | 0.40 |
| Change in glucose (mg/dl) | All subjects | -2 (-8, 6) | 0 (-8, 7) | 0.16 |
| Baseline weight (pounds) | BMI ≥25 | 186 (167, 210) | 188 (166, 209) | 0.66 |
| Change in weight (pounds) | BMI ≥25 | 1 (-5, 8) | 0 (-6, 7) | 0.07 |
| Baseline WC (inches) | M>40,W>35 | 41 (38, 43) | 41.3 (38, 43.5) | 0.19 |
| Change in WC (inches) | M>40,W>35 | 1 (-2, 3) | 0 (-3, 2) | 0.01 |
| Quit Smoking | Smokers | 16/36 (44%) | 34/69 (49%) | 0.64 |
| Exercise ≥3 times/week | Non-exercisers | 95/266 (36%) | 214/582 (37%) | 0.77 |
| Baseline FRS | All subjects | 6 (2, 12) | 6 (2, 12) | 0.45 |
| Change in FRS | All subjects | 0 (0, 2) | 0 (-1, 2) | 0.003 |
| New Medications | ||||
| Lipid medications | No lipid meds | 109/441 (25%) | 284/963 (29%) | 0.06 |
| Hypertension medications | No BP meds | 77/419 (18%) | 214/877 (24%) | 0.02 |
| Diabetic medications | No diabetic meds | 15/595 (3%) | 40/1260 (3%) | 0.44 |
| Aspirin | No aspirin | 39/525 (7%) | 92/1130 (8%) | 0.62 |
| Medication adherence | ||||
| Lipid medications | On lipid meds | 145/168 (86%) | 281/325 (86%) | 0.96 |
| Hypertension medications | On BP meds | 173/192 (90%) | 388/414 (94%) | 0.11 |
| Diabetic medications | On diabetic meds | 26/28 (93%) | 45/51 (88%) | 0.71 |
| Aspirin | On aspirin | 26/84 (31%) | 43/158 (27%) | 0.54 |
| Performed procedures | ||||
| Resting ECG | All subjects | 380 (61.0%) | 767 (58.5%) | 0.30 |
| Stress Nuclear | All subjects | 62 (10.0%) | 169 (12.9%) | 0.06 |
| Stress Echo | All subjects | 102 (16.4%) | 195 (14.9%) | 0.39 |
| Any Stress Test * | All subjects | 211 (33.9%) | 454(34.6%) | 0.74 |
| Cardiac CT | All subjects | 44 (7.1%) | 101 (7.7%) | 0.62 |
| Carotid Ultrasound | All subjects | 88 (14.1%) | 167 (12.7%) | 0.40 |
| Cardiac catheterization | All subjects | 18 (2.9%) | 42 (3.2%) | 0.71 |
| Coronary Revascularization | All subjects | 11 (1.8%) | 30 (2.3%) | 0.46 |
| Medical costs (in US dollars) | ||||
| Procedure costs | All subjects | 712 (523, 901) | 904 ** (739, 1,056) | 0.56 |
| Medication Costs | All subjects | 2,937 (2,620, 3,254) | 3,149 (2,924, 3,374) | 0.09 |
| Lipid lowering medication | All subjects | 721 (625, 817) | 748 (682, 813) | 0.06 |
| Anti-hypertensive medications | All subjects | 761 (659, 863) | 892 (819, 966) | 0.02 |
| Diabetic medications | All subjects | 545 (415, 675) | 533 (444, 623) | 0.87 |
| Aspirin | All subjects | 26 (20, 33) | 27 (22, 31) | 0.92 |
| All costs | All subjects | 3,649 (3,263, 4,035) | 4,053 (3,739, 4,367) | 0.09 |
stress nuclear, stress echo, or treadmill exercise ECG.
Includes a $150 charge for CAC scanning.
CHOL = cholesterol; SBP = systolic blood pressure; DBP= diastolic blood pressure; WC = waist circumference; FRS = Framingham Risk Score; CT = computed tomography.
Comparison of medical resource utilization in the randomized groups
More scan than non-scan subjects had initiation of new anti-hypertensive medication use and there was a modest tendency towards greater use of lipid-lowering medications. Within both groups, continuation of lipid lowering and anti-hypertensive medication remained high at four years for those on these medications at baseline. As shown in Table 2, the two randomized groups did not differ in four-year utilization of stress tests, carotid ultrasound studies, noninvasive and invasive coronary angiogram studies, and revascularization procedures. The overall medical procedure costs were comparable in both randomized groups, although medication costs were approximately 7% higher in the scan group.
Comparison of clinical events in the randomized groups
Within our study population, there were 3 cardiac deaths (annualized cardiac mortality rate of 0.04%) and 21 all-cause deaths (annualized all-cause mortality rate of 0.3%). One cardiac death (0.2%) and 4 all-cause deaths (0.6%) occurred in the no-scan group and two cardiac deaths (0.2%) and 17 all-cause deaths occurred in the scan group (p = 1.00 for cardiac and p = 0.24 for all-cause mortality). Myocardial infarction occurred in 2 (0.3%) no-scan and 10 (0.8%) scan subjects (p = 0.36). The combined number of deaths and/or myocardial infarction were 6 (1.0%) in the no-scan group and 27 (2.1%) in the scan group (p = 0.08).
Impact of baseline CAC score on four-year CAD risk profiles
Within the scan group, increasing baseline CAC score was associated with a proportionally greater improvement in most CAD risk factors at follow-up (Table 3). An inverse dose-response relationship was observed between increasing baseline CAC scores and systolic and diastolic blood pressure, serum cholesterol, LDL-cholesterol, and triglycerides. In addition, greater weight loss was noted among overweight subjects with CAC scores ≥100 at baseline and for those with increased abdominal girth, the greater decline occurred among those with CAC scores ≥400 at baseline. There was also a trend toward more exercise with increasing CAC scores. The FRS rose in subjects with a zero CAC score, but decreased in those with evidence of CAC at baseline.
Table 3.
Change in clinical risk factors, medical treatment, and incurred costs according to CAC score
| Parameters | Study Group at Baseline | CAC 0 (n = 631) | CAC 1-99 (n = 400) | CAC 100-399 (n = 171) | CAC ≥ 400 (n = 109) | P-Value (trend) |
|---|---|---|---|---|---|---|
| CAD risk factors | ||||||
| Baseline SBP | All subjects | 128 (118, 140) | 132 (122, 144.5) | 138 (122, 149) | 140 (125, 150) | <0.001 |
| Change in SBP | All subjects | -4 (-16, 5) | -9 (-20, 2) | -10.5 (-21, 1) | -9 (-24, 2) | <0.001 |
| Baseline DBP | All subjects | 80 (74, 88) | 82 (76, 90) | 83 (78, 90) | 82 (78, 90) | <0.001 |
| Change in DBP | All subjects | -4 (-11, 5) | -7 (-14, 3) | -5 (-14, 2) | -8 (-12, -1) | <0.001 |
| Baseline CHOL | All subjects | 214 (190, 239) | 211 (186.5, 242) | 215 (188, 240) | 210 (184, 237) | 0.51 |
| Change in CHOL | All subjects | -15 (-42, 9) | -21 (-50, 5) | -30 (-54, -7) | -39.5 (-78, 0) | <0.001 |
| Baseline LDL | All subjects | 133 (111, 156) | 133 (109, 160) | 135 (109.5, 157) | 135 (111, 158) | 0.85 |
| Change in LDL | All subjects | -12 (-37, 10) | -18.5 (-50.5, 7) | -25 (-55, -4) | -29 (-62, 3) | <0.001 |
| Baseline HDL | All subjects | 54 (44, 67) | 51 (40, 62) | 50 (41, 64) | 49 (42, 59) | 0.001 |
| Change in HDL | All subjects | -1 (-7, 5) | -2 (-6, 5) | 0 (-6, 5) | 0 (-5, 4) | 0.46 |
| Baseline triglycerides | All subjects | 106 (78, 154) | 113 (79, 165.5) | 120 (82, 180) | 124 (86, 162) | 0.003 |
| Change in triglycerides | All subjects | -8 (-35, 14) | -8 (-40, 19) | -16 (-53, 8) | -25 (-67, 4) | <0.001 |
| Baseline glucose | All subjects | 91 (85, 98) | 94 (86, 103) | 94 (87, 102) | 97 (89, 108) | <0.001 |
| Change in glucose | All subjects | -1 (-8, 6) | -1 (-8, 6) | 1 (-7, 9) | 0 (-10, 11) | 0.34 |
| Baseline weight | BMI ≥25 | 186 (165, 206) | 188.5 (169, 208) | 197 (169, 222) | 186 (160, 214) | 0.15 |
| Change in weight | BMI ≥25 | 1 (-5, 8) | 0 (-6, 6.5) | -2 (-9, 3.5) | -3 (-10, 3) | <0.001 |
| Baseline WC | M>40,W>35 | 41 (37.8, 43) | 41.3 (39, 43) | 42 (41, 43.5) | 43 (39.6, 45.8) | 0.002 |
| Change in WC | M>40,W>35 | -0.5 (-3.8, 2) | 0.3 (-2, 2) | 1 (-1, 2) | -1 (3.3, 0.5) | 0.56 |
| Quit Smoking | Smokers | 15/27 (56%) | 13/24 (54%) | 3/11 (27%) | 3/7 (43%) | 0.22 |
| EX ≥3times/week | Non-exercisers | 92/284 (32%) | 75/188 (40%) | 30/74 (41%) | 17/36 (47%) | 0.03 |
| Baseline FR | All subjects | 4 (2, 8) | 8 (4, 16) | 10 (4, 16) | 16 (8, 20) | <0.001 |
| Change in FRS | All subjects | 0 (-1, 2) | 0 (-2, 2) | 0 (-2, 2) | 0 (-2, 2) | 0.003 |
| New medications | ||||||
| Lipid meds | No lipid meds | 94/505 (19%) | 96/274 (35%) | 50/116 (43%) | 44/68 (65%) | <0.001 |
| BP meds | No BP meds | 91/459 (20%) | 63/249 (25%) | 34/112 (30%) | 26/57 (46%) | <0.001 |
| Diabetic meds | No diabetic meds | 12/617 (2%) | 13/377 (3%) | 5/165 (3%) | 10/101 (10%) | <0.001 |
| Aspirin | No aspirin | 28/560 (5%) | 31/349 (9%) | 17/146 (12%) | 16/75 (21%) | <0.001 |
| Medication adherence | ||||||
| Lipid meds | On lipid meds | 96/120 (80%) | 105/117 (90%) | 50/54 (93%) | 30/34 (88%) | 0.04 |
| BP meds | On BP meds | 157/167 (94%) | 135/144 (94%) | 53/58 (91%) | 43/45 (96%) | 0.97 |
| Diabetic meds | On diabetic meds | 14/14 (100%) | 19/23 (83%) | 6/6 (100%) | 6/8 (75%) | 0.18 |
| Aspirin | On aspirin | 15/65 (23%) | 12/42 (29%) | 4/24 (17%) | 12/27 (44%) | 0.13 |
| Performed procedures | ||||||
| Rest ECG | All subjects | 341 (54.0%) | 236 (59.0%) | 112 (65.5%) | 78 (71.6%) | <0.001 |
| Stress Nuclear | All subjects | 38 (6.0%) | 59 (14.8%) | 34 (19.9%) | 38 (34.9%) | <0.001 |
| Stress Echo | All subjects | 70 (11.1%) | 57 (14.3%) | 38 (22.2%) | 30 (27.5%) | <0.001 |
| Any Stress Test | All subjects | 155 (24.6%) | 144 (36.0%) | 85 (49.7%) | 70 (64.2%) | <0.001 |
| Cardiac CT | All subjects | 44 (7.0%) | 28 (7.0%) | 14 (8.2%) | 15 (13.8%) | 0.04 |
| Carotid Ultrasound | All subjects | 76 (12.0%) | 43 (10.8%) | 30 (17.5%) | 18 (16.5%) | 0.07 |
| CATH | All subjects | 7 (1.1%) | 10 (2.5%) | 10 (5.9%) | 16 (14.7%) | <0.001 |
| Revascularization | All subjects | 1 (0.2%) | 4 (1.0%) | 9 (5.3%) | 16 (14.7%) | <0.001 |
| Medical costs (in US dollars) | ||||||
| Procedure costs | 899 (733, 1,066) | 447 (352,543) | 705 (450,960) | 1,130 (778, 1,483) | 3,774 (2,302, 5,247) | <0.001 |
| Medication costs | 3,131 (2,904,3,357) | 2,176 (1,922, 2,429) | 3,689 (3,265, 4,113) | 3,769 (3,058, 4,480) | 5,534 (4,457, 6,613) | <0.001 |
| Lipid lowering medications | 825 (755,895) | 581 (491,671) | 1,025 (886,1,163) | 991 (790, 1,191) | 1,232 (979, 1,485) | <0.001 |
| Hypertension medications | 896 (822,970) | 722 (623,820) | 1,072 (924,1,219) | 866 (671, 1,061) | 1,318 (1,045, 1,590) | <0.001 |
| Diabetic medications | 529 (439,619) | 367 (259,476) | 617 (436,798) | 569 (325, 813) | 1,077 (652, 1,502) | <0.001 |
| Aspirin | 27 (22, 31) | 16 (11, 21) | 31 (22, 41) | 31 (18, 45) | 66 (42, 89) | <0.001 |
| All costs | 4,030 (3,714,4,346) | 2,623 (2,343, 2,903) | 4,394 (3,856, 4,931) | 4,900 (3,992, 5,807) | 9,309 (7,200, 11,418) | <0.001 |
EX = exercise.
Impact of baseline CAC score on medical resource utilization
A progressive increase in new cardiac medications occurred with increasing baseline CAC scores, particularly for lipid lowering medications. Among those on medications at baseline, adherence rates at four years were high for use of lipid lowering and anti-hypertensive medications. The frequency of both noninvasive and invasive procedures as well as procedural costs also increased with increasing baseline CAC scores, but the rate of catheterization and revascularization was low in all groups. Procedural costs were low for subjects with no CAC and much higher for those subjects with CAC scores ≥400.
Comparison of the no-scan group to subjects with a normal baseline CAC scan
Comparison of the no-scan randomized group to the scan subgroup with normal CAC scans (CAC score = 0) is shown in Table 4. There was no difference between these groups in four-year CAD risk profiles, although the normal scan subjects had lower rates of initiation of new lipid medication. Similarly, adherence to baseline medications did not differ between these groups. Lower downstream rates of noninvasive tests and invasive procedure utilization were noted for subjects with normal CAC scans. Overall, incurred costs were lower in the normal scan subjects compared to the no-scan subjects, including 37% lower procedures costs (p=0.001) and 26% lower medication costs (p=0.005).
Table 4.
Comparison of the no-scan subjects to the scan subjects with a zero CAC score.
| Parameters | Study Group at Baseline | No-Scan Group | CAC 0 | P-Values |
|---|---|---|---|---|
| CAD risk factors | ||||
| Baseline SBP (mm/Hg) | All subjects | 130 (119, 142) | 128 (118, 140) | 0.14 |
| Change in SBP (mm/Hg) | All subjects | -5 (-16, 6) | -4 (-16, 5) | 0.73 |
| Baseline DBP (mm/Hg) | All subjects | 81 (75, 89) | 80 (74, 88) | 0.14 |
| Change in DBP (mm/Hg) | All subjects | -4 (-12, 4) | -4 (-11, 5) | 0.09 |
| Baseline CHOL (mg/dl) | All subjects | 213 (187, 238) | 214 (190, 239) | 0.31 |
| Change in CHOL (mg/dl) | All subjects | -16 (-44, 7) | -15 (-42, 9) | 0.45 |
| Baseline LDL (mg/dl) | All subjects | 130 (109, 155) | 133 (111, 156) | 0.29 |
| Change in LDL (mg/dl) | All subjects | -11 (-41, 10) | -12 (-37, 10) | 0.87 |
| Baseline HDL (mg/dl) | All subjects | 53 (42, 65) | 54 (44, 67) | 0.14 |
| Change in HDL (mg/dl) | All subjects | -1 (-7, 5) | -1 (-7, 5) | 0.42 |
| Baseline Triglycerides (mg/dl) | All subjects | 113 (78, 166) | 106 (78, 154) | 0.17 |
| Change in triglycerides (mg/dl) | All subjects | -9 (-37, 14) | -8 (-35, 14) | 0.81 |
| Baseline glucose (mg/dl) | All subjects | 94 (86, 101) | 91 (85, 98) | <0.001 |
| Change in glucose (mg/dl) | All subjects | -2 (-8, 6) | -1 (-8, 6) | 0.27 |
| Baseline weight | BMI ≥25 | 186 (167, 210) | 186 (165, 206) | 0.60 |
| Change in weight | BMI ≥25 | 1 (-5, 8) | 1 (-5, 8) | 0.87 |
| Baseline WC (inches) | M>40,W>35 | 41 (38, 43) | 41 (37.8, 43) | 0.91 |
| Change in WC (inches) | M>40,W>35 | 1 (-2, 3) | -0.5 (-3.8, 2) | 0.003 |
| Quit Smoking | Smokers | 16/36 (44%) | 15/27 (56%) | 0.38 |
| Exercise ≥3 times/week | Non-exercisers | 95/266 (36%) | 92/284 (32%) | 0.41 |
| Baseline FRS | All subjects | 6 (2, 12) | 4 (2, 8) | <0.001 |
| Change in FRS | All subjects | 0 (0, 2) | 0 (-1, 2) | 0.22 |
| New medications | ||||
| Lipid medications | No lipid meds | 109/441 (25%) | 94/505 (19%) | 0.02 |
| Hypertension medications | No BP meds | 77/419 (18%) | 91/459 (20%) | 0.59 |
| Diabetic medications | No diabetic meds | 15/595 (3%) | 12/617 (2%) | 0.50 |
| Aspirin | No aspirin | 39/525 (7%) | 28/560 (5%) | 0.10 |
| Medication adherence | ||||
| Lipid medications | On lipid meds | 145/168 (86%) | 96/120 (80%) | 0.15 |
| Hypertension medications | On BP meds | 173/192 (90%) | 157/167 (94%) | 0.18 |
| Diabetic medications | On diabetic meds | 26/28 (93%) | 14/14 (100%) | 0.55 |
| Aspirin | On aspirin | 26/84 (31%) | 15/65 (23%) | 0.29 |
| Performed procedures | ||||
| Rest ECG | All subjects | 380 (61.0%) | 341 (54.0%) | 0.01 |
| Stress Nuclear | All subjects | 62 (10.0%) | 38 (6.0%) | 0.01 |
| Stress Echo | All subjects | 102 (16.4%) | 70 (11.1%) | 0.007 |
| Any Stress Test | All subjects | 211 (33.9%) | 155 (24.6%) | <0.001 |
| Cardiac CT | All subjects | 44 (7.1%) | 44 (7.0%) | 0.95 |
| Carotid Ultrasound | All subjects | 88 (14.1%) | 76 (12.0%) | 0.28 |
| Cardiac catheterization | All subjects | 18 (2.9%) | 7 (1.1%) | 0.02 |
| Coronary revascularization | All subjects | 11 (1.8%) | 1 (0.2%) | 0.003 |
| Medical costs (in US dollars) | ||||
| Procedure costs | All subjects | 712 (523, 901) | 447 (351, 543) | 0.001 |
| Medication costs | All subjects | 2,937 (2,620, 3,254) | 2,176 (1,922, 2,429) | 0.005 |
| Lipid lowering medications | All subjects | 721 (625, 817) | 581 (491, 671) | 0.02 |
| Hypertension medications | All subjects | 761 (659, 863) | 722 (623, 820) | 0.78 |
| Diabetic medications | All subjects | 545 (415, 675) | 367 (259, 476) | 0.02 |
| Aspirin | All subjects | 26 (20, 33) | 16 (11, 21) | 0.02 |
| All costs | All subjects | 3,649 (3,263, 4,035) | 2,623 (2,343, 2,903) | 0.001 |
Assessment of CAC scores at four years
The mean or median CAC score at four years was 147 ± 335 or 11 (0, 124) in the no-scan group and 163 ± 431 or 12 (0, 124) in the scan group (p = 0.89). The distribution of CAC scores was similar between the no-scan and scan groups at four years: 43% and 42% had a zero CAC score, 29% and 31% had a CAC score of 1-99, 18% and 17% had CAC scores of 100-399, and 11% in both groups had CAC scores ≥400 (p = 0.75 for all subgroups). Overall, 385 (31%) of the scan subjects showed conversion from a normal to abnormal CAC scan (n=73) or change in CAC score which was >75th percentile for progression by the MESA formula (n=273) or both (n=39). In the baseline predictors model resulting from stepwise logistic regression, predictors of CAC progression included age (OR=1.20 per 5 years; 95% CI:1.1-1.3;p<0.001), male gender (OR=2.02; 95% CI:1.6-2.6;p<0.001), family history of CAD (OR=1.47; 95% CI:1.1-1.9;p=0.006), hypertension (OR=1.38; 95% CI:1.1-1.8;p=0.01), hyperlipidemia (OR=1.44; 95% CI:1.05-2.0;p=0.03), and history of diabetes (OR=1.69; 95% CI:1.1-2.7;p=0.03). In the final treatment model, lipid lowering medication use by year 4 was the strongest predictor of CAC score progression (OR=1.51; 95% CI: 1.2-2.0;p =0.002).
DISCUSSION
To determine the impact of CAC scanning on CAD risk, we randomized asymptomatic subjects to groups undergoing CAC scan versus no CAC scan and compared the groups for four-year changes in CAD risk. In totality, seven modifiable CAD risk factors were assessed: blood pressure, lipid profiles, serum glucose, weight, waist circumference, exercise and smoking. Subjects who underwent CAC scanning experienced a favorable improvement in risk, including greater reduction in mean systolic blood pressure and serum LDL-cholesterol level, and reduced waist circumference for those with increased abdominal girth at baseline. The overweight subjects within the scan group also showed a tendency towards more weight loss compared to no-scan counterparts. The two groups did not differ in exercise activity, smoking behavior or glucose measurements at four years, but the frequency of smokers and diabetics in our study were both low. Four-year progression of CAD risk, as summarized by FRS, rose in the no-scan group but was static in the scan group, due to the favorable improvements in systolic blood pressure and lipid status. Importantly, risk factor profiles improved in both the scan and no-scan groups following recruitment into our trial, but the magnitude of improvement was greater in the scan group.
Overall rates of downstream medical testing and procedures did not differ among the scan and no-scan groups, resulting in comparable medical procedure costs during follow-up. Estimated medication costs were mildly higher in the scan group.
There was no substantive difference in the rates of myocardial infarction or mortal events between the two randomized groups; however, the rates of events were low and statistical power was insufficient to adequately assess this issue. Practical study of how CAC scanning might affect clinical events may require studying patients, rather than healthy volunteers, who may be pre-selected to be at higher risk of clinical events compared to our subjects (11).
Change in CAD risk factors, downsteam tests, and incurred costs according to baseline CAC score
Within the scan group, there was a direct proportional relationship between the magnitude of baseline CAC and the degree of reduction of systolic and diastolic blood pressure, serum cholesterol, LDL, and triglyceride levels. In addition, a reduction in waist size occurred among those subjects with increased abdominal girth and high CAC scores, and modest weight loss occurred among overweight subjects with CAC score elevation. Factors not varying according to CAC score included HDL-cholesterol, glucose measurements, and smoking cessation. The composite FRS at four years increased compared to the baseline FRS among the scan subjects with a zero CAC score and decreased in those with elevated CAC scores.
There was a strong proportional relationship between baseline CAC score and the frequency of initiating cardiac medications. Downstream medical testing also increased in proportion to baseline CAC score. Overall medical costs were three-fold higher in the subjects with a CAC score≥400 compared to those with a CAC score of 100-399. Noninvasive stress testing predominated among downstream tests. Overall, approximately two-thirds of subjects with CAC scores ≥400 underwent some form of cardiac stress testing, but the frequency of four-year rates of cardiac catheterization and coronary revascularization were substantially lower.
Due to the design of our trial, we were uniquely able to assess how knowledge of a normal CAC scan influenced the forward trajectory of medical treatment and costs compared to usual medical care. Overall, there was a 25% greater reduction in medication costs in the normal CAC scan subjects compared to the no-scan group, and a 37% reduction in procedure costs. Since the normal scan subjects constituted ~50% of our scan subjects, whereas the subjects with CAC scores ≥400 constituted only ~ 8% of our scan subjects, these directionally opposite effects were sufficient to result in the comparable incurred costs within our scan and no-scan groups.
Assessment of CAC scores at four years
There was no difference in mean CAC scores or the distribution of CAC scores in the no-scan versus scan group at four years. Within the scan group, we found that both baseline CAD risk factors and the use of lipid-lowering medication were predictors of CAC score progression. These findings parallel that of the MESA study (12). Some early studies reported that the use of HMG-CoA reductase inhibitors (statins) was associated with a reduced rate of CAC progression during serial scanning (13-14), but subsequent studies have reported either no difference in CAC progression (15-17) or even increased rate of CAC progression among subjects using such medication (12. 18). Of note, in this regard, is experimental work suggesting that statins may have the ability to promote calcification of coronary plaques (29). While further study is indicated, the apparent multi-factorial causation for plaque progression limits the use of CAC score progression as a therapeutic index.
Comparison to prior studies
Only one prior randomized trial, conducted by O’Malley et al, has assessed the impact of CAC scanning on subjects’ risk profiles and health behavior (20), and there are no prior trials concerning the impact of CAC scanning on downstream tests and costs. In the trial conducted by O’Malley et al, subjects underwent CAC scanning, but the results were then withheld in one-half of subjects. In contrast to our study, these investigators found no impact of CAC scanning on subjects’ clinical profile. However, their study was primarily limited to young military recruits with a mean age of only 42 years and 85% had normal CAC scans, thus limiting the comparability of their findings to our own.
Limitations
Our study has important limitations. Our subjects were highly educated, fairly affluent, and sufficiently motivated to volunteer for our research study and were thus more likely than a general population to adhere to risk factor modification therapies. Indeed, the ~90% four-year continuation rate for using lipid-lowering and anti-hypertensive medication in our study is atypically high compared to studies involving patient populations (21). In addition, our study and the prior study by O’Malley et al (20) are similarly limited in that they involved the offering of free CAC scans to volunteer subjects. This incentive offering may not be reflective of the care path that patients may encounter when confronted with out-of-pocket CAC scan costs from the onset. For these reasons, caution should be applied in generalizing our findings to populations at large.
Due to the limited assessment of health behaviors in our study, we could not determine the extent to which CAC scanning drove reduced CAD risk profiles due to improvement in subjects’ health behaviors as opposed to more intensive use and adherence to medications. An objective measure of dietary habits was lacking in our study and our assessment of exercise activity relied on a crude self-report measurement rather than on objective measurements, such as can be garnered by pedometer use. Further, the nature of our study design, involving only a one-time counseling session, might not be ideal for harnessing behavioral lifestyle changes that are more difficult to accomplish compared to taking medications. Thus, future study might compare if and what intensity of behavioral interventions improves the ability of CAC scanning to improve patients’ lifestyle health behaviors.
The impact of CAC scanning on diabetes and smoking could not be adequately assessed in our trial, due to our small number of subjects with these risk factors. In addition, we cannot exclude that the nature of our study design led to psychological effects whereby subjects who were randomization to the scan group - and thus received a free CAC scan at both onset and at four years - felt more motivated to participate in our trial, and those who were randomized to the no-scan group felt discouraged that CAC scanning would be deferred for four years. Potentially, this dynamic might explain the greater loss to follow-up that was noted among the no-scan subjects.
Another important methodological limitation was that due to anonymity restrictions imposed by our IRB, we could not provide CAC scan results directly to our subjects’ physicians. As a result, their involvement only occurred indirectly. However, this limitation should only have served to minimize the potential impact of CAC scanning upon risk factor management in our study. On the other hand, our study design may have limited our ability to assess the financial impact of CAC scanning in clinical practice, since the actual course of action following calcium scanning may be potentially different when testing is ordered by a physician rather than being initiated by subjects seeking to assess their cardiovascular risk. For example, following their ordering of a CAC scan, physicians may feel more compelled than volunteer subjects to do follow-up stress testing in patients with intermediate to high CAC scores for fear of medico-legal consequences for a missed work up for myocardial ischemia. Accordingly, more prospective study is required to assess the financial impact of CAC scanning upon downstream testing and medical costs in actual clinical practice.
Clinical implications
The results of our trial are consistent with the hypothesis that CAC scanning can improve cardiac management without incurring significant increase in downstream medical costs. However, caution should be applied to interpreting the significance of our trial since it was only conducted in volunteers, rather than in patients who may be suitable candidates for CAC scanning based on clinical consensus (8,22-23). The finding that our study did not lead to increased downstream testing is potentially clinically significant, revealing that physicians may be applying a “gatekeeper” function to CAC scanning with respect to ascertaining the need for subsequent more expensive noninvasive testing. This potential use may be based on the repeated observation of a threshold relationship between the magnitude of CAC abnormality and the likelihood of observing inducible myocardial ischemia (24-27). The results of our study indicate a need for future large-scale clinical trials to determine whether our findings are applicable to different patient populations and to determine whether the salutatory effect of CAC scanning on CAD risk profiles translates to reductions in adverse clinical events.
Acknowledgments
This study was supported by a grant from The Eisner Foundation, Los Angeles, CA.
ABBREVIATIONS
- CAC
coronary artery calcium
- CAD
coronary artery disease
- CSMC
Cedars-Sinai Medical Center
- HDL
high density lipoprotein
- LDL
low density lipoprotein
- FRS
Framingham Risk Score
Footnotes
Disclosures: Dr. Shaw has research grants from Astellas and Brocco. Dr. Min is on the speaker’s bureau and receives grant support from GE healthcare. Dr. Budoff has served as a consultant and is on the speaker’s bureau for GE healthcare. Dr. Berman has research grants from Siemens and GE/Amersham and has both research grants and is on the speaker’s bureau for Astelles and Lantheus. The other authors report no disclosures.
Publisher's Disclaimer: This is a PDF file of an unedited manuscript that has been accepted for publication. As a service to our customers we are providing this early version of the manuscript. The manuscript will undergo copyediting, typesetting, and review of the resulting proof before it is published in its final citable form. Please note that during the production process errors may be discovered which could affect the content, and all legal disclaimers that apply to the journal pertain.
References
- 1.Shaw LS, Raggi P, Schisterman E, Berman DS, Callister TQ. Prognostic value of cardiac risk factors & coronary artery calcium screening for all cause mortality. Radiology. 2003;228:826–833. doi: 10.1148/radiol.2283021006. [DOI] [PubMed] [Google Scholar]
- 2.Kondos GT, Hoff JA, Sevrukov A, et al. Coronary artery calcium and cardiac events electron-beam tomography coronary artery calcium and cardiac events: a 37-month follow-up of 5,635 initially asymptomatic low to intermediate risk adults. Circulation. 2003;107:2571–2576. doi: 10.1161/01.CIR.0000068341.61180.55. [DOI] [PubMed] [Google Scholar]
- 3.Arad Y, Goodman KJ, Roth M, et al. Coronary calcification, coronary disease risk factors, C-reactive protein, and atherosclerotic cardiovascular disease events. J Am Coll Cardiol. 2005;46:158–65. doi: 10.1016/j.jacc.2005.02.088. [DOI] [PubMed] [Google Scholar]
- 4.Detrano R, Guerci AD, Carr JC, et al. Coronary calcium as a predictor of coronary events in four racial or ethnic groups. N Engl J Med. 2008;358:13336–45. doi: 10.1056/NEJMoa072100. [DOI] [PubMed] [Google Scholar]
- 5.Wilson PWF, D’Agostino RB, Levy D, Belanger AB, Silbershatz H, Kannel WB. Prediction of coronary heart disease using risk factor categories. Circulation. 1998;97:1837–47. doi: 10.1161/01.cir.97.18.1837. [DOI] [PubMed] [Google Scholar]
- 6.Executive Summary of the Third Report of the National Cholesterol Education Program (NCEP) Expert panel on detection, evaluation, and treatment of high blood cholesterol in adults (Adult Treatment Panel III) JAMA. 2001;285:2486–2497. doi: 10.1001/jama.285.19.2486. [DOI] [PubMed] [Google Scholar]
- 7.Grundy SM, Balady GJ, Criqui MH. Primary prevention of coronary heart disease: guidance from Framingham. A statement for healthcare professionals from the AHA Task Force on Risk Reduction. Circulation. 1998;97:1876–1887. doi: 10.1161/01.cir.97.18.1876. [DOI] [PubMed] [Google Scholar]
- 8.Berman DS, Wong ND, Gransar H, et al. Relationship between stress-induced myocardial ischemia and atherosclerosis measured by coronary calcium tomography. J Am Coll Cardiol. 2004;44:923–30. doi: 10.1016/j.jacc.2004.06.042. [DOI] [PubMed] [Google Scholar]
- 9.Agatston AS, Janowitz WR, Hildner FJ, et al. Quantification of coronary artery calcium using ultrafast computed tomography. J Am Coll Cardiol. 1990;15:827–832. doi: 10.1016/0735-1097(90)90282-t. [DOI] [PubMed] [Google Scholar]
- 10.Shaw LS, Min JK, Budoff M, et al. Induced cardiovascular procedural costs and resource consumption patterns after coronary artery calcium scanning. J Am Coll Cardiol. 2009;54:1258–67. doi: 10.1016/j.jacc.2009.07.018. [DOI] [PubMed] [Google Scholar]
- 11.Rozanski A, Gransar H, Shaw L, et al. Comparison of the atherosclerotic burden among asymptomatic patients versus matched volunteers. J Nucl Cardiol. doi: 10.1007/s12350-010-9324-1. in press. [DOI] [PMC free article] [PubMed] [Google Scholar]
- 12.Kronmal RA, McClelland RL, Detrano, et al. Risk factors for the progression of coronary artery calcification in asymptomatic subjects: Results from the Multi-Ethnic Study of Atherosclerosis (MESA) Circulation. 2007;115:2722–30. doi: 10.1161/CIRCULATIONAHA.106.674143. [DOI] [PubMed] [Google Scholar]
- 13.Callister TQ, Raggi P, Cooil B, Lippolis NJ, Russo Dj. Effect of HMB-CoA reductase inhibitors on coronary artery disease as assessed by electron-beam computed tomography. N Engl J Med. 1998;339:1972–8. doi: 10.1056/NEJM199812313392703. [DOI] [PubMed] [Google Scholar]
- 14.Achenbach S, Ropers D, Pohle K, et al. Influence of lipid lowering therapy on the progression of coronary artery calcification:a prospective evaluation. Circulation. 2002;106:1077–82. doi: 10.1161/01.cir.0000027567.49283.ff. [DOI] [PubMed] [Google Scholar]
- 15.Raggi P, Davidson M, Callister TQ, et al. Aggressive versus moderate lipid-lowering therapy in hypercholesterolemic postmenopausal women: Beyond endorsed lipid lowering with EBT scanning (BELLES) Circulation. 2005;112:563–571. doi: 10.1161/CIRCULATIONAHA.104.512681. [DOI] [PubMed] [Google Scholar]
- 16.Arad Y, Spadaro LA, Roth M, Newstein D, Guerci AD. Treatment of asymptomatic adults with elevated coronary calcium scores with atorvastatin, vitamin C, and vitamin E: The St. Francis Heart Study randomized clinical trial. J Am Coll Cardiol. 2005;46:166–172. doi: 10.1016/j.jacc.2005.02.089. [DOI] [PubMed] [Google Scholar]
- 17.Houslay ES, Cowell SJ, Prescott RJ, Reid J, Burton J, Northridge DB, Boon NA, Newby DE. Progressive coronary calcification despite intensive lipid-lowering treatment: a randomized controlled trial. Heart BMJ. 2006;92:1207–1212. doi: 10.1136/hrt.2005.080929. [DOI] [PMC free article] [PubMed] [Google Scholar]
- 18.Dhakshinamurthy VA, Lim E, Darko D, et al. Determinants of progression of coronary artery calcification in type 2 diabetes. Role of glycemic control and inflammatory/vascular calcification markers. J Am Coll Cardiol. 2007;50:2218–25. doi: 10.1016/j.jacc.2007.08.032. [DOI] [PubMed] [Google Scholar]
- 19.Johnson RC, Leopold JA, Loscalzo J. Vascular calcification: Pathobiological mechanisms and clinical implications. Circulation. 2006;99:1044–1059. doi: 10.1161/01.RES.0000249379.55535.21. [DOI] [PubMed] [Google Scholar]
- 20.O’Malley PG, Feurstein IM, Taylor AJ. Impact of electron beam tomography, with or without case management, on motivation, behavioral change, and cardiovascular risk profile: a randomized controlled trial. JAMA. 2003;289:2215–2223. doi: 10.1001/jama.289.17.2215. [DOI] [PubMed] [Google Scholar]
- 21.Osterberg L, Blaschke T. Adherence to medication. N Engl J Med. 2005;353:487–97. doi: 10.1056/NEJMra050100. [DOI] [PubMed] [Google Scholar]
- 22.Budoff MJ, Achenbach S, Blumenthal RS, et al. Assessment of Coronary Artery Disease by Cardiac Computed Tomography, A Scientific Statement From the American Heart Association Committee on Cardiovascular Imaging and Intervention, Council on Cardiovascular Radiology and Intervention, and Committee on Cardiac Imaging, Council on Clinical Cardiology. Circulation. 2006;114:1761–91. doi: 10.1161/CIRCULATIONAHA.106.178458. [DOI] [PubMed] [Google Scholar]
- 23.Greenland P, Bonow RO, Brundage BH, et al. Coronary Artery Calcium Scoring: ACCF/AHA 2007 Clinical Expert Consensus Document on Coronary Artery Calcium Scoring By Computed Tomography in Global Cardiovascular Risk Assessment and in Evaluation of Patients With Chest Pain. J Am Coll Cardiol. 2007;49:378–402. doi: 10.1016/j.jacc.2006.10.001. [DOI] [PubMed] [Google Scholar]
- 24.He ZX, Hedrick TD, Pratt CM, et al. Severity of coronary artery calcification by electron beam computed tomography predicts silent myocardial ischemia. Circulation. 2000;101:244–51. doi: 10.1161/01.cir.101.3.244. [DOI] [PubMed] [Google Scholar]
- 25.Moser KW, O’Keefe JH, Jr, Bateman TM, McGhie IA. Coronary calcium screening in asymptomatic patients as a guide to risk factor modification and stress myocardial perfusion imagine. J Nucl Cardiol. 2003;10:590–8. doi: 10.1016/s1071-3581(03)00653-6. [DOI] [PubMed] [Google Scholar]
- 26.Anand JV, Lim E, Raval U, Lipkin D, Lahiri A. Prevalence of silent myocardial ischemia in asymptomatic individuals with subclinical atherosclerosis detected by electron beam tomography. J Nucl Cardiol. 2004;11:450–57. doi: 10.1016/j.nuclcard.2004.06.125. [DOI] [PubMed] [Google Scholar]
- 27.Rozanski A, Gransar H, Wong ND, et al. Use of coronary calcium scanning for predicting inducible myocardial ischemia: influence of patients’ clinical presentation. J Nucl Cardiol. 2007;14:669–679. doi: 10.1016/j.nuclcard.2007.07.005. [DOI] [PubMed] [Google Scholar]