

Abstract
Objective
The vertex sharp transient (VST) is an electroencephalographic (EEG) discharge that is an early marker of non-REM sleep. It has been recognized since the beginning of sleep physiology research, but its source and function remain mostly unexplained. We investigated VST generation using functional MRI (fMRI).
Methods
Simultaneous EEG and fMRI were recorded from 7 individuals in drowsiness and light sleep. VST occurrences on EEG were modeled with fMRI using an impulse function convolved with a hemodynamic response function to identify cerebral regions correlating to the VSTs. A resulting statistical image was thresholded at Z>2.3.
Results
Two hundred VSTs were identified. Significantly increased signal was present bilaterally in medial central, lateral precentral, posterior superior temporal, and medial occipital cortex. No regions of decreased signal were present.
Conclusion
The regions are consistent with electrophysiologic evidence from animal models and functional imaging of human sleep, but the results are specific to VSTs. The regions principally encompass the primary sensorimotor cortical regions for vision, hearing, and touch.
Significance
The results depict a network comprising the presumed VST generator and its associated regions. The associated regions functional similarity for primary sensation suggests a role for VSTs in sensory experience during sleep.
Keywords: electroencephalography (EEG), functional MRI (fMRI), sleep, vertex sharp transients
Introduction
Sleep is a fundamental alteration in consciousness that involves multiple brain networks and exists for presumably many purposes. (Hobson and Pace-Schott, 2002) Electrophysiologic and functional imaging investigations of sleep have demonstrated divergent brain states of rapid eye movement (REM) and non-REM sleep, as well as a progression of stages within non-REM sleep. With non-REM sleep progression, the EEG manifests several forms of intermittent activity that remain mostly unexplained anatomically and functionally. (Kajimura et al., 1999)
Vertex sharp transients (VSTs) are one important form of intermittent non-REM sleep activity. They first occur in late drowsiness as non-REM sleep develops (Stage 1) and are the first EEG pattern to occur that is unique to sleep. (Stern, 2005) Identification is based on their specific EEG features, including a large electronegative discharge at the apex of the head with a particular wave form that is superimposed upon slower, more diffuse EEG activity. The most commonly accepted interpretation is that VSTs are either a direct response to an external stimulus or a mechanism to maintain sleep (indirect response) after a stimulus. (Colrain and Campbell, 2007) This is similar to the common understanding of the K-complex, another non-REM sleep EEG discharge, and is based on the evidence that both VSTs and K-complexes may be elicited by sudden stimulation irrespective of the sensory modality. Each type of discharge may actually be a long latency evoked potential and has similarities to the N300 potential. (Sekine et al., 2001), (Bastien et al., 2002) However, differences between VSTs and K-complexes have been interpreted as indicating differing roles and effects on arousal. (Hess, 1964), (Colrain, 2005)
VSTs are poorly understood despite their common occurrence, ease of identification, and relevance to sleep onset. Neither their anatomic source nor their functional effect is known. As Ogilvie queried in a 2001 review, “Why is it that these waves (VSTs) have been so little studied? As the harbinger of sleep, is it not just possible that they could have something important to tell us about the process of falling asleep?”(Ogilvie, 2001) Several electrophysiologic and functional imaging methods are available for investigating VSTs; however, simultaneous recording of EEG and functional MRI has distinct advantages. (Stern, 2006) In particular, simultaneous EEG and fMRI allows precise identification of electrophysiologic activity in time along with precise spatial localization of the metabolic correlates of the activity. We performed a simultaneous EEG and fMRI investigation to identify regions associated with VST occurrences and to obtain new insight into their functional relevance.
Methods
EEGs from simultaneous EEG and fMRI studies across 7 participating individuals were reviewed to determine whether VSTs were present. (Table 1) The EEG-fMRI studies were performed according to an IRB-approved protocol investigating the fMRI correlates of EEG activity from individuals with epilepsy and control individuals without neurologic disorders. The study group underwent uniform EEG and fMRI methods with recordings occurring between the late morning and mid afternoon. None of the participants had an underlying sleep disorder, but each was moderately sleep deprived. Because sleep deprivation increases the likelihood of recording epileptiform discharges from patients with epilepsy, instructions were to reduce sleep on the night before the imaging session to half of what was normal for the participant. No medication was administered to induce sleep during the imaging sessions.
Table 1.
Summary of participants and data collection.
TLE- temporal lobe epilepsy, MTS- mesial temporal sclerosis
| Participant | Age | Gender | Epilepsy | MRI | Medications | Scans | Total Wake Time/Total Scan Time (min) |
Total VSTs |
|---|---|---|---|---|---|---|---|---|
| 1 | 27 | F | left TLE | left MTS | levetiracetam | 2 | 4/13.5 | 5 |
| 2 | 33 | F | right TLE | right MTS | lamotrigine, levetiracetam | 1 | 0/10 | 8 |
| 3 | 22 | F | left TLE | left MTS | phenytoin | 4 | 8/37.5 | 19 |
| 4 | 27 | F | left TLE | left MTS | levetiracetam, phenytoin | 3 | 0/35 | 6 |
| 5 | 35 | F | right TLE | right MTS | lamotrigine, levetiracetam | 4 | 2.5/40 | 41 |
| 6 | 26 | M | none | normal | none | 4 | 12.5/40 | 74 |
| 7 | 31 | M | none | normal | none | 2 | 1.5/40 | 47 |
| Combined | 20 | 28.5/216 | 200 |
EEG was recorded with an fMRI-compatible device (fEEG, Kappametrics, Inc., Virginia, US) that reduces imaging associated noise to allow visualization of cerebrally generated signals. (Schachter et al., 2009) Each imaging session included multiple simultaneous EEG and fMRI recordings with durations that ranged from 3.5 to 15 minutes. The total EEG-fMRI recording time for a participant typically was 45 to 60 minutes. Participants were instructed to relax with eyes closed during imaging and allow spontaneous sleep. No auditory stimulus was present except for the acoustic MRI noise.
The recordings included 32 channels sampled at 2000 Hz from standard scalp electrode locations using carbon electrodes and wires and segmented RF filtering enclosures. Analogue noise subtraction specific for each scalp location was followed by digital processing to yield a final gradient and ballistocardiographic noise reduction of 92 dB. (McGlone et al., 2009) Analogue subtraction was achieved by recording two channels of data from each electrode location. One channel including the cerebrally generated signal and the other was from the same scalp location but was shielded from the skull and including only the ambient noise. Digital processing used a real-time adaptive software algorithm that produced a noise template that was updated every 2 – 3 seconds and subtracted from the analogue-corrected EEG signal. Ballistocardiographic artifact was digitally reduced for each channel individually using a timing signal based on the heartbeat and a subtracted ballistocardiographic template. Imaging was performed with a 3T MRI system (Trio, Siemens, Erlangen, Germany). BOLD-sensitive functional imaging was performed using a gradient echo echo-planar sequence with parameters: TR=2000 ms, TE=30 ms, slice thickness 4 mm, 34 slices, 3.3 mm × 3.3 mm in-plane resolution. High-resolution structural images were obtained during the same imaging session using a 3-D spoiled gradient recalled (SPGR) sequence with parameters: TR=20 ms, TE=3 ms, slice thickness 1 mm, 160 slices, 1 mm × 1 mm in-plane resolution.
After noise cancellation post-processing, EEGs were independently reviewed by two fellowship-trained electroencephalographers (JMS and ZH) and the occurrence time for each VST was identified. Discharges resembling VSTs that were associated with sleep spindles were excluded as K-complexes. Image analysis was performed using FEAT (fMRI Expert Analysis Tool) version 5.98 within FSL (fMRIB Software Library) version 4.1.1 (Oxford, UK, www.fmrib.ox.ac.uk/fsl). (Forman et al., 1995), (Woolrich et al., 2001) Motion correction, non-brain removal and spatial smoothing (FWHM 5 mm) were performed prior to statistical analysis. Motion correction produced three rotation and three translation parameters that were modeled, unconvolved, as nuisance parameters along with their temporal derivatives. (Friston et al., 1996) VSTs were modeled using an impulse function convolved with a double-gamma hemodynamic response function with local autocorrelation correction using the FEAT FILM model. Both the data and the design were high-pass filtered using Gaussian-weighted least squares straight-line fitting (σ= 50.0 sec).
A second level fixed effects analysis was used to combine runs within individual for each participant. A third level mixed effects analysis was used to combine data across participants to obtain group results. The mixed effects model treats the participants as random effects and was estimated using FSL's FLAME module (FMRIB's Local Analysis of Mixed Effects). Z (Gaussianised T) statistic images from the group analysis were thresholded using clusters determined by Z>2.3 and a corrected cluster significant threshold of p=0.05. (Worsley et al., 1992) The statistic image was co-registered to a structural MRI that is a study-specific average anatomical image including each participant's high-resolution structural image.
Results
The study group included 7 individuals (5 with epilepsy and 2 controls) who had spontaneous sleep during imaging with the occurrence of at least one VST. (Figure 1) According to the simultaneous EEGs, these individuals were in a drowsy or sleep state through almost all of the imaging session, but none reached slow-wave non-REM or REM sleep. Overall, 87% of the scan time for this group was light sleep. Scans including greater wakefulness did not include VSTs and were excluded from the data analysis. Collectively among the 7 individuals, 200 VSTs were present. The VSTs occurred during 20 EEG-fMRI recordings that had a combined duration of 216 minutes. (Table 1) None of the VSTs co-occurred with epileptic abnormality.
Figure 1.
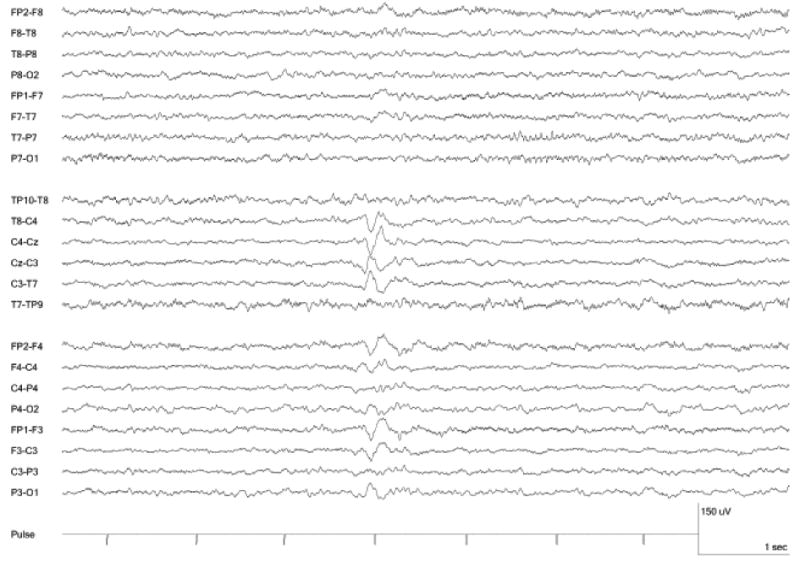
Vertex Sharp Transient recorded during fMRI.
The thresholded statistical images depict several regions of increased fMRI signal corresponding to VST occurrence. (Figure 2) The clusters of local activation and their maximum Z value (ranging 3.9 to 4.2) are listed in Table 2. The two anatomically largest regions are both within the parasagittal midline: medial precentral gyrus and medial occipital cortex, including both cuneus and lingual gyrus. The precentral region is subjacent to the scalp EEG localization of VSTs and is contiguous with smaller regions of increased signal in the medial post-central gyrus and lateral premotor cortex. Collectively, the medial and lateral central region represents bilateral primary sensorimotor cortex. Maximally increased signal also is present bilaterally in posterior aspects of the superior temporal gyri. Additional minor signal increase is present in the medial region between the central and occipital regions of increased signal, including the cingulate and precuneus. Notably, no signal is present within other regions associated with arousal, including the thalamus and superior brainstem, and no region of significant signal decrease is present.
Figure 2.
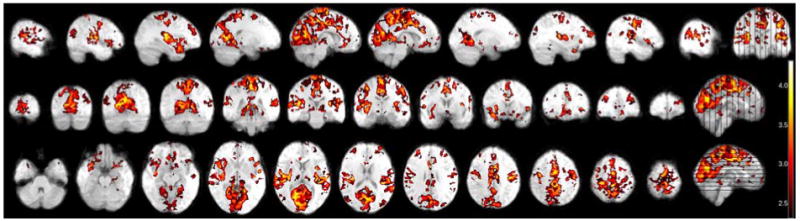
fMRI of 200 vertex sharp transients from 7 individuals. Thresholded to Z>2.3.
Table 2.
Regions of maximal, local signal change corresponding to VSTs. Z-value threshold set to 3.3 to identify local maxima.
| Region | Maximum Z-value | Voxels | MNI Coordinates (x,y,z) |
|---|---|---|---|
| Paracentral cortex | 4.1 | 13,334 | -1, -36, 56 |
| Medial occipital cortex | 4.0 | 12,656 | 22, -60, 7 |
| Right superior temporal cortex | 4.1 | 4,071 | 33, -23, 15 |
| Left superior temporal cortex | 4.2 | 3,160 | -33, -26, 16 |
| Right precentral cortex | 3.9 | 1,488 | 39, -9, 49 |
| Left precentral cortex | 3.9 | 1,416 | -41, -19, 43 |
Discussion
Using simultaneous EEG and fMRI, this investigation obtained the first imaging evidence for the anatomical correlates of VSTs. The results include regions functionally integrated in VST occurrence and, most likely, the VST generator. The image analysis is based on solely on statistical association between VST occurrence times and changes in local blood oxygenation (BOLD signal), which presumably indicates metabolic changes related to local field potentials. As such, fMRI signal change may be due to local generation of the EEG discharge, an effect of the generator on other cerebral tissue, or other activity that is correlated with the generator. (Logothetis et al., 2001) Therefore, regions of increased signal could reflect either the VST generator or regions functionally correlated with VSTs that are not evident with EEG. The medial central region of fMRI signal increase is immediately subjacent to the region of maximum VST voltage; therefore, this anatomic region is likely to include the VST generator. However, the other regions are similarly correlated with VSTs, and these results may be important when considering the functional relevance of VSTs. The other regions define a functional network comprising cortex subserving primary sensory and motor function, including sensory function for somatic, visual, and auditory perception.
Comparison to physiologic investigations
The anatomic basis of VST generation has not been widely investigated with electrophysiologic methods. Moreover, most of the previous EEG studies of sleep have not discriminated between VSTs and K-complexes. However, these discharges are easily distinguishable and may not have the same functional role. Intracerebral recordings of monkeys, using medial and lateral parasagittal electrodes and considering K-complexes and VSTs as one entity, identified activity with three maxima. (Hughes and Mazurowski, 1964) Within coverage that spanned the midline region from the anterior pole to the posterior pole, the maximal amplitudes were in three cingulate gyrus locations: 1) posterior to the (monkey) principal sulcus of the frontal lobe, 2) anterior to central sulcus, and 3) posterior to parieto-occipital sulcus. This observation is the only published result of midline brain recordings of VSTs and K-complexes and closely resembles the central and occipital localizations we observed with fMRI. Our results differ by depicting a central, paramedian region that is in the cortex immediately superficial to the cingulate gyrus and not within the cingulate gyrus.
Source imaging with magnetoencephalography (MEG) typically includes coverage that exceeds what is possible with intracranial electrodes, but localization is based on dipole modelling using multiple surface signals. Source analysis of MEG sleep recordings has identified a single, inferior parietal focus for VSTs. (Lu et al., 1992) This is compatible with both our result and the evidence from monkey experiments if the MEG model's assumption of one generating source has resulted in one calculated source that is a combination of the two regions that surround it. The two medial fMRI regions sandwich this MEG result.
Comparison to other non-REM imaging
Our recordings share some similarities to previous PET and fMRI investigations of drowsiness and non-REM sleep. FDG-PET studies identified a global but non-uniform decrease in cerebral metabolism with non-REM sleep. (Maquet, 2000) Regional cerebral blood flow scans with [15O]H2O-PET during progression from wakefulness to light sleep (Stages 1 and 2 non-REM sleep) depict more specific changes with decreased perfusion to regions of the frontal and parietal lobes, the thalamus, and cerebellum. (Kajimura, Uchiyama, 1999) Progression into deeper (slow wave non-REM) sleep is accompanied by further and more widespread decreases in perfusion that specifically spare peri-rolandic regions and the occipital lobe. These two regions include the majority of the regions we found to have increased signal with VSTs, which may indicate the relevance of the medial central and medial occipital regions to non-REM sleep. No regions of increased perfusion during light sleep were identified. [15O]H2O-PET imaging of Stage 1 sleep specifically identified increased perfusion in extrastriate visual areas and decreased perfusion in regions of posterior parietal and premotor cortex. (Kjaer et al., 2002) This result also includes the same anatomic regions as our result and is additionally similar by indicating increased activity in the occipital lobe. However, the results from both of these PET investigations differ in that they include only visual and somatosensory cortex and not auditory sensory cortex.
EEG-fMRI of non-REM sleep compared to wakefulness has identified multiple cerebral regions of signal decrease, including regions of the neocortex, limbic system, thalamus, caudate, and midbrain. (Kaufmann et al., 2006), (Laufs et al., 2007) The overall pattern is too distributed to be comparable to our results. However, an analysis of light sleep that modelled fluctuation in wakefulness to fluctuation in fMRI BOLD signal identified more restricted and confluent regions of signal increase. (Horovitz et al., 2008) These are highly similar to our results by depicting visual, auditory, and sensorimotor regions. An analysis of VST occurrences was not performed, so the relationship between VSTs and the signal fluctuations is not known.
An EEG-fMRI analysis of sleep spindles and K-complexes identified widespread neocortical and thalamic signal change with opposite signal change for spindles and K-complexes. (Laufs, Walker, 2007) K-complexes corresponded to decreased signal in the thalamus and mostly anterior neocortex while sleep spindles corresponded to increased signal in the same regions. This fMRI localization differs substantially from our VST result despite similar scalp localization for these three non-REM discharges, and this suggests differing roles for the three discharges. Similar fMRI results for spindles were identified by other investigators, who divided spindles based upon whether the spindle EEG localization was frontal or central. (Schabus et al., 2007) Only the central spindles had correlations in sensorimotor areas, and this matches the sensorimotor fMRI region we identified for VSTs. This fMRI similarity based on a central EEG localization may be supportive of the paracentral signal change as the EEG generator.
Limitations
The use of a random effects analysis confirms the consistency of the present results among the study's participants; however, a question remains regarding the similarity of the participants to the general population because five of the participants have mesial temporal lobe epilepsy (MTLE). This potential confound is theoretical because individuals with MTLE have normal VSTs and non-REM sleep. Moreover, the continuous EEG used for VST identification confirms that no seizures occurred during image acquisition and that no interictal epileptiform discharges occurred near to the times of the VSTs. The anti-epileptic medications taken by five participants are another potential confound, but the medications varied among participants with different mechanisms of action. This decreases the likelihood that the results are an effect of a specific medication. The inclusion of two control individuals also reduces this confound, especially since the controls accounted for 121 of the 200 VSTs and 80 of the 216 minutes of imaging. To specifically address this confound, fMRI analyses were performed separately for the epilepsy and control groups. The image results depict the same regions of maximum signal in the two subgroups as in the whole group; however, an informative statistical comparison of the groups is not possible because of the small number of participants in each group.
Conclusion
We observed fMRI correlates to spontaneous VSTs principally localized to primary sensorimotor cortices. The results clearly differentiate VSTs from sleep spindles based on fMRI localization. Among the VST localizations, the paracentral region is likely to be the discharge's generator. This region is neocortical and superficial to the cingulate localization previously reported. Moreover, it is similar to the other regions of signal change as cortex subserving a primary sensory or sensorimotor function. The results suggest that the response to heteromodal stimulation during non-REM sleep that is manifested by the VST is a distributed phenomenon in neocortex and is not a gating of sensory function at a central location, such as within the thalamus or limbic system. The distributed activity is compatible with VST's possible association with brief multimodal sensory experiences. Hypnagogic hallucinations are maximal during the non-REM microstate in which VSTs first occur. (Hori et al., 1994) However, the results also support the understanding of the VST as serving a role in modulating awareness of the external world during non-REM sleep by gating neocortical sensory function.
Acknowledgments
Funding was provided by NIH-NINDS K23 grant (NS044936), the Leff Family Foundation, and the Vradenburg Family Foundation. No conflicts of interest were present.
Footnotes
Research was performed at UCLA, Los Angeles, California
Publisher's Disclaimer: This is a PDF file of an unedited manuscript that has been accepted for publication. As a service to our customers we are providing this early version of the manuscript. The manuscript will undergo copyediting, typesetting, and review of the resulting proof before it is published in its final citable form. Please note that during the production process errors may be discovered which could affect the content, and all legal disclaimers that apply to the journal pertain.
References
- Bastien CH, Crowley KE, Colrain IM. Evoked potential components unique to non-REM sleep: relationship to evoked K-complexes and vertex sharp waves. Int J Psychophysiol. 2002;46:257–74. doi: 10.1016/s0167-8760(02)00117-4. [DOI] [PubMed] [Google Scholar]
- Colrain IM. The K-complex: a 7-decade history. Sleep. 2005;28:255–73. doi: 10.1093/sleep/28.2.255. [DOI] [PubMed] [Google Scholar]
- Colrain IM, Campbell KB. The use of evoked potentials in sleep research. Sleep Med Rev. 2007;11:277–93. doi: 10.1016/j.smrv.2007.05.001. [DOI] [PMC free article] [PubMed] [Google Scholar]
- Forman SD, Cohen JD, Fitzgerald M, Eddy WF, Mintun MA, Noll DC. Improved assessment of significant activation in functional magnetic resonance imaging (fMRI): use of a cluster-size threshold. Magn Reson Med. 1995;33:636–47. doi: 10.1002/mrm.1910330508. [DOI] [PubMed] [Google Scholar]
- Friston KJ, Williams S, Howard R, Frackowiak RS, Turner R. Movement-related effects in fMRI time-series. Magn Reson Med. 1996;35:346–55. doi: 10.1002/mrm.1910350312. [DOI] [PubMed] [Google Scholar]
- Hess R. The Electroencephalogram in Sleep. Electroencephalogr Clin Neurophysiol. 1964;16:44–55. doi: 10.1016/0013-4694(64)90024-0. [DOI] [PubMed] [Google Scholar]
- Hobson JA, Pace-Schott EF. The cognitive neuroscience of sleep: neuronal systems, consciousness and learning. Nat Rev Neurosci. 2002;3:679–93. doi: 10.1038/nrn915. [DOI] [PubMed] [Google Scholar]
- Hori T, Hayashi M, Morikawa T. Topographical EEG Changes and the Hypnagogic Experience. In: Ogilvie RD, Harsh JR, editors. Sleep Onset Normal and Abnormal Processes. Washington, D.C.: American Psychological Association; 1994. pp. 237–53. [Google Scholar]
- Horovitz SG, Fukunaga M, de Zwart JA, van Gelderen P, Fulton SC, Balkin TJ, et al. Low frequency BOLD fluctuations during resting wakefulness and light sleep: a simultaneous EEG-fMRI study. Hum Brain Mapp. 2008;29:671–82. doi: 10.1002/hbm.20428. [DOI] [PMC free article] [PubMed] [Google Scholar]
- Hughes JR, Mazurowski JA. Studies on the Supracallosal Mesial Cortex of Unanesthetized, Conscious Mammals. Ii. Monkey. D. Vertex Sharp Waves and Epileptiform Activity. Electroencephalogr Clin Neurophysiol. 1964;16:561–74. doi: 10.1016/0013-4694(64)90047-1. [DOI] [PubMed] [Google Scholar]
- Kajimura N, Uchiyama M, Takayama Y, Uchida S, Uema T, Kato M, et al. Activity of midbrain reticular formation and neocortex during the progression of human non-rapid eye movement sleep. J Neurosci. 1999;19:10065–73. doi: 10.1523/JNEUROSCI.19-22-10065.1999. [DOI] [PMC free article] [PubMed] [Google Scholar]
- Kaufmann C, Wehrle R, Wetter TC, Holsboer F, Auer DP, Pollmacher T, et al. Brain activation and hypothalamic functional connectivity during human non-rapid eye movement sleep: an EEG/fMRI study. Brain. 2006;129:655–67. doi: 10.1093/brain/awh686. [DOI] [PubMed] [Google Scholar]
- Kjaer TW, Law I, Wiltschiotz G, Paulson OB, Madsen PL. Regional cerebral blood flow during light sleep--a H(2)(15)O-PET study. J Sleep Res. 2002;11:201–7. doi: 10.1046/j.1365-2869.2002.00303.x. [DOI] [PubMed] [Google Scholar]
- Laufs H, Walker MC, Lund TE. ‘Brain activation and hypothalamic functional connectivity during human non-rapid eye movement sleep: an EEG/fMRI study’--its limitations and an alternative approach. Brain. 2007;130:e75. doi: 10.1093/brain/awm084. author reply e6. [DOI] [PubMed] [Google Scholar]
- Logothetis NK, Pauls J, Augath M, Trinath T, Oeltermann A. Neurophysiological investigation of the basis of the fMRI signal. Nature. 2001;412:150–7. doi: 10.1038/35084005. [DOI] [PubMed] [Google Scholar]
- Lu ST, Kajola M, Joutsiniemi SL, Knuutila J, Hari R. Generator sites of spontaneous MEG activity during sleep. Electroencephalogr Clin Neurophysiol. 1992;82:182–96. doi: 10.1016/0013-4694(92)90166-f. [DOI] [PubMed] [Google Scholar]
- Maquet P. Functional neuroimaging of normal human sleep by positron emission tomography. J Sleep Res. 2000;9:207–31. doi: 10.1046/j.1365-2869.2000.00214.x. [DOI] [PubMed] [Google Scholar]
- McGlone F, Dunseath R, Stern J. Simultaneous EEG and functional MRI employing novel noise reduction. Epilepsia. 2009;50:82. [Google Scholar]
- Ogilvie RD. The process of falling asleep. Sleep Med Rev. 2001;5:247–70. doi: 10.1053/smrv.2001.0145. [DOI] [PubMed] [Google Scholar]
- Schabus M, Dang-Vu TT, Albouy G, Balteau E, Boly M, Carrier J, et al. Hemodynamic cerebral correlates of sleep spindles during human non-rapid eye movement sleep. Proc Natl Acad Sci U S A. 2007;104:13164–9. doi: 10.1073/pnas.0703084104. [DOI] [PMC free article] [PubMed] [Google Scholar]
- Schachter SC, Guttag J, Schiff SJ, Schomer DL. Advances in the application of technology to epilepsy: the CIMIT/NIO Epilepsy Innovation Summit. Epilepsy Behav. 2009;16:3–46. doi: 10.1016/j.yebeh.2009.06.028. [DOI] [PMC free article] [PubMed] [Google Scholar]
- Sekine A, Niiyama Y, Kutsuzawa O, Shimizu T. A negative component superimposed on event-related potentials during light drowsiness. Psychiatry Clin Neurosci. 2001;55:473–8. doi: 10.1046/j.1440-1819.2001.00892.x. [DOI] [PubMed] [Google Scholar]
- Stern J. Atlas of EEG Patterns. Philadelphia: Lippincott Williams and Wilkins; 2005. [Google Scholar]
- Stern JM. Simultaneous electroencephalography and functional magnetic resonance imaging applied to epilepsy. Epilepsy Behav. 2006;8:683–92. doi: 10.1016/j.yebeh.2006.03.002. [DOI] [PubMed] [Google Scholar]
- Woolrich MW, Ripley BD, Brady M, Smith SM. Temporal autocorrelation in univariate linear modeling of FMRI data. Neuroimage. 2001;14:1370–86. doi: 10.1006/nimg.2001.0931. [DOI] [PubMed] [Google Scholar]
- Worsley KJ, Evans AC, Marrett S, Neelin P. A three-dimensional statistical analysis for CBF activation studies in human brain. J Cereb Blood Flow Metab. 1992;12:900–18. doi: 10.1038/jcbfm.1992.127. [DOI] [PubMed] [Google Scholar]