

Abstract
Background
Two recent large meta-analyses of genome-wide association studies of lung function in general populations of European descent identified 11 candidate genes/regions. The importance of these genes in lung function in whites and African Americans with asthma is unknown.
Objectives
To determine if genes that regulate lung function in general populations are associated with lung function abnormalities in subjects with asthma from different racial groups.
Methods
SNPs were tested in five asthma populations (n = 1,441) for association with pulmonary function and meta-analysis was performed across populations. The SNPs with the highest significance were then tested for association with bronchodilator reversibility and bronchial hyperresponsiveness to methacholine (BHR). A joint analysis of consistently replicated SNPs was performed to predict lung function in asthma.
Results
Hedgehog interacting protein (HHIP) on chromosome 4q31 was associated with lung function in all five populations, rs1512288: Pmeta = 9.62E-05 and 3.23E-05 for ppFEV1 and ppFVC, respectively. The SNPs in HHIP were also associated with reversibility (P < 0.05) but not BHR. Because of differences in linkage disequilibrium in the African-American subjects, the most relevant SNPs in HHIP were identified. A subset of normal lung function genes, including HHIP, family with sequence similarity 13, member A (FAM13A), and patched homolog 1 (PTCH1), together predict lung function abnormalities, a measure of severity in whites and African Americans with asthma.
Conclusion
A subset of the genes, including HHIP, which regulate lung function in general populations are associated with abnormal lung function in asthma in non-Hispanic whites and African Americans.
Keywords: Asthma, Genetics, Asthma severity, Meta-analysis, FEV1, FVC, FEV1/FVC, HHIP, FAM13A, PTCH1
INTRODUCTION
Asthma is a heterogeneous disease which is classified phenotypically as mild, moderate, or severe based on NAEPP, GINA, or ATS guidelines1-3 and more recently, five asthma severity phenotypes were identified using cluster analysis.4 The majority of morbidity and health care utilization occurs in severe asthma; a phenotype largely determined by pulmonary function (baseline lung function: percent predicted (pp) FEV1, ppFVC, and FEV1/FVC).3,4 Quantitative phenotypes such as ppFEV1 are essential for categorizing asthma severity for both current guidelines classification or with cluster methodologies.5
A recent GWAS meta-analysis for pulmonary function in 20,890 participants from general populations of European white ancestry (CHARGE consortium) found that genes in the INTS12-GSTCD-NPNT region were associated with FEV1 and eight genes (HHIP, GPR126, ADAM19, AGER-PPT2, FAM13A, PTCH1, PID1, and HTR4) were associated with FEV1/FVC.6 A second GWAS meta-analysis for lung function in general populations (20,288 participants of European whites ancestry: SpiroMeta consortium), identified four genes (HHIP, GSTCD, TNS1, and HTR4) associated with FEV1 and three loci (HHIP, NOTCH4-AGER-PPT2, THSD4) associated with FEV1/FVC.7 While these genes may only influence lung function in subjects without respiratory diseases, we hypothesize that some of these genes are important in determining lung function in subjects with asthma. Identifying the genetic variants that influence pulmonary function in asthma is of major importance because these genomic approaches will lead to improved understanding of biologic factors that regulate lung function in asthma: a fundamental determinant of asthma severity.8
In this study, we performed meta-analysis of ppFEV1, ppFVC, and FEV1/FVC in five asthma populations including non-Hispanic whites and African Americans to determine if the genes previously identified in the two GWAS for normal variation of lung function are important in determining lung function in subjects with asthma. Our primary hypothesis was to determine whether the previously identified SNP in each gene which was significant in the general population is important in asthma; therefore we analyzed 1 SNP in each of the 11 genes (Three additional SNPs were analyzed in HHIP since they are in strong LD with the previously identified SNP.). In order to present a more comprehensive view of each gene, the additional SNPs already genotyped in the 11 genes were analyzed as a secondary analysis. Importantly, the previous studies did not include subjects of African descent, a population with increased frequency and severity of asthma.3,5,9,10
METHODS
Study Subjects
Subjects with mild to severe asthma were recruited at the NHLBI funded Severe Asthma Research Program (SARP) centers and carefully characterized including baseline spirometry with a medication withhold before testing.3,4 Similar baseline spirometry was performed in subjects with severe or difficult-to-treat asthma from The Epidemiology and Natural History of Asthma: Outcomes and Treatment Regimens (TENOR) multi-center study.11,12 In addition, subjects with asthma who were studied in the NHLBI Collaborative Studies on the Genetics of Asthma (CSGA) by the Wake Forest investigators using similar protocol were included in the analyses.9 TENOR, SARP, and CSGA studies were approved by the appropriate Institutional Review Board at the participating sites including appropriate informed consent.
DNA was isolated using standard protocols, and SNP genotyping was performed using the Illumina HumanCNV370 BeadChip for TENOR.12 SARP and CSGA samples were genotyped using the Illumina HumanHap1M BeadChip (unpublished data). Genotyping for both studies was performed using BeadStudio (Illumina, Inc.).
Statistical Analysis
SARP cases were removed if they 1) had low genotyping call rates (< 95%), 2) were discrepant or ambiguous for genetic sex (heterozygous haploid genotype percentage ≥ 0.01 or X chromosome homozygosity F ≥ 0.9), 3) were different from described race, 4) failed the check for family relatedness (PI_HAT > 0.125), 5) were detected as an outlier (> 6 standard deviation for the first or second principal component). After subjects meeting these criteria were excluded, SNPs were removed if 1) the call rates were still low (95%), 2) inconsistent with Hardy-Weinberg Equilibrium (HWE) (P < 10E-04), 3) minor allele frequency (MAF) was less than 0.05. Quality control of TENOR and CSGA cases was performed in a similar manner.
A linear additive model was used for analysis of ppFEV1, ppFVC, FEV1/FVC, and gene-gene interaction analysis using PLINK (version 1.06, URL: http://pngu.mgh.harvard.edu/purcell/plink/),13 adjusted for age, sex, and significant principal components (EIGENSTRAT, version 3.0, URL: http://genepath.med.harvard.edu/~reich/Software.htm).14 Haploview (URL: http://www.broad.mit.edu/mpg/haploview/) was used to generate linkage disequilibrium plots,15 and 95% confidence intervals on D’ was used to define blocks.16 For the primary analysis, 14 SNPs in 11 candidate genes/regions were analyzed for replication at SNP level (rs6845536, rs720485, rs1828591, and rs1512288 in HHIP, rs2571445 in TNS1, rs10516526 in INTS12-GSTCD-NPNT, rs3995090 in HTR4, rs2070600 in NOTCH-AGER-PPT2, rs1913768 in THSD4, rs11155242 in GPR126, rs2277027 in ADAM19, rs2869967 in FAM13A, rs10512249 in PTCH1, and rs1358443 in PID1). Using a more relaxed replication standard,17 assuming gene as a unit and related phenotypes as similar, the most significant SNPs were reported for each candidate genes.
Meta-analysis of P values from three non-Hispanic white populations, two African American populations, or all of five populations was performed with weights proportional to the squareroot of the sample size using METAL software (URL: http://www.sph.umich.edu/csg/abecasis/metal/). Meta-analysis of effect size (regression slope) of the identified candidate SNPs was performed with weights proportional to sample size using rmeta package based on random effects model (URL: http://cran.rproject.org/web/packages/rmeta/index.html). To reduce genomic inflation, P values with genomic control adjustment from each population were used for meta-analysis.
Joint analysis of three most consistent SNPs (rs1512288 in HHIP, rs576594 in PTCH1, and rs2869967 in FAM13A) or five SNPs (rs1512288 in HHIP, rs576594 in PTCH1, rs2869967 in FAM13A, rs3845823 in PID1, and rs206015 in NOTCH4) was performed in SARP non-Hispanic whites, SARP African Americans, and TENOR whites. Genotypes with 1 or 2 minor alleles were merged together and recoded as 0 (if minor allele was protective allele) or 1 (if minor allele was risk allele). A linear additive model was used for analysis of ppFEV1, ppFVC, FEV1/FVC with the number of risk SNPs. A logistic regression model was used for analysis of percent of subjects with severe asthma using ATS and cluster classification3,4 with the number of risk SNPs.
RESULTS
Although the three studies used similar clinical approaches to carefully phenotype cases, they differ in the proportion of subjects with severe asthma since SARP is a cohort that is enriched for subjects with severe asthma; TENOR focused on “difficult-to-treat” or severe asthma; while CSGA recruited a cohort including all levels of severity but primarily focused on milder levels of asthma severity. These differences are reflected in baseline lung function (see Table E1 in the Online Repository). The cohorts have a broad range of lung function with slightly lower levels in the SARP and TENOR subjects with asthma consistent with the recruitment of subjects with more severe asthma in these studies.
After quality control analysis was completed as described above, data from 1,441subjects with asthma (SARP non-Hispanic whites (n = 438), TENOR non-Hispanic whites (n = 431), CSGA non-Hispanic whites (n = 230), SARP African Americans (n = 206), and CSGA African Americans (n = 136)) were analyzed for association with spirometric measures of lung function: ppFEV1, ppFVC, and FEV1/FVC, and the SNPs in 11 genes identified through two recent meta-analyses of GWAS of normal lung function. The issue of multiple testing was minimized since only 14 SNPs in 11 previously identified genes were analyzed for replication at SNP level (P value for Bonferroni adjustment was 3.57E-03, P = 0.05/14SNPs).
The SNP rs1512288 at 5′ flanking region of HHIP showed the most consistent association in all five cohorts of subjects with asthma (Pmeta = 9.62E-05, 3.23E-05, and 0.11 for ppFEV1, ppFVC, and FEV1/FVC, respectively) (Table I, Fig 1A, and see Table E2 and Table E3 in the Online Repository). The linkage disequilibrium (LD) structure of HHIP region is different between non-Hispanic Whites and African Americans (Fig 1B and Fig 1C). The SNPs with the lowest P values: rs6845536, rs720485, rs1828591, and rs1512288, are in strong LD in non-Hispanic whites (R2 > 0.5), but in weak LD in African Americans (R2 < 0.5). SNP rs6845536 at 5′ flanking region of HHIP, in LD with rs1512288 (R2 = 0.63), showed the strongest signal in non-Hispanic white populations (Pmeta = 1.08E-04, 3.20E-04, and 0.08 for ppFEV1, ppFVC, and FEV1/FVC, respectively), while SNP rs1512288 had the strongest signal in African Americans (Pmeta = 7.74E-04, 5.11E-04, and 0.30 for ppFEV1, ppFVC, and FEV1/FVC, respectively). Thus, we conclude based on the LD structure in African Americans that rs1512288 is either the causal SNP or in LD with a smaller set of SNPs (Table I and Fig 1).
Table I.
Meta-analysis results of 34 SNPs in HHIP region in five asthmatic populations.
| ppFEV1 | ppFVC | FEV1/FVC | |||||||||||
|---|---|---|---|---|---|---|---|---|---|---|---|---|---|
| No. | SNP | Minor (risk) Allele C/A§ |
Coordinate | Location | Pmeta* | Pmeta_C† | Pmeta_A‡ | Pmeta* | Pmeta_C† | Pmeta_A‡ | Pmeta* | Pmeta_C† | Pmeta_A‡ |
| 1 | rs4362772 | C | 145549252 | 5UTR | |||||||||
| 2 | rs749316 | G | 145590796 | 0.029 | 7.3E-03 | 0.752 | 0.046 | 0.047 | 0.597 | 0.734 | 0.437 | 0.478 | |
| 3 | rs7684769 | T | 145638960 | ||||||||||
| 4 | rs12641251 | G/A | 145644293 | ||||||||||
| 5 | rs6827794 | T | 145649747 | ||||||||||
| 6 | rs1512282 | C | 145650947 | ||||||||||
| 7** | rs6845536 | C (C) | 145672233 | 2.8E-04 | 1.1E-04 | 0.600 | 2.5E-04 | 3.2E-04 | 0.288 | 0.109 | 0.077 | 0.911 | |
| 8** | rs720485 | C (A) | 145682038 | 4.4E-04 | 2.6E-03 | 0.067 | 1.1E-04 | 1.2E-03 | 0.035 | 0.141 | 0.201 | 0.462 | |
| 9** | rs1828591 | G (A) | 145700230 | 1.5E-04 | 1.6E-03 | 0.036 | 8.6E-05 | 1.2E-03 | 0.023 | 0.175 | 0.140 | 0.901 | |
| 10** | rs1512288 | T (C) | 145710731 | 9.6E-05 | 9.5E-03 | 7.7E-04 | 3.2E-05 | 4.5E-03 | 5.1E-04 | 0.112 | 0.214 | 0.300 | |
| 11 | rs2175586 | A | 145716391 | ||||||||||
| 12 | rs1996020 | C | 145730644 | ||||||||||
| 13 | rs7670758 | A | 145731325 | 0.0 10 | 1.8E-04 | 0.149 | 6.9E-03 | 1.8E-04 | 0.224 | 0.242 | 0.090 | 0.510 | |
| 14 | rs7677662 | G | 145732503 | ||||||||||
| 15 | rs2353397 | C | 145737028 | 0.022 | 5.9E-03 | 0.820 | 0.044 | 0.012 | 0.701 | 0.086 | 0.089 | 0.640 | |
| 16 | rs4835180 | G | 145740058 | ||||||||||
| 17 | rs2035901 | G/A | 145741317 | 0.340 | 0.232 | 0.854 | 0.054 | 0.033 | 0.920 | 0.721 | 0.485 | 0.593 | |
| 18 | rs11947381 | T | 145757300 | 0.851 | 0.651 | 0.232 | 0.022 | 1.8E-03 | 0.356 | 0.097 | 0.100 | 0.651 | |
| 19 | rs2575570 | T | 145768383 | ||||||||||
| 20 | rs1398244 | T | 145781907 | 0.258 | 0.464 | 0.314 | 0.734 | 0.600 | 0.804 | 0.005 | 0.007 | 0.355 | |
| 21 | rs6845999 | T | 145785276 | ||||||||||
|
| |||||||||||||
| 22 | rs1812175 | T | 145794294 | intron | |||||||||
| 23 | rs2220514 | T | 145796008 | ||||||||||
| 24 | rs2306924 | A | 145801986 | ||||||||||
| 25 | rs6537307 | G | 145821313 | ||||||||||
| 26 | rs2575580 | C | 145824475 | 0.936 | 0.600 | 0.270 | 0.270 | 0.929 | 0.033 | 0.099 | 0.132 | 0.496 | |
| 27 | rs6537310 | T | 145856182 | 0.275 | 0.108 | 0.523 | 0.074 | 7.3E-03 | 0.240 | 0.996 | 0.934 | 0.872 | |
| 28 | rs6854783 | G | 145862529 | 0.264 | 0.107 | 0.552 | 0.055 | 7.3E-03 | 0.373 | 0.960 | 0.895 | 0.729 | |
|
| |||||||||||||
| 29 | rs11944404 | C | 145890321 | 3UTR | 0.034 | 0.142 | 0.088 | 0.297 | 0.535 | 0.300 | 0.133 | 0.211 | 0.396 |
| 30 | rs4835186 | T | 145906597 | ||||||||||
| 31 | rs2353934 | T | 145916490 | 0.446 | 0.911 | 0.173 | 0.125 | 0.516 | 0.045 | 0.928 | 0.876 | 0.922 | |
| 32 | rs12647866 | C | 145928136 | ||||||||||
| 33 | rs12651029 | A | 145989617 | 0.040 | 0.020 | 0.963 | 0.013 | 3.2E-03 | 0.822 | 0.852 | 0.651 | 0.662 | |
| 34 | rs13102609 | T | 145990671 | ||||||||||
Only rows with at least one entry with P value less than 0.05 are showed.
Pmeta is the meta-analysis P value for all five asthmatic populations.
Pmeta_C is the meta-analysis P value for three non-Hispanic White populations.
Pmeta_A is the meta-analysis P value for two African American populations.
Minor (risk) Allele C/A represents minor (risk) allele of non-Hispanic White and African American populations, respectively. Risk alleles are labeled for SNPs 7-10 only. Please refer to Table E2 and E3 for other risk alleles.
SNPs 7-10 are the four SNPs studied for strict replication since they are in strong LD with the previously identified SNP. Results from the other previously genotyped SNPs are presented for completeness but are the results of a secondary analysis.
Figure 1.

Linkage disequilibrium (LD) and association plot of 34 SNPs in HHIP. (A) Association plot: blue diamond, red square, green triangle, purple cross, and cyan asterisk represents TENOR, SARP non-Hispanic White, CSGA non-Hispanic White, SARP African American, and CSGA African American population, respectively. (B) LD plot of non-Hispanic Whites. (C)LD plot of African Americans: r2 color scheme was used and labeled. 95% confidence intervals on D’ was used to set up blocks.
The effect size (regression slope) of rs1512288 was consistent among five asthma populations (Heterogeneity P value = 0.41) (Fig 2). The summary effect size was 2.83 (with SD = 1.37) and ppFEV1 increases 2.83% on average with every copy of the minor allele T. For non-Hispanic whites from the SARP cohort, the effect size was 2.32 (with SD = 1.30) for ppFEV1 or 0.085 (with SD = 0.056) for baseline FEV1 and FEV1 differed by 85 ml on average with every copy of the minor allele T; for African Americans from SARP, the effect size was 5.87 (with SD = 1.87) for ppFEV1 or 0.252 (with SD = 0.077) for baseline FEV1 and FEV1 differed 252 ml on average with every copy of the minor allele T.
Figure 2.

Forest plot of rs1512288 of HHIP with ppFEV1. Random effects model are applied on effect size of regression slope. TENOR, SARP_C, CSGA_C, SARP_A, and CSGA_A represents TENOR, SARP non-Hispanic White, CSGA non-Hispanic White, SARP African American, and CSGA African American population, respectively.
SNPs in HHIP were associated with bronchodilator reversibility (rs720485: P = 0.024 and 0.057 for non-Hispanic whites and African Americans, respectively) but not with bronchial hyperresponsiveness to methacholine (BHR, logPC20) (see Table E4 in the Online Repository). Analysis results from the other genes previously identified for lung function in general populations identified five genes (FAM13A, NOTCH4, THSD4, PTCH1, and PID1) that were associated significantly with lung function in asthma at the SNP or gene level (Table II and see Table E5 and Table E6 in the Online Repository). At the SNP level, rs2869967, in the intron of family with sequence similarity 13, member A (FAM13A) on chromosome 4q22 was significant (Pmeta = 2.9E-03 for FVC) using strict replication standards and after correction for multiple testing. This signal was driven mainly by non-Hispanic whites. NOTCH4 on chromosome 6p21, THSD4 on chromosome 15q23, PTCH1 on chromosome 9q22-q31, and PID1 on chromosome 2q36 were significant (Table II), using a more relaxed replication standard at the gene level. TNS1 on chromosome 2q35-q36, GSTCD on chromosome 4q24, HTR4 on chromosome 5q31-q33, GPR126 on chromosome 6q23-q24, and ADAM19 on chromosome 5q33, were not significant after correcting for multiple testing.
Table II.
Meta-analysis results of 10 candidate genes in five asthmatic populations.
| ppFEV1 | ppFVC | FEV1/FVC | ||||||||||
|---|---|---|---|---|---|---|---|---|---|---|---|---|
| Previously Identified SNPs | Tested SNPs | LD C/A§ |
Minor (risk) Allele C/A§ |
Pmeta* | Pmeta_C† | Pmeta_A‡ | Pmeta* | Pmeta_C† | Pmeta_A‡ | Pmeta* | Pmeta_C† | Pmeta_A‡ |
| TNS1: rs2571445 | rs2571445 | 1 | T | 0.14 | 0.47 | 0.08 | 0.11 | 0.47 | 0.05 | 0.71 | 0.76 | 0.83 |
| rs929937 | 0/0 | C/T | 0.32 | 0.64 | 0.22 | 0.01 | 0.06 | 0.02 | 0.56 | 0.43 | 0.80 | |
|
| ||||||||||||
| INTS12-GSTCD-NPNT: rs10516526 | rs10516526 | 1 | G | 0.80 | 0.96 | 0.68 | 0.61 | 0.91 | 0.21 | 0.68 | 0.79 | 0.70 |
| rs3960769 | 0/0 | A | 0.08 | 0.12 | 0.41 | 0.47 | 0.81 | 0.28 | 0.01 | 0.06 | 0.05 | |
|
| ||||||||||||
| HTR4: rs3995090 | rs3995090 | 1 | C | 0.10 | 0.14 | 0.45 | 0.43 | 0.37 | 1.00 | 0.24 | 0.51 | 0.22 |
| rs1833710 | 0/0 | C | 0.04 | 0.01 | 0.63 | 0.02 | 0.01 | 0.97 | 0.67 | 0.24 | 0.20 | |
|
| ||||||||||||
| NOTCH4-AGER-PPT2: rs2070600 | rs2070600 | 1 | A | 0.33 | 0.91 | 0.07 | 0.74 | 0.43 | 0.45 | 0.36 | 0.79 | 0.02 |
| rs206015 | 0.7/NA | T | 3.2E-03 | 2.0E-04 | 0.51 | 0.01 | 9.0E-04 | 0.63 | 0.47 | 0.22 | 0.47 | |
|
| ||||||||||||
| THSD4: rs12899618 | rs1913768 | 1/0.8 | A | 0.32 | 0.41 | 0.58 | 0.69 | 0.96 | 0.36 | 0.04 | 0.07 | 0.41 |
| rs1568010 | 0.2/0 | C | 0.09 | 0.12 | 0.50 | 0.82 | 0.83 | 0.38 | 2.9E-03 | 0.05 | 0.01 | |
|
| ||||||||||||
| GPR126: rs11155242 | rs11155242 | 1 | C | 0.16 | 0.16 | 0.70 | 0.95 | 0.75 | 0.65 | 0.25 | 0.22 | 0.87 |
| rs171891 | 0.9/0.6 | A | 0.02 | 0.02 | 0.59 | 0.91 | 0.95 | 0.91 | 0.36 | 0.37 | 0.81 | |
|
| ||||||||||||
| ADAM19: rs2277027 | rs2277027 | 1 | C/A | 0.59 | 0.46 | 0.83 | 0.54 | 0.82 | 0.40 | 0.98 | 0.64 | 0.36 |
| rs6890282 | 0/0 | G/T | 0.03 | 0.18 | 0.05 | 0.69 | 0.71 | 0.88 | 0.16 | 0.57 | 0.06 | |
|
| ||||||||||||
| FAM13A: rs2869967 | rs2869967 | 1 | C/T (C/T) | 0.26 | 0.17 | 0.88 | 2.9E-03 | 4.9E-03 | 0.29 | 0.20 | 0.09 | 0.69 |
| rs6830970 | 0.6/0.2 | G | 0.10 | 0.15 | 0.44 | 1.6E-03 | 0.01 | 0.09 | 0.36 | 0.12 | 0.34 | |
|
| ||||||||||||
| PTCH1: rs16909898 | rs10512249 | 1/0.6 | T | 0.72 | 0.93 | 0.57 | 0.22 | 0.24 | 0.69 | 0.51 | 0.76 | 0.41 |
| rs576594 | 0.1/0.2 | T (T/C) | 9.0E-04 | 6.5E-07 | 0.04 | 0.01 | 1.9E-05 | 0.03 | 0.01 | 1.1E-03 | 0.90 | |
|
| ||||||||||||
| PID1: rs1435867 | rs1358443 | 0.3/0.1 | C | 0.18 | 0.44 | 0.16 | 0.31 | 0.20 | 0.84 | 0.04 | 0.36 | 0.01 |
| rs3845823 | 0/0 | T | 0.02 | 0.01 | 0.81 | 3.8E-04 | 1.0E-03 | 0.17 | 0.86 | 0.56 | 0.48 | |
The first SNP in each gene was tested under our primary hypothesis of testing the previously reported SNP (or one in strong LD) for strict replication of the results in the general population. The second SNP listed for each gene is the SNP with the strongest p-value across the gene to present a more comprehensive view of each gene (secondary analysis).
Pmeta is the meta-analysis P value for all five asthmatic populations.
Pmeta_C is the meta-analysis P value for three non-Hispanic White populations.
Pmeta_A is the meta-analysis P value for two African American populations.
LD C/A and Minor (risk) Allele C/A represent R2 of LD between tested SNPs and candidate SNPs and minor (risk) allele of non-Hispanic White and African American populations, 517 respectively. Risk alleles are labeled for rs2869967 and rs576594 only. Please refer to Table E5 and E6 for other risk alleles.
Among these 11 genes, PTCH1 is another gene involved in HH signaling pathway. SNP rs576594 was associated with ppFEV1 (Pmeta = 6.5E-07), ppFVC (Pmeta = 1.9E-05), and FEV1/FVC (Pmeta = 1.1E-03) in the white populations, specifically the extensively phenotyped SARP cohort with broader ranges of asthma severity and lung function (Table II and see Table E5 and Table E6 in the Online Repository). The association of rs576594 was observed in the African Americans, although weaker (P < 0.05) and interestingly in the opposite direction. Since HHIP and PTCH1 had overlapping functions in HH signaling pathway, gene-gene interaction between them was analyzed. Interactions were tested between rs1512288 of HHIP and 14 PTCH1 SNPs (LD R2 < 0.3). No interaction was found in three white populations, however interaction (P < 0.05) was observed in the two African American populations (rs3824491: P = 8.5E-03, 0.071, and 0.051 for meta-analysis, SARP, and CSGA African Americans, respectively) (see Table E7 in the Online Repository). This interaction needs to be replicated in other populations since the two African American populations have smaller sample sizes.
Joint analysis of the most consistently associated SNPs, based on our/previous study and biological function6,7 (rs1512288 in HHIP, rs576594 in PTCH1, and rs2869967 in FAM13A), was performed. With the increase in the number of risk SNPs, ppFEV1, ppFVC, and FEV1/FVC decreased (range of p values of 0.08 to 0.003) (Table III). The results were consistent for SARP non-Hispanic whites, SARP African Americans and TENOR, and may be generalized to other populations. Modeling with the three best SNPs, limited variance (0.7% - 4%) was explained (Table III), indicating there are maybe more genes involved. Joint analysis of SNPs from 5 replicated genes (HHIP, PTCH1, FAM13A, PID1, and NOTCH4) generated a more significant trend in SARP non-Hispanic whites, a cohort that was recruited for a wide range of asthma severity and pulmonary function (P = 9.8E-06 for ppFEV1) (Fig 3A and see Table E8 in the Online Repository), and less significant in TENOR, a cohort with a narrower range of lung function (P = 0.01 for ppFEV1). In SARP non-Hispanic whites, ppFEV1 decreased significantly from 85.4 to 80.8, then to 78.5, 74.5, and finally to 62.9 when the number of risk SNPs increased from 0 to 5 (Fig 3A). Because of this relationship, we analyzed two measures of asthma severity in the SARP non-Hispanic whites. The first was based on ATS criteria for severe asthma3 by comparing severe asthma (group 5) and mild asthma (groups 1 and 2) while the second used our newer approach to asthma phenotypic classification based on cluster analysis4 by comparing the more severe clusters (clusters 3, 4, and 5) with the less severe clusters (clusters 1 and 2). As seen in Figure 3B, there is an increase in severity as the number of risk SNPs increases (P = 6.0E-04 and 2.7E-03 for ATS and cluster classification, respectively).
Table III.
Joint analysis of 3 SNPs in HHIP, PTCH1, and FAM13A.
| SARP non-Hispanic whites | ||||||
|
| ||||||
| Number of risk SNPs * | 0 | 1 | 2 | 3 | P value | R2 |
|
| ||||||
| N | 42 | 141 | 175 | 71 | ||
|
| ||||||
| ppFEV1 | 83 ± 22 | 80 ± 21 | 74 ± 23 | 73 ± 22 | 0.003 | 0.02 |
| ppFVC | 92 ± 19 | 90 ± 17 | 85 ± 20 | 84 ± 17 | 0.004 | 0.02 |
| FEV1/FVC | 0.75 ± 0.1 | 0.72 ± 0.1 | 0.71 ± 0.1 | 0.70 ± 0.1 | 0.03 | 0.01 |
|
| ||||||
| TENOR non-Hispanic whites | ||||||
|
| ||||||
| Number of risk SNPs * | 0 | 1 | 2 | 3 | P value | R2 |
|
| ||||||
| N | 47 | 137 | 192 | 60 | ||
|
| ||||||
| ppFEV1 | 87 ± 26 | 78 ± 19 | 78 ± 20 | 72 ± 23 | 0.003 | 0.02 |
| ppFVC | 91 ± 21 | 89 ± 17 | 90 ± 17 | 84 ± 19 | 0.08 | 0.007 |
| FEV1/FVC | 0.77 ± 0.1 | 0.72 ± 0.1 | 0.72 ± 0.1 | 0.71 ± 0.1 | 0.007 | 0.02 |
|
| ||||||
| SARP African Americans | ||||||
|
| ||||||
| Number of risk SNPs * | 0 | 1 | 2 | 3 | P value | R2 |
|
| ||||||
| N | 15 | 78 | 82 | 30 | ||
|
| ||||||
| ppFEV1 | 85 ± 26 | 80 ± 20 | 75 ± 20 | 71 ± 17 | 0.005 | 0.04 |
| ppFVC | 97 ± 23 | 91 ± 19 | 88 ± 17 | 88 ± 16 | 0.06 | 0.02 |
| FEV1/FVC | 0.72 ± 0.1 | 0.74 ± 0.1 | 0.71 ± 0.1 | 0.69 ± 0.1 | 0.07 | 0.02 |
Number of risk SNPs is the sum of risk SNPs in HHIP (rs1512288), PTCH1 (rs576594), and FAM13A (rs2869967).
Figure 3.
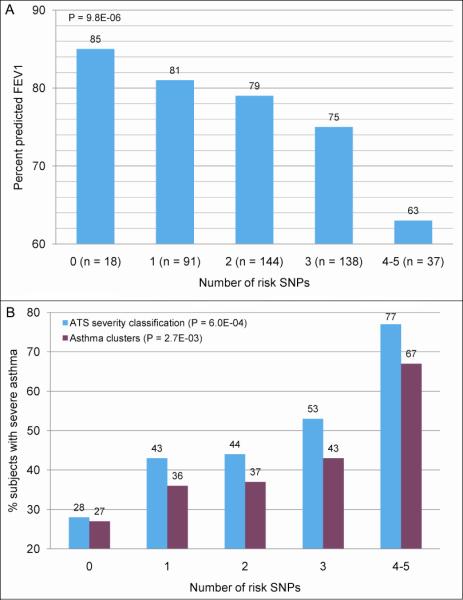
Joint analysis of 5 SNPs in HHIP, PTCH1, FAM13A, PID1, and NOTCH4 in SARP non-Hispanic whites for A: percent predicted FEV1 and B: percent of subjects with severe asthma based on ATS and cluster classification.3,4
DISCUSSION
In this study, a meta-analysis of 1,441 extensively phenotyped subjects with a broad range of asthma severity from five asthma cohorts was performed. These studies differ in the proportion of subjects with severe asthma. However, these studies used similar comprehensive approaches to characterize subjects with asthma, thus their combined use in a meta-analysis is an appropriate approach. Genomic inflation was weak (inflation factor < 1.1 for every phenotype/population tested) and was adjusted in every population before meta-analysis.
HHIP was the most consistently replicated gene in the five asthmatic populations. HHIP protein is a regulatory factor of the hedgehog signaling pathway interacting directly with all three hedgehog (HH) family members, sonic hedgehog (SHH), indian hedgehog (IHH), and desert hedgehog (DHH).18 HHIP protein attenuates HH signaling through a negative feedback mechanism by interacting with HH proteins.18 Patched (PTC) protein prevents HH signaling thorough binding to smoothened (SMO) in the absence of HH; However, HH protein together with cholesterol releases PTC and transduces signals through SMO.19,20 In mouse studies, HHIP and Patched homolog 1 (PTCH1) proteins had been shown with a partially overlapping feedback function for HH signaling pathway.21 HH protein regulates branching morphogenesis of tracheal-bronchial mesenchyme22 and influences embryonic lung morphogenesis.23 HHIP and PTCH1 are significantly associated with human height.24,25 However, in studies involving measures of lung function such as ppFEV1 and ppFVC, adjustments for height are used in the calculation of percent predicted values. In GWASs of lung functions primarily in subjects without pulmonary diseases, HHIP was associated with FEV1 and FEV1/FVC.6,7,26 In a GWAS of chronic obstructive pulmonary disease (COPD), HHIP was associated with the risk of developing COPD;27 however, since the definition of COPD includes an abnormal level of lung function in a long term smoker, this association may primarily reflect the association with pulmonary function.
The SNPs in HHIP most frequently identified in the previous GWAS in non-Hispanic Whites were all in strong LD, and, thus, causal SNPs could not be determined. The SNPs identified previously were either the same or in very strong LD (R2 > 0.9) with the SNPs found in this study.6,7 Very importantly, the differences in LD structure between African Americans and non-Hispanic whites allowed identification of a single SNP, rs1512288 (Table I and Fig 1). In our study, the association of HHIP with lung functions in non-Hispanic white populations was consistent with the previous GWAS, including SNPs in a large range from 5′ flanking region to introns. In African American populations, the association was primarily due to rs1512288, indicating it was either the causal or in LD with causal SNPs, however only functional studies can determine the true causal SNPs. The effect directions of rs1512288 were the same for non-Hispanic whites and African Americans, i.e., ppFEV1 increased with copy numbers of minor allele T. The effect size of rs1512288 was larger in African Americans than non-Hispanic whites (Fig 2). Our results confirmed the importance of cross-validation using more than one population with different LD structures. Second-generation sequencing to identify rare SNPs and causal SNPs of HHIP in larger African American populations, such as SARP, is warranted in the future.
The SNPs in HHIP were also associated with reversibility but not with bronchial hyperresponsiveness (logPC20) (see Table E4 in the Online Repository). Bronchodilator reversibility is a measure of the ability of the lung to return or improve to more nearly normal function. Hence, the association of HHIP with bronchodilator reversibility is consistent with the association with baseline lung function. Furthermore, SNPs in HHIP were not identified by several other GWASs of asthma susceptibility28-31 and was not associated with asthma susceptibility in TENOR (see Table E9 in the Online Repository). Based on these data, variation in HHIP is important in determining level of lung function in subjects with asthma, which represents an important determinant of asthma severity.
Five genes (FAM13A, NOTCH4-AGER-PPT2, THSD4, PTCH1, and PID1) were also significantly associated with lung function at the SNP or gene level (Table II and see Table E5 and Table E6 in the Online Repository). FAM13A was the only gene (except HHIP) replicated at SNP levels, although in FVC instead of FEV1/FVC as in previous findings.6 Interestingly, a recent GWAS of COPD susceptibility identified variants in FAM13A (rs7671167 and rs1903003: both in moderate LD (R2 > 0.5) with rs2869967).31 Both HHIP and FAM13A were associated with level of lung function in subjects with and without asthma6, 7 and associated with COPD susceptibility,27,32 but not asthma susceptibility in previous GWAS, which may suggest genetic differences between the development of asthma or COPD. However, it is important to remember that the definition of COPD is based on abnormal levels of lung function while subjects with asthma may have normal or abnormal levels of baseline lung function, especially those subjects with mild asthma. On the other hand, asthma, COPD, and other lung diseases may share some common genetic pathways. For example, MMP12 and ADAM33 have been shown to be associated with lung function, COPD, and asthma.33-35 Genes including HHIP and FAM13A are associated with normal lung function,6,7 COPD susceptibility,27,32 and asthma severity; therefore, further study of these candidates with lung function in COPD populations is warranted.35 Normally, a single SNP/gene has limited predictive power for common diseases, and thus, joint analysis of the most consistent SNPs in HHIP, PTCH1, and FAM13A was performed. With the increase in the number of risk SNPs, ppFEV1, ppFVC, and FEV1/FVC decreased significantly and consistently for SARP non-Hispanic whites, SARP African Americans and TENOR, and may be generalized to other populations (Table III). Joint analysis of SNPs from 5 replicated genes (HHIP, PTCH1, FAM13A, PID1, and NOTCH4) generated a more significant trend in SARP non-Hispanic whites, a cohort that was recruited for a wide range of asthma severity (Fig 3A and see Table E8 in the Online Repository). Asthma severity is strongly related to levels of lung function,3,4 and there was a significant relationship between the number of risk SNPs and the percent of severe asthmatics based on either ATS criteria or cluster analysis (Fig 3B). Although model over-fitting might be a problem, the results should be generalizable since the SNPs used in the joint analysis were common for normal lung function, COPD susceptibility, and asthma severity and the effect directions were consistent for SARP, TENOR, and CSGA populations.
In summary, these results demonstrate important associations between variation in HHIP with lung function in five cohorts of well characterized asthma subjects (n = 1,441). Because of LD among HHIP SNPs in white populations, multiple SNPs were significant. However, in the two African-American cohorts, we narrowed the signal to one SNP (rs1512288). Pulmonary function is a major determinant of asthma severity.1-4 Combinations of risk lung function SNPs identified asthmatics with increasing reductions in lung function (Table III and Fig 3). Thus, lung function in these asthma cohorts tracked with the number of risk genotypes and this additive genetic approach could be useful in predicting lung function decline and asthma severity. However, longitudinal studies evaluating changes in asthma lung function in relationship to these genes are needed.
Supplementary Material
ACKNOWLEDGMENTS
We would also like to acknowledge all investigators, staff and participants in the SARP, TENOR, and CSGA studies.
Declaration of all sources of funding: SARP centers were supported by NIH grants HL69116, HL69130, HL69149, HL69155, HL69167, HL69170, HL69174, HL69349, UL1RR024992, M01RR018390, M01RR07122, M01RR03186, HL087665, and HL091762. Genetic studies for SARP and CSGA were funded by NIH HL87665. The clinical TENOR study was supported by Genentech, Inc. and Novartis Pharmaceuticals Corporation, and the genetic studies were funded by NIH HL76285 and HL87665.
Abbreviations used
- CSGA
Collaborative Studies on the Genetics of Asthma
- FAM13A
family with sequence similarity 13, member A
- HHIP
Hedgehog interacting protein
- PTCH1
patched homolog 1
- ppFEV1
percentage predicted FEV1
- SARP
Severe Asthma Research Program
- TENOR
The Epidemiology and Natural History of Asthma: Outcomes and Treatment Regimens
Footnotes
Publisher's Disclaimer: This is a PDF file of an unedited manuscript that has been accepted for publication. As a service to our customers we are providing this early version of the manuscript. The manuscript will undergo copyediting, typesetting, and review of the resulting proof before it is published in its final citable form. Please note that during the production process errors may be discovered which could affect the content, and all legal disclaimers that apply to the journal pertain.
Clinical Implications Lung function is a major determinant of asthma severity. Combinations of risk lung function SNPs in HHIP, PTCH1, and FAM13A identified asthmatics with lower levels of lung function.
Capsule summary Our results show that specific genes affect not only normal variations in lung function but importantly, also level of lung function in asthma, and may be useful in predicting lung function decline and asthma severity.
REFERENCES
- 1.National Asthma Education and Prevention Program . Expert Panel Report 3: Guidelines for the diagnosis and management of asthma. National Heart, Lung, and Blood Institute; Bethesda, MD: 2007. No. 07-4051. Available at http://www.nhlbi.nih.bov/guidelines/asthma. [Google Scholar]
- 2.Global Initiative for Asthma: Global Strategy for Asthma Management and Prevention (GINA) National Institutes of Health; National Heart, Lung, and Blood Institute; [Updated 2008]. Available at http://www.ginasthma.org. [Google Scholar]
- 3.Moore WC, Bleecker ER, Curran-Everett D, Erzurum SC, Ameredes BT, Bacharier L, et al. Characterization of the severe asthma phenotype by the National Heart, Lung, and Blood Institute’s Severe Asthma Research Program. J Allergy Clin Immunol. 2007;119:405–13. doi: 10.1016/j.jaci.2006.11.639. [DOI] [PMC free article] [PubMed] [Google Scholar]
- 4.Moore WC, Meyers DA, Wenzel SE, Teague WG, Li H, Li X, et al. Identification of Asthma Phenotypes Using Cluster Analysis in the Severe Asthma Research Program. Am J Respir Crit Care Med. 2010;181:315–23. doi: 10.1164/rccm.200906-0896OC. [DOI] [PMC free article] [PubMed] [Google Scholar]
- 5.Miller MK, Johnson C, Miller DP, Deniz Y, Bleecker ER, Wenzel SE. Severity assessment in asthma: An evolving concept. J Allergy Clin Immunol. 2005;116:990–5. doi: 10.1016/j.jaci.2005.08.018. [DOI] [PubMed] [Google Scholar]
- 6.Hancock DB, Eijgelsheim M, Wilk JB, Gharib SA, Loehr LR, Marciante KD, et al. Meta-analyses of genome-wide association studies identify multiple loci associated with pulmonary function. Nat Genet. 2010;42:45–52. doi: 10.1038/ng.500. [DOI] [PMC free article] [PubMed] [Google Scholar]
- 7.Repapi E, Sayers I, Wain LV, Burton PR, Johnson T, Obeidat M, et al. Genome-wide association study identifies five loci associated with lung function. Nat Genet. 2010;42:36–44. doi: 10.1038/ng.501. [DOI] [PMC free article] [PubMed] [Google Scholar]
- 8.Weiss ST. Lung function and airway diseases. Nat Genet. 2010;42:14–6. doi: 10.1038/ng0110-14. [DOI] [PubMed] [Google Scholar]
- 9.Xu J, Meyers DA, Ober C, Blumenthal MN, Mellen B, Barnes KC, et al. Genomewide screen and identification of gene-gene interactions for asthma-susceptibility loci in three U.S. populations: collaborative study on the genetics of asthma. Am J Hum Genet. 2001;68:1437–46. doi: 10.1086/320589. [DOI] [PMC free article] [PubMed] [Google Scholar]
- 10.Lester LA, Rich SS, Blumenthal MN, Togias A, Murphy S, Malveaux F, et al. Ethnic differences in asthma and associated phenotypes: collaborative study on the genetics of asthma. J Allergy Clin Immunol. 2001;108:357–62. doi: 10.1067/mai.2001.117796. [DOI] [PubMed] [Google Scholar]
- 11.Dolan CM, Fraher KE, Bleecker ER, Borish L, Chipps B, Hayden ML, et al. Design and baseline characteristics of the epidemiology and natural history of asthma: Outcomes and Treatment Regimens (TENOR) study: a large cohort of patients with severe or difficult-to-treat asthma. Ann Allergy Asthma Immunol. 2004;92:32–9. doi: 10.1016/S1081-1206(10)61707-3. [DOI] [PubMed] [Google Scholar]
- 12.Li X, Howard TD, Zheng SL, Haselkorn T, Peters SP, Meyers DA, et al. Genome-wide association study of asthma identifies RAD50-IL13 and HLA-DR/DQ regions. J Allergy Clin Immunol. 2010;125:328–35. doi: 10.1016/j.jaci.2009.11.018. [DOI] [PMC free article] [PubMed] [Google Scholar]
- 13.Purcell S, Neale B, Todd-Brown K, Thomas L, Ferreira MA, Bender D, et al. PLINK: a tool set for whole-genome association and population-based linkage analyses. Am J Hum Genet. 2007;81:559–75. doi: 10.1086/519795. [DOI] [PMC free article] [PubMed] [Google Scholar]
- 14.Price AL, Patterson NJ, Plenge RM, Weinblatt ME, Shadick NA, Reich D. Principal components analysis corrects for stratification in genome-wide association studies. Nat Genet. 2006;38:904–9. doi: 10.1038/ng1847. [DOI] [PubMed] [Google Scholar]
- 15.Barrett JC, Fry B, Maller J, Daly MJ. Haploview: analysis and visualization of LD and haplotype maps. Bioinformatics. 2005;21:263–5. doi: 10.1093/bioinformatics/bth457. [DOI] [PubMed] [Google Scholar]
- 16.Gabriel SB, Schaffner SF, Nguyen H, Moore JM, Roy J, Blumenstiel B, et al. The structure of haplotype blocks in the human genome. Science. 2002;296:2225–9. doi: 10.1126/science.1069424. [DOI] [PubMed] [Google Scholar]
- 17.Vercelli D. Discovering susceptibility genes for asthma and allergy. Nat Rev Immunol. 2008;8:169–82. doi: 10.1038/nri2257. [DOI] [PubMed] [Google Scholar]
- 18.Chuang PT, McMahon AP. Vertebrate Hedgehog signalling modulated by induction of a Hedgehog-binding protein. Nature. 1999;397:617–21. doi: 10.1038/17611. [DOI] [PubMed] [Google Scholar]
- 19.Ingham PW. Localized hedgehog activity controls spatial limits of wingless transcription in the Drosophila embryo. Nature. 1993;366:560–2. doi: 10.1038/366560a0. [DOI] [PubMed] [Google Scholar]
- 20.Tabin CJ, McMahon AP. Recent advances in hedgehog signalling. Trends Cell Biol. 1997;7:442–6. doi: 10.1016/S0962-8924(97)01159-8. [DOI] [PubMed] [Google Scholar]
- 21.Jeong J, McMahon AP. Growth and pattern of the mammalian neural tube are governed by partially overlapping feedback activities of the hedgehog antagonists patched 1 and Hhip1. Development. 2005;132:143–54. doi: 10.1242/dev.01566. [DOI] [PubMed] [Google Scholar]
- 22.Miller LA, Wert SE, Clark JC, Xu Y, Perl AK, Whitsett JA. Role of Sonic hedgehog in patterning of tracheal-bronchial cartilage and the peripheral lung. Dev Dyn. 2004;231:57–71. doi: 10.1002/dvdy.20105. [DOI] [PubMed] [Google Scholar]
- 23.Warburton D, Bellusci S, De Langhe S, Del Moral PM, Fleury V, Mailleux A, et al. Molecular mechanisms of early lung specification and branching morphogenesis. Pediatr Res. 2005;57:26R–37R. doi: 10.1203/01.PDR.0000159570.01327.ED. [DOI] [PubMed] [Google Scholar]
- 24.Weedon MN, Lango H, Lindgren CM, Wallace C, Evans DM, Mangino M, et al. Genome-wide association analysis identifies 20 loci that influence adult height. Nat Genet. 2008;40:575–83. doi: 10.1038/ng.121. [DOI] [PMC free article] [PubMed] [Google Scholar]
- 25.Gudbjartsson DF, Walters GB, Thorleifsson G, Stefansson H, Halldorsson BV, Zusmanovich P, et al. Many sequence variants affecting diversity of adult human height. Nat Genet. 2008;40:609–15. doi: 10.1038/ng.122. [DOI] [PubMed] [Google Scholar]
- 26.Wilk JB, Chen TH, Gottlieb DJ, Walter RE, Nagle MW, Brandler BJ, et al. A genome-wide association study of pulmonary function measures in the Framingham Heart Study. PLoS Genet. 2009;5:e1000429. doi: 10.1371/journal.pgen.1000429. [DOI] [PMC free article] [PubMed] [Google Scholar]
- 27.Pillai SG, Ge D, Zhu G, Kong X, Shianna KV, Need AC, et al. A genome-wide association study in chronic obstructive pulmonary disease (COPD): identification of two major susceptibility loci. PLoS Genet. 2009;5:e1000421. doi: 10.1371/journal.pgen.1000421. [DOI] [PMC free article] [PubMed] [Google Scholar]
- 28.Sleiman PM, Flory J, Imielinski M, Bradfield JP, Annaiah K, Willis-Owen SA, et al. Variants of DENND1B associated with asthma in children. N Engl J Med. 2010;362:36–44. doi: 10.1056/NEJMoa0901867. [DOI] [PubMed] [Google Scholar]
- 29.Moffatt MF, Kabesch M, Liang L, Dixon AL, Strachan D, Heath S, et al. Genetic variants regulating ORMDL3 expression contribute to the risk of childhood asthma. Nature. 2007;448:470–3. doi: 10.1038/nature06014. [DOI] [PubMed] [Google Scholar]
- 30.Himes BE, Hunninghake GM, Baurley JW, Rafaels NM, Sleiman P, Strachan DP, et al. Genome-wide association analysis identifies PDE4D as an asthma-susceptibility gene. Am J Hum Genet. 2009;84:581–93. doi: 10.1016/j.ajhg.2009.04.006. [DOI] [PMC free article] [PubMed] [Google Scholar]
- 31.Mathias RA, Grant AV, Rafaels N, Hand T, Gao L, Vergara C, et al. A genome-wide association study on African-ancestry populations for asthma. J Allergy Clin Immunol. 2010;125:336–46. e4. doi: 10.1016/j.jaci.2009.08.031. [DOI] [PMC free article] [PubMed] [Google Scholar]
- 32.Cho MH, Boutaoui N, Klanderman BJ, Sylvia JS, Ziniti JP, Hersh CP, et al. Variants in FAM13A are associated with chronic obstructive pulmonary disease. Nat Genet. 2010 doi: 10.1038/ng.535. [DOI] [PMC free article] [PubMed] [Google Scholar]
- 33.Hunninghake GM, Cho MH, Tesfaigzi Y, Soto-Quiros ME, Avila L, Lasky-Su J, et al. MMP12, lung function, and COPD in high-risk populations. N Engl J Med. 2009;361:2599–608. doi: 10.1056/NEJMoa0904006. [DOI] [PMC free article] [PubMed] [Google Scholar]
- 34.Van Eerdewegh P, Little RD, Dupuis J, Del Mastro RG, Falls K, Simon J, et al. Association of the ADAM33 gene with asthma and bronchial hyperresponsiveness. Nature. 2002;418:426–30. doi: 10.1038/nature00878. [DOI] [PubMed] [Google Scholar]
- 35.Sadeghnejad A, Ohar JA, Zheng SL, Sterling DA, Hawkins GA, Meyers DA, et al. Adam33 polymorphisms are associated with COPD and lung function in long-term tobacco smokers. Respir Res. 2009;10:21. doi: 10.1186/1465-9921-10-21. [DOI] [PMC free article] [PubMed] [Google Scholar]
Associated Data
This section collects any data citations, data availability statements, or supplementary materials included in this article.