Abstract
Background
A noninvasive single photon emission computed tomography (SPECT) method was developed and validated to measure gastric volumes (GV). The natural variation in gastric volume responses and performance characteristics of SPECT imaging are unclear.
Aims
Our primary aim was to assess the performance characteristics of SPECT imaging by estimating the inter-individual coefficients of variation (COV) in fasting and postprandial GV in 433 participants in prior research studies over the last decade, and the intra-individual COV in all volunteers who had undergone at least 2 studies. A second aim was to assess the relationship of gender, BMI and age on GV.
Results
The COVINTER for all subjects in the study (n=433) was 32.6% fasting, 16.0% fed, and 19.0 % Δ fed - fasting. The COVINTRA for 47 subjects with repeat estimates of gastric volume was 37.0% fasting, 17.6% fed, and 22.0 % Δ fed - fasting. COVINTRA was stable over time interval from 2 to 60 months. There were no significant differences by gender or subgroups. Mean fed and gastric accommodation volumes were associated with age and BMI but the magnitude of variation attributable was <5%.
Conclusions
COVINTRA and COVINTER of GV by SPECT are very similar, and there is a small effect of age and BMI. These data are important for planning future studies of GV and further validate SPECT for studies of gastric motility disorders and obesity.
Keywords: dyspepsia, obesity, variation, coefficient, Bland-Altman
INTRODUCTION
Gastric accommodation results from gastric wall relaxation and is associated with the postprandial increase in gastric volume. Single photon emission computed tomography (SPECT) imaging has been developed to quantify gastric accommodation (1); this involves intravenously administering 99mTc pertechnetate, imaging with a large field of view dual-head gamma camera system, and reconstruction of tomographic images with computer programs (e.g. Analyze ™ software) to measure total gastric volume. With this technique, the entire stomach volume can be measured noninvasively and used to assess fasting gastric volume and the gastric response to a meal. Bouras et al. validated the measurements obtained by SPECT using the intragastric barostatically-controlled balloon as comparator (2). Several studies have documented the effects of disease states [e.g. dyspepsia, diabetes, post-fundoplication (3)], explored the potential effect of obesity (4), and documented the effects of drugs and hormones that affect gastric motor function including erythromycin and nitrates (5), 5-HT3 antagonist (6), and glucagon-like peptide 1 (7,8) which illustrate the responsiveness of the measurement and its relevance as a biomarker.
A previous study estimated intra-observer coefficients of variation in measurement of fasting and postprandial volumes to be 9% and 8%, and inter-individual observer variations 13% and 12%, respectively (1). In 8 healthy volunteers, the inter- and intra-individual coefficients of variation in post-liquid meal change in gastric volume measured ~ 47 weeks apart were 13% and 13.8%, respectively (9). Thus, the performance characteristics of SPECT imaging to measure gastric volume are not documented in large numbers of patients or healthy controls. This has significant implications for understanding natural variation in gastric volume responses, as well as the planning for future studies of the effects of disease or intervention, for which sample sizes need to be based on the coefficient of variation within and between individuals.
The aims of the current study were to assess the performance characteristics of SPECT imaging by estimating the intra- and inter-individual coefficients of variation (COV) in fasting and postprandial gastric volumes in participants in research studies conducted over the last decade and to assess potential effects of body mass index (BMI), gender and age.
METHODS
Data Source
Data were derived in a retrospective manner from a database of healthy volunteers, patients who are overweight or obese, and patients with diabetes or dyspepsia who have previously undergone measurements of gastric volume by single photon emission computed tomography (SPECT) (see Appendix for list of previously published articles). All the participants in the previous studies were evaluated by the same clinical team (gastroenterologists, nurses and coordinators) in a single clinical research unit. Only data obtained at baseline or after randomization to a placebo group were included. The vast majority of participants were healthy, and the numbers with dyspepsia, meal related dyspepsia [who were previously reported to have Rome II dyspepsia and fully characterized by Castillo et al. (10)] and type II diabetes are shown in Table I. Further details are provided in the individual papers listed in the Appendix. Some individuals participated in more than one study over a period ranging from 2 to 80 months, providing data to evaluate intra-subject variations and to assess whether the variation in measurements differed with the length of the time interval between repeat studies. All data were analyzed by the same technologist (DDB), as a preliminary report suggested some inter-rater variation in volume estimates (11). We used the earliest available for all inter-subject assessments, and the first 2 measurements for intra-subject assessments.
Table I.
Participant Demographics and Gastric Volumes (mean ± SE)
| Overall | Overall | Healthy Volunteers | Dyspepsia | Meal- related Dyspepsia | Type 2 Diabetes | ||
|---|---|---|---|---|---|---|---|
| F | M | ||||||
| Number | 433 | 291 | 142 | 354 | 60 | 12 | 7 |
| Age | 37.4±0.7 | 36.7±0.8 | 38.7±1.2 | 36.0±0.6 | 40.8±2.5 | 51.9±3.0 | 52.7±2.9 |
| BMI | 27.5±.28 | 27.3±.36 | 28.1±.42 | 27.7±.30 | 25.3±.68 | 30.9±1.7 | 33.7±2.6 |
| Gastric Volume, ml | |||||||
| Baseline (fasting) | 245±3.8 | 243±7.8 | 248±6.4 | 239±4.2 | 274±10.9 | 247±16.2 | 253±20.7 |
| Mean postprandial | 762±5.9 | 762±6.9 | 760±11.0 | 757±6.2 | 786±19.6 | 777±35.6 | 770±19.7 |
| Delta fed – fasting | 517±4.7 | 519±5.6 | 512±8.9 | 517±5.1 | 512±14.9 | 530±29.5 | 517±32.9 |
All participants had provided written consent in each of the previously conducted studies. The current analysis was approved by the Institutional Review Board (IRB) at Mayo Clinic, Rochester, Minnesota. Patients in the current study had provided general research authorization to use their data in future studies as required by the Mayo Clinic IRB.
Fasting and Postprandial Gastric Volumes
The noninvasive SPECT method to measure gastric volume during fasting and 30 minutes after ingesting 300 mL (316 kcal) of EnsureR (Abbott Labs, Abbott Park, IL) has been extensively described elsewhere (1,2,4). Image-processing libraries (AVW 3.0, Biomedical Imaging; Mayo Foundation) were used to obtain a 3-dimensional rendering of the stomach and its volume (mL) was calculated. Two images were obtained postprandially in >95% of participants, and the average used to estimate postprandial volume.
Statistical Analysis
The primary endpoints of interest were fasting gastric volume, mean postprandial gastric volume, and “accommodation” volume, that is, the difference between average postprandial and fasting volumes. The association of subgroup status with gastric volumes was assessed using analysis of covariance (ANCOVA) models adjusting for age, gender and BMI. Inter-individual COV (COVinter) was calculated as the mean/standard deviation (SD) and expressed as a percentage. Intra-individual COV (COVintra) was calculated by the SD of the differences in repeat measurements/overall mean of the two measurements, and expressed as a percentage. We also plotted the differences in the two measurements over the time interval between repeat studies, and performed Bland-Altman plots of the relationship between the difference and the average of the repeat measurements in 47 healthy participants (29 female, 18 male).
RESULTS
Participant Demographics and Gastric Volumes
Four hundred thirty-three subjects who had previously undergone gastric accommodation measurements by SPECT were included in this study. Table I summarizes the baseline characteristics (mean ± SEM) of age, gender and BMI, as well as gastric volumes for the entire study overall and separated into subgroups of healthy volunteer, dyspepsia, meal-related dyspepsia, and type 2 diabetes.
Performance Characteristics
Inter-subject variation of gastric volume parameters
The COVINTER in all subjects in the study (n=433) and in each subgroup for fasting, fed, and Δ fed – fasting volumes are summarized in Table II. The numbers across groups are very similar except for a relatively small inter-individual volume noted in the 7 type II diabetics included in the study.
Table II.
Inter-individual Coefficients of Variation (%) for each Group of Participants
| Overall | Overall | Healthy Volunteers | Dyspepsia | Meal- related Dyspepsia | Type 2 Diabetes | ||
|---|---|---|---|---|---|---|---|
| F | M | ||||||
| Number | 433 | 291 | 142 | 354 | 60 | 12 | 7 |
| Gastric Volume, ml | |||||||
| Baseline (fasting) | 32.6 | 33.5 | 30.8 | 33.1 | 30.7 | 22.8 | 21.6 |
| Mean postprandial | 19.3 | 15.4 | 17.3 | 15.5 | 19.3 | 15.9 | 6.8 |
| Delta fed – fasting | 22.6 | 18.2 | 20.6 | 18.5 | 22.6 | 19.3 | 16.8 |
A statistically significant association of fasting volumes with clinical subgroup was detected (p=0.024), though there were no clinically important differences in volumes among subgroups. In particular, although there was a statistically significant univariate association of subtype with the variation in mean fed volumes (p=0.045) after adjusting for age, gender and BMI, this association was only borderline significant (p=0.079).
Intra-subject variation of gastric volume parameters
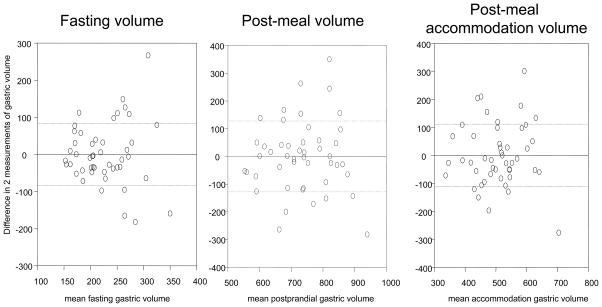
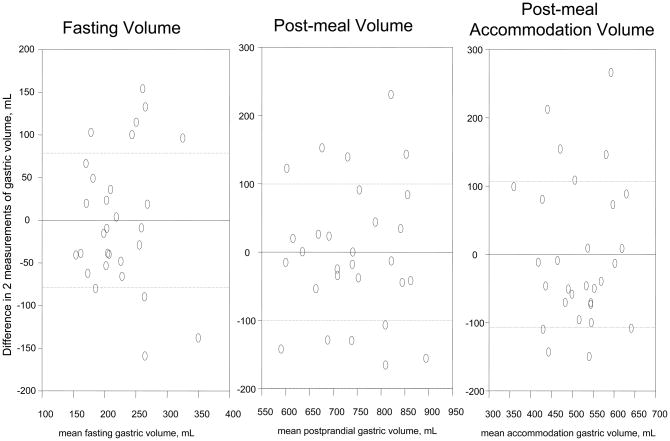
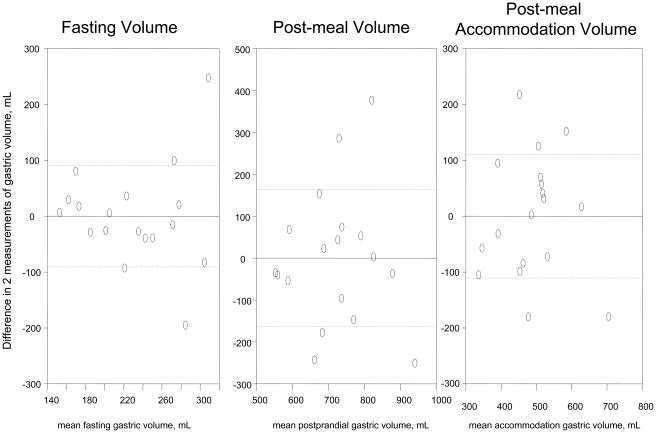
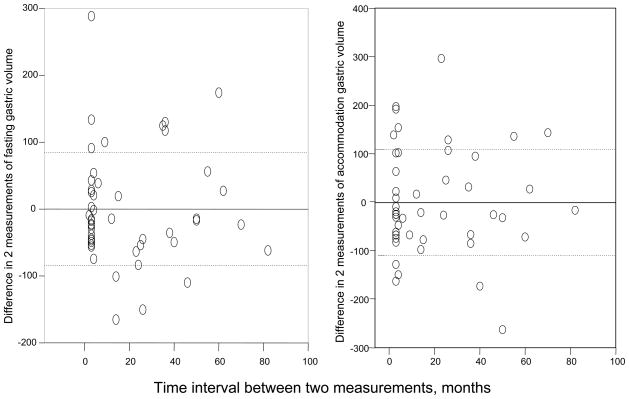
The COVINTRA for participants with repeat estimates of gastric volume (n=47, all healthy volunteers) was 37.0% fasting, 17.6% fed, and 22.0% Δ fed – fasting (Table III). The Bland- Altman plots in Figure 1 show the intra-subject variations for all the healthy volunteers, as well as separate plots for 29 females and 18 males. Figure 2 shows that the variation was similar over the time interval from 2 to 80 months.
Table III.
Data for 47 Healthy Volunteers (mean ± SD) including Intra-individual Coefficients of Variation (%) Overall and for each Gender
| All Healthy Volunteers | ||||||
|---|---|---|---|---|---|---|
| F | M | F and M | ||||
| N | 29 | 18 | 47 | |||
| Age, y | 39.6±10.7 | 36.1±11.1 | 38.3±10.8 | |||
| BMI, kg/m2 | 28.8±6.0 | 30.3±5.3 | 29.4±5.7 | |||
| Gastric Volume, ml | Intra COV | |||||
| F | M | Overall | ||||
| Baseline #1 (fasting) | 211.8±64.3 | 217.4±79.0 | 214.0±69.5 | 35.3 | 41.5 | 37.4 |
| Baseline #2 (fasting) | 235.5±59.0 | 242.5±57.3 | 238.2±57.8 | |||
| Mean postprandial #1 | 734.1±94.5 | 695.6±126.1 | 719.4±108.0 | 13.6 | 22.9 | 17.6 |
| Mean postprandial #2 | 748.9±109.5 | 743.6±144.8 | 746.9±122.7 | |||
| Delta fed – fasting #1 | 522.3±95.1 | 478.1±91.0 | 505.4±96.1 | 20.8 | 24.1 | 22.0 |
| Delta fed – fasting #2 | 513.4±84.1 | 501.1±126.1 | 508.7±101.1 | |||
Figure 1. Intra-individual reliability of gastric volume measurements by SPECT.
A. All healthy participants, n=47
B. Female participants, n=29
C. Male participants, n=18
Figure 2.
Differences in gastric volume over different time intervals in the 47 healthy volunteers
Normative Data and Proportion of Disease Groups with Abnormal Gastric Volumes
Table IV shows data from 354 healthy volunteers for fasting, mean postprandial, and accommodation volumes. Using the 5th–95th percentiles to define normal ranges, there were 7 of 60 dyspepsia patients with abnormal (>95th percentile) fasting gastric volume; 15 of 60 dyspepsia patients (5 low, and 10 high) and 1 of 12 meal-related dyspepsia (low) with abnormal mean postprandial gastric volumes; there were 9 of 60 dyspepsia patients (6 low, and 3 high), 1 of 12 meal-related dyspepsia (low) and 1 of 7 type 2 diabetes (low) with abnormal post-meal accommodation gastric volumes.
Table IV.
Normative Data for Gastric Volumes in 354 Healthy Volunteers
| Gastric Volume, mL | Mean | SD | Median | 5th %ile | 10th %ile | 90th %ile | 95th %ile |
|---|---|---|---|---|---|---|---|
| Fasting | 239.3 | 79.1 | 224.3 | 144.5 | 161.5 | 342.2 | 369.7 |
| Mean Post-Meal | 756.6 | 117.3 | 750.1 | 591.0 | 622.0 | 895.4 | 954.5 |
| Post-meal Accommodation | 517.3 | 95.6 | 513.4 | 371.2 | 399.0 | 640.5 | 689.0 |
Sample Size Estimates to Detect 20% Effect Size in Crossover and Parallel Design Studies
Given the calculated coefficients of variation, we estimated the sample sizes required to detect a 20% difference in fasting gastric volume and accommodation volume (Table V) in paired and unpaired studies.
Table V.
Sample Size Required to Detect Effect Size of 20% Volume in Crossover or 2-Group, Parallel Design Study (two-sided α=0.05, 80% power). Estimates for parallel group study based on overall data for health and disease; estimates for paired or crossover design based on 47 healthy participants with repeated measurements; effect size = difference between groups/overall mean
| Gastric Volume Endpoint | Overall Mean | Pooled SD | 20% Effect Size (mL) | # Needed/Group, Parallel Design |
|---|---|---|---|---|
| Fasting (mL) | 244.5 | 79.7 | 49 | 43 |
| Accommodation volume (mL) | 516.9 | 98.3 | 103 | 15 |
| Gastric Volume Endpoint | Overall Mean | SD of Deltas | 20% Effect Size (mL) | # Needed in Paired Study |
|---|---|---|---|---|
| Fasting (mL) | 226.1 | 84.7 | 49 | 26 |
| Accommodation volume (mL) | 507.0 | 111.5 | 103 | 12 |
Relationship between Gastric Volumes and Covariates of Interest
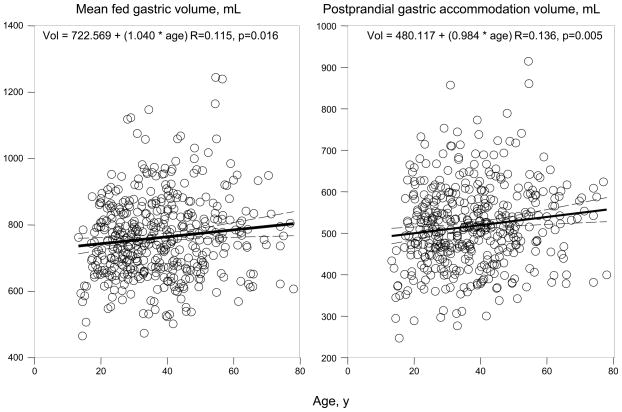
Figure 3A shows linear regression plots for the relationship between mean fed gastric volume and postprandial gastric accommodation volume with age. An increase of 1 year was associated with an increase in 1.04 ml of mean fed gastric volume and 0.64 ml of postprandial gastric accommodation volume, suggesting the relationship with age up to 65 years is not clinically significant.
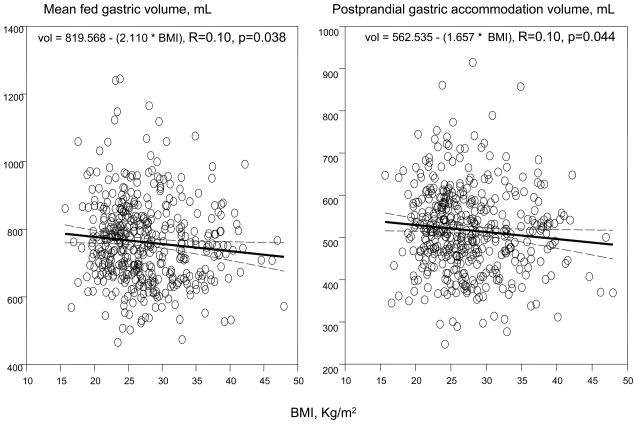
Figure 3.
Relationship of postprandial gastric volumes and age (A) and body mass index (B)
Figure 3B shows linear regression plots for the relationship between mean fed gastric volume and postprandial gastric accommodation volume with BMI. An increase of 1 unit of BMI was associated with a decrease in 2.11 ml of mean fed gastric volume and 1.66 ml of postprandial gastric accommodation volume. While statistically significant, probably as a result of the large sample size, the magnitude of the variance attributable to BMI is not clinically significant.
Overall, there was no significant association of gender with gastric volumes (Table I).
DISCUSSION
This study has characterized the inter- and intra-individual COVs in 433 participants, establishing the reliability of gastric volume measurements by SPECT. The results show that there is very similar variation between and within individuals for fasting, postprandial and accommodation volumes, and this suggests that, in intervention studies, the same statistical power would be anticipated for the same sample size in parallel-group and crossover studies. The intra-individual variation appears consistent over time.
The results in these 433 participants provide robust estimates of intra-individual and inter-individual COVs in fasting and postprandial volumes. The inter-individual COVs in the present cohort are larger than previously described in a study of 8 healthy volunteers (9). This increased COV reflects the larger standard deviation (in contrast to standard error of the mean) that typically occurs with an increase in sample size.
The current reliability data also complement the information on content and concurrent validity. The performance characteristics demonstrate reliability that is in the same range previously described for scintigraphic measurement of gastric emptying and colonic transit (12,13) and those observed with MRI measurements of gastric accommodation (14,15). Therefore, the performance of SPECT is certainly no worse than the normal variation in the functions that are measured with state-of-the-art methods in the stomach and colon. This suggests that the variation observed does not represent error in estimation of volumes but natural variation in stomach function. In the original paper describing the SPECT method (2), the precision of SPECT was assessed in vitro with R2 of 0.99 and in vivo in the human stomach with a defined volume placed into a barostat balloon positioned in the stomach (R2=0.7).
The current data were not intended to compare gastric volumes between health and disease states; indeed, the numbers of patient in the type 2 diabetes and meal-induced dyspepsia groups were too small to detect a physiologically relevant difference in postprandial accommodation volume, e.g. 100 mL, between the disease subgroup and the healthy participants. We have previously shown that community dyspepsia patients (who made up the vast majority of dyspeptics in this study) have normal gastric volumes (10), in contrast to tertiary referral patients with dyspepsia (3). There was a statistically significant difference in fasting gastric volume in dyspepsia compared to health (p=0.0023), but the magnitude of this difference was small, the volume in dyspepsia slightly higher, and the clinical significance of the finding unclear. Overall, the only sizable group of dyspepsia (n=60) showed a prevalence of 15% abnormal gastric accommodation volume, with two-thirds being abnormally low gastric accommodation. This is not surprising given the fact that there were several community dyspepsia patients in this cohort, and we had previously shown that as a group, the gastric volumes in community dyspepsia patients were typically normal (10), in contrast to referral dyspepsia patients (16,17). The Leuven group also showed that gastric accommodation contributes only minimally to the symptoms in patients with functional dyspepsia (18).
The only other study that has validated the reproducibility of gastric volume measurements was conducted with the barostat by the Leuven group (19). In that study, gastric accommodation was measured on different days in 13 patients with dyspepsia and 9 healthy subjects, with time interval median of 45 days (range 28–76 days). It was reported that there was excellent reproducibility for both dyspeptic patients and healthy control subjects, as there was no significant difference in the two measurements in each subgroup, and excellent correlation between the two estimates (R=0.71 and 0.74 in the healthy subjects and dyspeptic patients, respectively). A Bland-Altman plot provided by Sarnelli et al. (19) shows the range of variation in barostat volume measurement of accommodation (of proximal stomach) of +180 to −220 mL, which encompasses the entire range of accommodation volumes of the whole stomach observed with SPECT imaging in our 433 participants. Therefore, these data also confirm the veracity of the natural variation in gastric volumes that are measured within an individual in our SPECT study.
An alternative noninvasive measurement of gastric accommodation is available with gastric MRI (20–22). This has advantages such as lack of radiation exposure and results that are consistent with observations with SPECT, and inter- and intra-individual variations in the same range (14,15), as observed for SPECT in the current report. However, as with SPECT imaging, gastric MRI is also costly and not generally available to measure gastric accommodation in most radiology departments. We have previously reported on the application of 3-dimensional ultrasound as an alternative that is also applicable in adolescents (23). However, 3-dimensional ultrasound measurement of gastric volumes requires further validation and assessment of performance characteristics.
As indicated in the results section, covariates with potential impact on measured gastric volumes were also analyzed in this study; there was no effect of gender, while age and BMI were associated with small differences in postprandial and accommodation gastric volumes and clinically insignificant variation (<3% each).
In summary, these data enhance our understanding of the reliability of SPECT imaging to measure gastric volume during fasting and postprandially. These data are important for planning future studies of GV (illustrated in Table V) and further validate SPECT for studies of gastric function in motility disorders and obesity.
Acknowledgments
The excellent secretarial support of Mrs. Cindy Stanislav is gratefully acknowledged. Dr. Camilleri is supported by NIH grants R01-DK079866, RO1-DK67071, and 1RC1-DK086182. The authors’ contributions were: Mary Breen: data collection and analysis, writing the paper; Michael Camilleri: senior author, research program leader, data collection and analysis, writing the paper; Duane Burton: data collection and analysis; Alan Zinsmeister: statistical analysis, author.
Footnotes
Disclosures: The authors report no conflicts of interest relevant to this article.
References
- 1.Kuiken SD, Samsom M, Camilleri M, Mullan BP, Burton DD, Kost LJ, Hardyman TJ, O’Connor MK. Development of a test to measure gastric accommodation in humans. Am J Physiol. 1999;277:G1217–G1221. doi: 10.1152/ajpgi.1999.277.6.G1217. [DOI] [PubMed] [Google Scholar]
- 2.Bouras EP, Delgado-Aros S, Camilleri M, Castillo EJ, Burton DD, Thomforde GM, Chial HJ. SPECT imaging of the stomach: comparison with barostat and effects of sex, age, body mass index, and fundoplication. Gut. 2002;51:781–786. doi: 10.1136/gut.51.6.781. [DOI] [PMC free article] [PubMed] [Google Scholar]
- 3.Bredenoord AJ, Chial HJ, Camilleri M, Mullan BP, Murray JA. Gastric accommodation and emptying in evaluation of patients with upper gastrointestinal symptoms. Clin Gastroenterol Hepatol. 2003;1:264–272. [PubMed] [Google Scholar]
- 4.Vazquez Roque MI, Camilleri M, Stephens DA, Jensen MD, Burton DD, Baxter KL, Zinsmeister AR. Gastric sensorimotor functions and hormone profile in normal weight, overweight and obese people. Gastroenterology. 2006;131:1717–1724. doi: 10.1053/j.gastro.2006.10.025. [DOI] [PubMed] [Google Scholar]
- 5.Liau S-S, Camilleri M, Kim D-Y, Stephens D, Burton DD, O’Connor MK. Pharmacological modulation of human gastric volumes demonstrated noninvasively using SPECT imaging. Neurogastroenterol Motil. 2001;13:533–542. doi: 10.1046/j.1365-2982.2001.00287.x. [DOI] [PubMed] [Google Scholar]
- 6.Kuo B, Camilleri M, Burton D, Viramontes B, McKinzie S, Thomforde G, O’Connor MK, Brinkmann BH. Effects of 5-HT3 antagonism on postprandial gastric volume and symptoms in humans. Aliment Pharm Ther. 2002;16:225–233. doi: 10.1046/j.1365-2036.2002.01144.x. [DOI] [PubMed] [Google Scholar]
- 7.Delgado-Aros S, Kim D-Y, Burton DD, Thomforde GM, Stephens D, Brinkmann BH, Vella A, Camilleri M. Effect of GLP-1 on gastric volume, emptying, maximum volume ingested and postprandial symptoms in humans. Am J Physiol. 2002;282:G424–G431. doi: 10.1152/ajpgi.2002.282.3.G424. [DOI] [PubMed] [Google Scholar]
- 8.Delgado-Aros S, Vella A, Camilleri M, Low PA, Burton DD, Thomforde GM, Stephens D. Effects of glucagon-like peptide-1 and feeding on gastric volumes in diabetes mellitus with cardio-vagal dysfunction. Neurogastroenterol Motil. 2003;15:435–444. doi: 10.1046/j.1365-2982.2003.00422.x. [DOI] [PubMed] [Google Scholar]
- 9.DeSchepper H, Camilleri M, Cremonini F, Foxx-Orenstein A, Burton D. Comparison of gastric volumes in response to isocaloric liquid and mixed meals in humans. Neurogastroenterology and Motility. 2004;16:567–573. doi: 10.1111/j.1365-2982.2004.00533.x. [DOI] [PubMed] [Google Scholar]
- 10.Castillo EJ, Camilleri M, Locke GR, III, Burton DD, Stephens DA, Geno DM, Zinsmeister AR. A community-based, controlled study of the epidemiology and pathophysiology of dyspepsia. Clin Gastroenterol Hepatol. 2004;2:985–996. doi: 10.1016/s1542-3565(04)00454-9. [DOI] [PubMed] [Google Scholar]
- 11.Delgado Aros S, Burton DD, Brinkmann BH, Camilleri M. Reliability of a semiautomated analysis to measure gastric accommodation using SPECT in humans. Gastroenterology. 2001;120:A287. [Google Scholar]
- 12.Cremonini F, Mullan BP, Camilleri M, Burton DD, Rank MR. Performance characteristics of scintigraphic transit measurements for studies of experimental therapies. Aliment Pharm Ther. 2002;16:1781–1790. doi: 10.1046/j.1365-2036.2002.01344.x. [DOI] [PubMed] [Google Scholar]
- 13.Camilleri M. Scintigraphic biomarkers for colonic dysmotility. Clin Pharmacol Ther. 2010;87:748–753. doi: 10.1038/clpt.2010.23. [DOI] [PMC free article] [PubMed] [Google Scholar]
- 14.Fruehauf H, Goetze O, Steingoetter A, et al. Intersubject and intrasubject variability of gastric volumes in response to isocaloric liquid meals in functional dyspepsia and health. Neurogastroenterol Motil. 2007;19:553–561. doi: 10.1111/j.1365-2982.2007.00904.x. [DOI] [PubMed] [Google Scholar]
- 15.Fidler J, Bharucha AE, Camilleri M, Camp J, Burton D, Grimm R, Riederer SJ, Robb RA, Zinsmeister AR. Application of magnetic resonance imaging to measure fasting and postprandial volumes in humans. Neurogastroenterol Motil. 2009;21:42–51. doi: 10.1111/j.1365-2982.2008.01194.x. [DOI] [PMC free article] [PubMed] [Google Scholar]
- 16.Delgado-Aros S, Camilleri M, Cremonini F, Ferber I, Stephens D, Burton DD. Contributions of gastric volumes and gastric emptying to meal size and post-meal symptoms in functional dyspepsia. Gastroenterology. 2004;127:1685–1694. doi: 10.1053/j.gastro.2004.09.006. [DOI] [PubMed] [Google Scholar]
- 17.Bredenoord AJ, Chial HJ, Camilleri M, Mullan BP, Murray JA. Gastric accommodation and emptying in evaluation of patients with upper gastrointestinal symptoms. Clin Gastroenterol Hepatol. 2003;1:264–272. [PubMed] [Google Scholar]
- 18.Van Oudenhove L, Vandenberghe J, Geeraerts B, Vos R, Persoons P, Fischler B, Demyttenaere K, Tack J. Determinants of symptoms in functional dyspepsia: gastric sensorimotor function, psychosocial factors or somatisation? Gut. 2008;57:1666–1673. doi: 10.1136/gut.2008.158162. [DOI] [PubMed] [Google Scholar]
- 19.Sarnelli G, Vos R, Cuomo R, Janssens J, Tack J. Reproducibility of gastric barostat studies in healthy controls and in dyspeptic patients. Am J Gastroenterol. 2001;96:1047–1053. doi: 10.1111/j.1572-0241.2001.03520.x. [DOI] [PubMed] [Google Scholar]
- 20.Kunz P, Feinle C, Schwizer W, Fried M, Boesiger P. Assessment of gastric motor function during the emptying of solid and liquid meals in humans by MRI. J Magn Reson Imaging. 1999;9:75–80. doi: 10.1002/(sici)1522-2586(199901)9:1<75::aid-jmri10>3.0.co;2-i. [DOI] [PubMed] [Google Scholar]
- 21.De Zwart IM, Mearadji B, Lamb HJ, et al. Gastric motility: comparison of assessment with real-time MR imaging or barostat measurement initial experience. Radiology. 2002;224:592–597. doi: 10.1148/radiol.2242011412. [DOI] [PubMed] [Google Scholar]
- 22.Goetze O, Steingoetter A, Menne D, et al. The effect of macronutrients on gastric volume responses and gastric emptying in humans: a magnetic resonance imaging study. Am J Physiol. 2007;292:G11–G17. doi: 10.1152/ajpgi.00498.2005. [DOI] [PubMed] [Google Scholar]
- 23.Manini ML, Burton DD, Meixner DD, Eckert DJ, Callstrom M, Schmit G, El-Youssef M, Camilleri M. Feasibility and application of 3-dimensional ultrasound for measurement of gastric volumes in healthy adults and adolescents. J Pediatr Gastroenterol Nutr. 2009;48:287–293. doi: 10.1097/mpg.0b013e318189694f. [DOI] [PMC free article] [PubMed] [Google Scholar]


