

Abstract
The authors examined the prospective associations between marital status transitions and changes in fitness in men and women. Between 1987 and 2005, a total of 8,871 adults (6,900 men) aged 45.6 (standard deviation, 9.1) years were examined at the Cooper Clinic, Dallas, Texas; the median follow-up was ∼3 years. Marital transition categories (from single to married, married to divorced, divorced to remarried) were derived from self-reported marital status at baseline and follow-up. Fitness (maximal oxygen consumption) was assessed by a maximal treadmill test. Analyses were adjusted for baseline levels and changes in body mass index, physical activity, smoking, alcohol consumption, and major chronic diseases. Compared with the corresponding “control” groups (remaining single, married, or divorced), transitioning from being single to married was associated with a reduction in fitness in women (P = 0.03); divorce was associated with an increase in fitness in men (P = 0.04); and remarriage was associated with a reduction in fitness in men (P = 0.05). The authors conclude that the transitions to being married (from single to married or from divorced to remarried) are associated with a modest reduction, while divorce is associated with a modest increase in fitness levels in men. Study results suggest that these patterns may be different in women, but further research is required to confirm this.
Keywords: cohort studies, exercise, marital status, physical fitness
It is well known that cardiorespiratory fitness (hereafter called fitness) decreases with age. A recent report indicated that this decline is nonlinear and accelerates after 45 years of age (1). Similar trends are seen in men and women. Understanding the factors that are associated with this decline is important, as a recent meta-analysis has found that a 1-metabolic equivalent (MET, corresponding to 3.5 mL/minute/kg of oxygen consumption) decrease in fitness increases all-cause mortality by 13% (2). Traditionally, we have assumed that age-related decreases in fitness are the result of decreased participation in sport, active recreation, and other forms of physical activity, as well as changes in body composition, but few studies have examined the social factors that contribute to changes in fitness across the lifespan.
Current literature supports both positive and negative effects of being married on mental and physical health (3–7). For example, studies have shown that living in a relationship with a partner has a protective effect on the development of cognitive impairment later in life (6) and is associated with reduced mortality (7). However, getting married may also be related to an increased risk for overweight/obesity (3, 4). Associations between changes in marital status and lifestyle behaviors such as food choices and physical activity have also been examined (8–10). For example, an 18-year follow-up of young adults in Sweden found that “cohabitation” was associated with being less active than remaining single (8), and a 3-year follow-up of young women in the Australian Longitudinal Study of Women's Health found that those who married increased their risk of inactivity, compared with those who remained single (9). Although it is likely that these changes in physical activity could translate to changes in fitness, to our knowledge, no studies have examined the potential associations between marital transitions and changes in fitness. The Aerobics Center Longitudinal Study (ACLS), which tracked changes in fitness in almost 9,000 men and women between 1987 and 2005, provides a unique opportunity to examine changes in fitness over time in people who change their marital status: from single to married, from married to divorced, or from divorced to remarried.
On the basis of the physical activity literature (8, 9), we hypothesized that marital transitions involving a change to being married would be associated with a negative change in fitness level. This hypothesis is depicted in Figure 1.
Figure 1.

Graphical representation of the hypothesis tested in the present study, Dallas, Texas, 1987–2005. If being married is associated with a reduction in fitness, then fitness levels should change as shown in the figure.  O2max, maximal oxygen consumption.
MATERIALS AND METHODS
Study population
The ACLS is a prospective study conducted in men and women who came to the Cooper Clinic, Dallas, Texas (11–15). ACLS participants were mostly white (98%) and well educated, and most worked in executive or professional positions (16). All participants included in this study had 2 visits (measurement points) between 1987 and 2005. All completed a detailed questionnaire and underwent an extensive clinical evaluation, including a physical examination, fasting blood chemistry analyses, personal and family health history, anthropometry, smoking and alcohol use, physical activity, and a maximal exercise test. The study protocol was approved annually by the Institutional Review Board of the Cooper Institute.
Participants were adults (≥18 years) with valid data on fitness and marital status at baseline and follow up. In order to be included in this study, participants had to achieve ≥85% of their age-predicted maximal heart rate during the treadmill exercise test (408 were excluded; 319 men and 89 women) and to have a minimum 6-month interval between the baseline and follow-up visits (25 were excluded; 18 men and 7 women). The final sample included 8,871 participants (6,900 men and 1,971 women) aged 18–83 years at baseline (mean = 45.6 (standard deviation, 9.1)), who were followed up for a median period of 3.4 years (interquartile range, 2.0–6.2).
Measurements
Previous reports have described the examination in detail (13). Briefly, height and weight were measured on a standard scale and stadiometer. Body mass index (weight (kg)/height (m)2) was calculated. Fitness was defined as the total time of a symptom-limited maximal treadmill exercise test, using a modified Balke protocol (13, 17). The total time using the Balke protocol correlates highly with measured maximal oxygen consumption (O2max) in both men (r = 0.92) (18) and women (r = 0.94) (19). The test endpoint was volitional exhaustion or when the physician stopped it for medical reasons. We estimated O2max from the final treadmill speed and grade, using the formula, O2max (mL/kg/minute) = 3.5 + (0.1 × speed) + (1.8 × speed × grade) (20).
Information on leisure time physical activity, smoking (never, former smoker, current smoker), alcohol consumption (drinks/week), the presence of any major chronic disease, and marital status was obtained from a standardized medical history questionnaire. Physical activity was categorized as no activity, moderate activity (sporting or leisure time physical activity other than “walking, jogging, or running” or “walk, jog, or run” up to 10 miles/week), and high activity (walk, jog, or run >10 miles/week) (10 miles = 16.09 km). A chronic disease/condition index (ranging from 0 to 6) was defined as the presence of ≥1 of the following disease/pathologic conditions: cardiovascular disease, cancer, hypertension, diabetes, respiratory symptoms, or abnormal electrocardiogram at rest or exercise.
Marital status assessment was determined by asking, “What is your current marital status?” Participants chose 1 of 4 answers: single, married, divorced, or widowed. Combining marital status at baseline and follow-up resulted in 13 possible categories of marital transitions (Table 1). Because of the small number of cases in some of the categories, the main analyses were performed for 6 of the 13 categories: single-single and single-married, married-married and married-divorced, and divorced-divorced and divorced-remarried.
Table 1.
Marital Status Changes Between Baseline and Follow-up in Study Participants, Dallas, Texas, 1987–2005
| Baseline–Follow-up | All |
Men |
Women |
|||
| No. | % | No. | % | No. | % | |
| Single–singlea | 321 | 3.7 | 220 | 3.2 | 101 | 5.1 |
| Married–marrieda | 7,506 | 85.3 | 5,898 | 86.3 | 1,608 | 81.8 |
| Divorced–divorceda | 285 | 3.2 | 200 | 2.9 | 85 | 4.3 |
| Widowed–widowed | 59 | 0.7 | 19 | 0.3 | 40 | 2.0 |
| Single–marrieda | 171 | 1.9 | 134 | 2.0 | 37 | 1.9 |
| Single–divorced | 9 | 0.1 | 8 | 0.1 | 1 | 0.1 |
| Single–widowed | 1 | 0.0 | 1 | 0 | 0 | 0 |
| Married–divorceda | 202 | 2.3 | 170 | 2.5 | 32 | 1.6 |
| Married–widowed | 37 | 0.4 | 21 | 0.3 | 16 | 0.8 |
| Divorced–remarrieda | 194 | 2.2 | 155 | 2.3 | 39 | 2.0 |
| Divorced–widowed | 0 | 0 | 0 | 0 | 0 | 0 |
| Widowed–remarried | 14 | 0.2 | 8 | 0.1 | 6 | 0.3 |
| Widowed–divorced | 0 | 0 | 0 | 0 | 0 | 0 |
Because of the low frequency in some of the categories, we limited the main analyses to these 6 categories out of the 13 categories theoretically possible.
Statistical analysis
Baseline characteristics of the participants according to marital status categories (single, married, divorced, widowed) were analyzed by 1-way analyses of covariance, with marital status as the fixed factor and age and examination year as covariates.
Bivariate correlations (Pearson's or Spearman's as appropriate) between fitness change and the rest of the study variables were run to identify potential confounders to be included in the main analyses. Partial correlations between fitness change and baseline physical activity, baseline body mass index, physical activity change, and body mass index change, adjusting for age, examination year, follow-up time, and baseline fitness, were calculated.
The effect of marital transition on fitness was analyzed by analysis of covariance, with absolute changes in fitness as the dependent variable and marital status transitions as the fixed factor; variables significantly correlated with changes in fitness were entered in the models as covariates. The analyses were performed separately for 3 transition pairs: single-single versus single-married, married-married versus married-divorced, and divorced-divorced versus divorced-remarried. The paired analyses provide information about how fitness changes when a marital transition take place (e.g., from single to married) compared with a “control” group (i.e., no change in marital status, such as single at baseline and also at follow-up).
All analyses were stratified by sex and performed by using SPSS, version 17.0, software for Windows (SPSS, Inc., Chicago, Illinois). The significance level was 5% for all analyses.
RESULTS
Baseline characteristics of the study sample according to marital status are shown in Table 2. In men, married participants were older, taller, and heavier than their single peers and had higher body mass index and lower fitness (P < 0.001), after adjustment for age (except when age was the outcome variable). Married men consumed less alcohol than divorced men (P = 0.009). Except for smoking (which was less prevalent in married than in single (P < 0.001) and divorced (P = 0.006) women), there were no significant differences in any characteristics other than age for women in the different marital status groups.
Table 2.
Baseline Characteristics of the Study Sample by Gender and Marital Status, Dallas, Texas, 1987–2005a
| Men (N = 6,900) |
Pairwise Comparisonsb |
||||||||||||||
| Single (n = 363) |
Married (n = 6,129) |
Divorced (n = 381) |
Widowed (n = 27) |
P Valuec | S–M | S–D | S–W | M–D | M–W | D–W | |||||
| Age, years | 37.1 (0.4) | 46.0 (0.1) | 46.1 (0.4) | 56.3 (1.6) | <0.001 | < | < | < | NS | < | < | ||||
| Height, cm | 177.9 (0.4) | 179.6 (0.1) | 179.0 (0.3) | 178.4 (1.3) | <0.001 | < | NS | NS | NS | NS | NS | ||||
| Weight, kg | 81.9 (0.7) | 86.6 (0.2) | 85.4 (0.7) | 85.2 (2.5) | <0.001 | < | < | NS | NS | NS | NS | ||||
| Body mass index, kg/m2 | 25.8 (0.2) | 26.8 (0.0) | 26.6 (0.2) | 26.7 (0.7) | <0.001 | < | < | NS | NS | NS | NS | ||||
|
O2max, mL/kg/minute |
43.5 (0.4) | 42.0 (0.1) | 42.3 (0.4) | 42.1 (1.4) | 0.003 | > | NS | NS | NS | NS | NS | ||||
| Physical inactivityde | 74 | 20.4 | 1,396 | 22.8 | 68 | 17.8 | 6 | 22.2 | 0.12 | ||||||
| Current smokere | 64 | 17.6 | 808 | 13.2 | 52 | 13.6 | 3 | 11.1 | 0.11 | ||||||
| Alcoholic consumptionde | 176 | 48.5 | 2,745 | 44.8 | 197 | 51.7 | 14 | 51.9 | 0.03 | NS | NS | NS | < | NS | NS |
| Chronic disease/conditionde | 147 | 40.5 | 2,756 | 45.0 | 174 | 45.7 | 9 | 33.3 | 0.23 | ||||||
| Women (N = 1,971) | Pairwise Comparisonsb | ||||||||||||||
| Single (n = 139) | Married (n = 1,660) | Divorced (n = 126) | Widowed (n = 46) | P Valuec | S–M | S–D | S–W | M–D | M–W | D–W | |||||
| Age, years | 36.2 (0.8) | 46.1 (0.2) | 45.5 (0.8) | 59.6 (1.3) | <0.001 | < | < | < | NS | < | < | ||||
| Height, cm | 165.0 (0.6) | 164.6 (0.2) | 164.3 (0.6) | 164.5 (1.0) | 0.86 | ||||||||||
| Weight, kg | 65.4 (0.9) | 62.9 (0.3) | 62.7 (0.9) | 62.3 (1.6) | 0.07 | ||||||||||
| Body mass index, kg/m2 | 24.1 (0.4) | 23.2 (0.1) | 23.3 (0.4) | 23.0 (0.6) | 0.15 | ||||||||||
|
O2max, mL/kg/minute |
34.2 (0.6) | 35.4 (0.2) | 35.2 (0.6) | 35.2 (1.0) | 0.22 | ||||||||||
| Physical inactivityde | 32 | 23.0 | 338 | 20.4 | 22 | 17.5 | 6 | 13.0 | 0.43 | ||||||
| Current smokere | 21 | 15.1 | 81 | 4.9 | 14 | 11.1 | 1 | 2.2 | <0.001 | > | NS | > | < | NS | NS |
| Alcoholic consumptionde | 50 | 36.0 | 528 | 31.8 | 48 | 38.1 | 13 | 28.3 | 0.35 | ||||||
| Chronic disease/conditionde | 53 | 38.1 | 770 | 46.4 | 64 | 50.8 | 24 | 52.2 | 0.15 | ||||||
Abbreviations: ANCOVA, analysis of covariance; D, divorced; M, married; NS, nonsignificant differences; S, single; W, widowed.
Data are means (standard errors) unless otherwise indicated.
We performed pairwise comparisons (with Bonferroni adjustment) in those cases where significant differences were found. The symbol, <, in the column S–M, for instance, indicates that the mean value for “single” is significantly (P < 0.05) lower than that for “married”; the symbol, >, indicates the opposite.
ANCOVA or chi-squared test as appropriate; for continuous variables (ANCOVA), the means and P values are adjusted for age (except when age is the dependent variable) and examination year.
Physical inactivity was defined as no activity in the 3 months before the examination; alcoholic consumption was considered if 5 or more drinks/week. Chronic disease/condition index was defined as the presence of ≥1 of the following diseases/pathologic conditions: cardiovascular disease, cancer, hypertension, diabetes, respiratory symptoms, or abnormal electrocardiogram at rest or exercise.
Data are number and percent.
After adjustment for age, examination year, follow-up time, and baseline fitness levels, changes in physical activity were positively correlated with changes in fitness in men and women (from P < 0.05 to P < 0.001) (Table 3). Baseline and changes in body mass index, as well as changes in chronic disease/condition index, were negatively correlated with changes in fitness in both men and women (from P < 0.05 to P < 0.001).
Table 3.
Correlates of Changes in Fitness (O2max at Follow-up Minus Baseline), Dallas, Texas, 1987–2005
| Men |
Women |
|||
| r | P Value | r | P Value | |
| Pearson's correlation | ||||
| Follow-up time, years | −0.361 | <0.001 | −0.255 | <0.001 |
| Age, years | −0.003 | 0.827 | −0.055 | 0.014 |
| Baseline O2max, mL/kg/minute |
−0.368 | <0.001 | −0.377 | <0.001 |
| Baseline body mass index, kg/m2 | 0.140 | <0.001 | 0.088 | <0.001 |
| Body mass index change, kg/m2 | −0.249 | <0.001 | −0.208 | <0.001 |
| Spearman's correlation | ||||
| Examination year | 0.179 | <0.001 | 0.096 | <0.001 |
| Baseline physical activitya | −0.134 | <0.001 | −0.113 | <0.001 |
| Physical activity change | 0.174 | <0.001 | 0.145 | <0.001 |
| Baseline smokingb | −0.030 | 0.014 | −0.067 | 0.003 |
| Smoking change | 0.048 | <0.001 | 0.062 | 0.006 |
| Baseline no. of alcoholic drinks/week | −0.009 | 0.472 | −0.016 | 0.471 |
| No. of alcoholic drinks/week change | −0.029 | 0.016 | −0.009 | 0.689 |
| Baseline chronic disease indexc | 0.045 | <0.001 | 0.057 | 0.012 |
| Chronic disease index change | −0.130 | <0.001 | −0.120 | <0.001 |
| Partial correlation, adjusted for age, examination year, follow-up time, and baseline O2max
|
||||
| Baseline physical activitya | 0.013 | 0.282 | 0.053 | 0.020 |
| Physical activity change | 0.162 | <0.001 | 0.122 | <0.001 |
| Baseline body mass index, kg/m2 | −0.103 | <0.001 | −0.106 | <0.001 |
| Body mass index change, kg/m2 | −0.215 | <0.001 | −0.186 | <0.001 |
| Baseline smokingb | −0.057 | <0.001 | −0.034 | 0.137 |
| Smoking change | −0.003 | 0.794 | −0.015 | 0.500 |
| Baseline no. of alcoholic drinks/week | 0.015 | 0.199 | 0.030 | 0.183 |
| No. of alcoholic drinks/week change | −0.014 | 0.248 | 0.007 | 0.755 |
| Baseline chronic disease indexc | −0.019 | 0.116 | 0.000 | 0.988 |
| Chronic disease index change | –0.072 | <0.001 | −0.053 | 0.019 |
Abbreviation: O2max, maximal oxygen consumption.
Physical activity level was coded as 0 = no activity in the 3 months before the baseline examination; 1 = moderate activity (participated in sport or leisure-time physical activity other than “walking, jogging, or running” or “walk, jog, or run” up to 10 miles/week); and 2 = high activity (walk, jog, or run >10 miles/week) (10 miles = 16.09 km).
Smoking was coded as 0 = nonsmoker, 1 = former smoker, and 2 = current smoker.
The chronic disease/condition index (ranging from 0 to 6) is expressed as the number of the following disease/pathologic conditions the person has: cardiovascular disease, cancer, hypertension, diabetes, respiratory symptoms, or abnormal electrocardiogram at rest or exercise.
Does fitness change over time in people who change their marital status from single to married?
Changes in fitness according to marital status transitions in men and women are shown in Figure 2. After adjustment for age, examination year, follow-up time, and baseline levels of fitness, physical activity, and body mass index, there was a decline in fitness in men who remained single (mean change, −1.1 mL/kg/minute) and a steeper decline in men who married (mean change, −1.5 mL/kg/minute). The rate of decline did not differ significantly between these 2 marital transition groups (P = 0.56). However, after adjustment for changes in body mass index and physical activity, fitness did not change in men who remained single (mean change, −0.5 mL/kg/minute), but there was a reduction in fitness in those who married (mean change, −1.4 mL/kg/minute; for the between-group difference in rate of change, P = 0.16) (Figure 2, top). Further adjustment for smoking and chronic conditions did not substantially affect the results.
Figure 2.
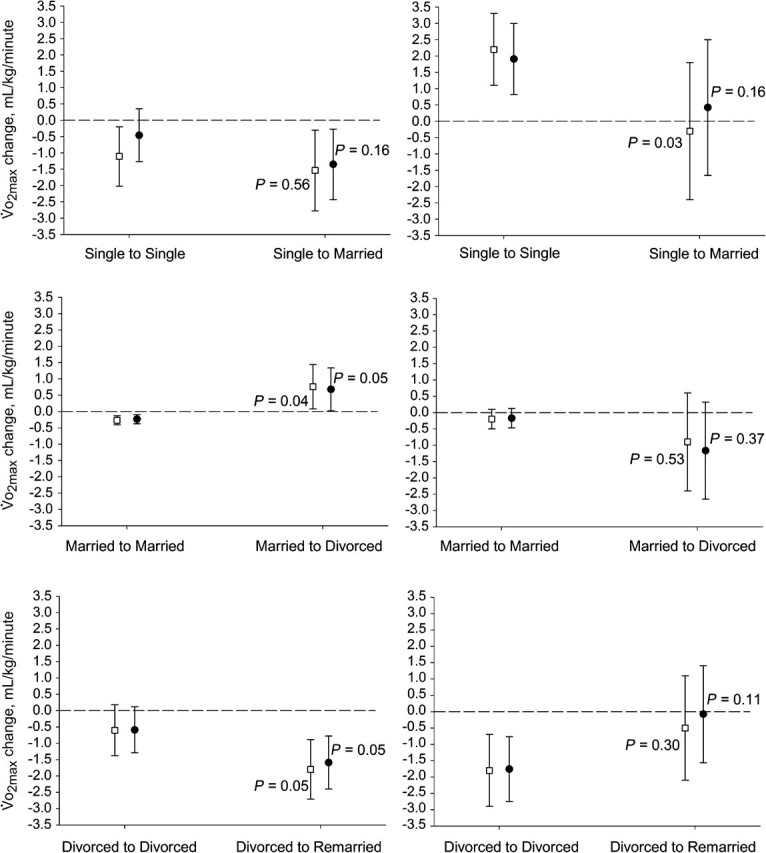
Changes in fitness (follow-up minus baseline) according to marital status transitions in men (left) and women (right) after adjustment for confounders, Dallas, Texas, 1987–2005. The P values represent intergroup differences in the mean changes observed (e.g., participants getting married vs. those remaining single). The dashed line represents the “no change” line (value 0). The white squares represent mean change (and 95% confidence intervals) after adjustment for age, examination year, follow-up and baseline O2max, physical activity, and body mass index. The black circles represent mean change after adjustment for age, examination year, follow-up and baseline O2max, and changes in physical activity and body mass index. O2max, maximal oxygen consumption.
In contrast, among the women, fitness increased in those who remained single (mean change, 2.2 mL/kg/minute), while no change was observed in those who married (mean change, −0.3 mL/kg/minute). The mean change differed significantly between these 2 marital transition groups (P = 0.03). After adjustment for changes in physical activity and body mass index, this difference was attenuated (mean change, 1.9 and 0.4 mL/kg/minute, respectively; for the between-group difference in rate of change, P = 0.16) (Figure 2, top). Adjustment for smoking and chronic conditions did not substantially affect the results. Further exploratory analyses showed that the change in body mass index, rather than the change in physical activity, was responsible for the mediating effect observed in both men and women.
Does fitness change over time in people who change their marital status from married to divorced?
The fitness level did not change over time in married men who remained married (mean change, −0.3 mL/kg/minute), but there was a significant increase in those who divorced (mean change, 0.7 mL/kg/minute). The mean changes differed significantly for these 2 marital transition groups (P = 0.04) (Figure 2, middle). Women who remained married also showed no change in fitness (mean change, −0.2 mL/kg/minute); there was, however, a tendency toward a decrease in fitness in those who divorced (mean change, −0.9 mL/kg/minute), but the changes in fitness in these 2 transition groups were not significantly different (P = 0.53). These results did not substantially change after adjusting for changes in physical activity and body mass index (Figure 2, middle), nor after adjustment for baseline smoking and changes in chronic disease/condition index.
Does fitness change over time in people who change their marital status from divorced to remarried?
In divorced men, the fitness level tended to decrease over time; this decrease was more marked in those who remarried (mean change, −1.8 mL/kg/minute) than in those who remained divorced (mean change, −0.6 mL/kg/minute). The change in fitness was significantly different for these 2 groups (P = 0.05) (Figure 2, bottom). Fitness also decreased in divorced women who remained single (mean change, −1.8 mL/kg/minute) but not in those who remarried (mean change, −0.5 mL/kg/minute). The difference between these 2 groups was not statistically significant (P = 0.30). Adjustments for changes in physical activity and body mass index did not alter these results (Figure 2, bottom), nor after adjustment for baseline smoking and changes in chronic disease/condition index.
DISCUSSION
To our knowledge, this is the first study to comprehensively explore the prospective associations between marital transitions and changes in fitness in men and women. Our findings suggest that marital status may affect fitness differently for men and women. For example, there was a decline in fitness in men who remained single. There was also a trend toward a larger decline in those who married. In contrast, among women, remaining single was associated with an increase in fitness, which was not seen in those who married. Both of these results are in line with our hypothesis that getting married has a negative effect on fitness. In men, this hypothesis was further supported by the finding that divorced men who remarried showed a decline in fitness relative to those who did not remarry. Moreover, in married men who divorced, there was a small increase in fitness (compared with men who remained married), adding further support to our hypothesis. The low numbers of women in the transition groups probably explain the large variability and lack of clear patterns in fitness change score results for the married and divorced women. It is important to highlight that the strength of the associations was modest, indicating that other factors, in addition to marital status, explain the observed changes in fitness levels.
Because of the lack of studies examining the association between marital status and change in fitness, we cannot compare our results with previous research. However, a number of studies have explored the relation between marriage and physical activity, with mixed findings (21). Although most studies have reported that people getting married become less active (8, 9), others have found opposite results (22). Our results do mirror the findings for women in the Australian Longitudinal Study of Women's Health, which show that physical activity levels fall in women who marry and in those who have a baby (9). These decreases in physical activity are likely to be reflected in decreases in fitness. However, although we adjusted our analyses for physical activity, it is likely that our physical activity measure was not sufficiently sensitive to detect small changes in activity and to accurately examine whether changes in fitness could have been due to changes in physical activity.
Our results may also be explained by changes in weight that occur with change in marital status, as Australian data show that women who marry gain weight at a higher rate than those who do not, after adjustment for a wide range of potential confounders (23). Likewise, marriage is associated with an increased risk for overweight/obesity (4) and increases in body mass index (3), while divorce is linked to decreases in body mass index (24). The attenuation of the difference in fitness change scores after adjustment for change in body mass index in the single-married transition analysis for women provides some indication that changes in body mass index were implicated in the fitness change scores.
Because of the observational design of the present study and the concurrent measures of change in marital status and fitness, the direction of the associations shown here cannot be confirmed. Nevertheless, it is feasible that marital transitions, which are accompanied by significant lifestyle changes (10), may impact fitness. In addition, current research supports the notions that physical fitness is positively correlated with body attractiveness (rated by women) and mating success in men (25) and that women rate muscular men as sexier (26). Consequently, fitter men may be more successful in the “marriage market” than their unfit peers. According to this theory, single men have the social pressure of keeping themselves fit to increase their attractiveness and find a partner, while married men do not any longer have that “requirement” or at least they have it at a lower extent. If the “marriage market” hypothesis (which suggests that married individuals, who are no longer concerned about attracting a mate, may allow their fitness level to decrease) is true, we should see a negative effect on fitness when getting married, which is in fact the main finding of this study.
Of note is that our results showed that marital transitions influence fitness in men but not so clearly in women. Although the low number of women in some of the transition categories may have influenced the results, it is also possible that the association between marital status and fitness is present only in men. The cross-sectional analyses performed in this study confirm the longitudinal analyses, suggesting that fitness differed across marital status groups at baseline in men, but no differences were observed in women. Returning to attractiveness and the “marriage market” hypothesis discussed above, it has been reported that women's attractiveness might not be related to fitness or strength/muscularity (as it is the case in men) but to other traits, such as a narrow waist/hip ratio (27). This may at least partially explain the sex differences observed in our study.
The current study has limitations. First, a smaller number of women than men participated in the study; thus, the findings observed in men may have more strength than those observed in women. Of note is that, for some marital transitions, for example, from married to divorced and from divorced to remarried, the pattern of the association clearly differed between women and men. Caution should be taken when interpreting these differences, because of the small sample size and the large heterogeneity observed in these transition groups in women. Second, most of the ACLS participants were married at baseline (>85%). According to the US Census in 2000, 52% of the US adults were married and living with their spouse. Therefore, being married is overrepresented in this cohort. Nevertheless, for marital transitions that occurred during the ∼3 years’ follow up, the sample sizes were similar across categories. Third, the lack of information about having/not having children is another limitation of the present study. Because many couples now delay getting married until they want to have children and because having children places notable constraints on the time available for structured exercise (28), the presence of children may partially explain the decline in fitness seen in the transition from being single to being married (23). Future studies should address this issue in relation to fitness. Fourth, other categories of marital status, such as “separated” or “de facto,” were not included in the questionnaire used in this study, which could be a source of error. Nevertheless, we think that those living in a “de facto” relationship may have identified as “married” and that those living alone as “single.” We cannot confirm this, and we do not know if lifestyle factors and fitness are different in married and de facto couples or in single and separated individuals. Finally, we did not have sufficient information on physical activity frequency and intensity. Therefore, we could not account for exercise volume in this study. Future studies should include such information whenever possible.
The relatively large number of participants with measurements for all the study exposures, outcomes, and confounders at 2 time points, particularly men, as well as the well-standardized and objective measure of fitness, is a notable strength of this study.
In conclusion, the current findings, based on data from nearly 9,000 people from the ACLS followed up for a median period of ∼3 years, suggest that transitions to being married (i.e., from single to married or from divorced to remarried) are associated with a modest reduction, while divorce is associated with a modest increase, in fitness levels in men. The results suggest that these patterns may be different in women, but further research is required to confirm this.
Acknowledgments
Author affiliations: Unit for Preventive Nutrition, Department of Biosciences and Nutrition at NOVUM, Karolinska Institutet, Huddinge, Sweden (Francisco B. Ortega); Department of Medical Physiology, School of Medicine, University of Granada, Spain (Francisco B. Ortega); School of Human Movement Studies, University of Queensland, St. Lucia, Queensland, Australia (Wendy Brown); Department of Exercise Science, University of South Carolina, Columbia, South Carolina (Duck-chul Lee, Meghan Baruth, Xuemei Sui, Steven N. Blair); and Department of Epidemiology and Biostatistics, University of South Carolina, Columbia, South Carolina (Steven N. Blair).
This study was supported by National Institutes of Health grants AG06945, HL62508, and R21DK088195 and in part by an unrestricted research grant from the Coca-Cola Company. Support for this publication is also provided by the Robert Wood Johnson Foundation's Pioneer Portfolio, which supports innovative ideas thay may lead to break throughs in the future of health and health care. The Pioneer Portfolio funding was administered through a Positive Health grant to the Positive Psychology Center of the University of Pennsylvania, Martin Seligman, director. The study also was supported in part by the Spanish Ministry of Education (EX-2008-0641) and the Swedish Heart-Lung Foundation (20090635).
The authors thank the Cooper Clinic physicians and technicians for collecting the baseline data and the staff at the Cooper Institute for data entry and data management.
The content is solely the responsibility of the authors and does not necessarily represent the official views of the National Institutes of Health.
Conflict of interest: none declared.
Glossary
Abbreviations
- ACLS
Aerobics Center Longitudinal Study
-
O2max
maximal oxygen consumption
References
- 1.Jackson AS, Sui X, Hébert JR, et al. Role of lifestyle and aging on the longitudinal change in cardiorespiratory fitness. Arch Intern Med. 2009;169(19):1781–1787. doi: 10.1001/archinternmed.2009.312. [DOI] [PMC free article] [PubMed] [Google Scholar]
- 2.Kodama S, Saito K, Tanaka S, et al. Cardiorespiratory fitness as a quantitative predictor of all-cause mortality and cardiovascular events in healthy men and women: a meta-analysis. JAMA. 2009;301(19):2024–2035. doi: 10.1001/jama.2009.681. [DOI] [PubMed] [Google Scholar]
- 3.Averett SL, Sikora A, Argys LM. For better or worse: relationship status and body mass index. Econ Hum Biol. 2008;6(3):330–349. doi: 10.1016/j.ehb.2008.07.003. [DOI] [PubMed] [Google Scholar]
- 4.The NS, Gordon-Larsen P. Entry into romantic partnership is associated with obesity. Obesity (Silver Spring) 2009;17(7):1441–1447. doi: 10.1038/oby.2009.97. [DOI] [PMC free article] [PubMed] [Google Scholar]
- 5.Resnick B. A prediction model of aerobic exercise in older adults living in a continuing-care retirement community. J Aging Health. 2001;13(2):287–310. doi: 10.1177/089826430101300207. [DOI] [PubMed] [Google Scholar]
- 6.Håkansson K, Rovio S, Helkala EL, et al. Association between mid-life marital status and cognitive function in later life: population based cohort study [electronic article] BMJ. 2009;339:b2462. doi: 10.1136/bmj.b2462. [DOI] [PMC free article] [PubMed] [Google Scholar]
- 7.Manzoli L, Villari P, Pirone GM, et al. Marital status and mortality in the elderly: a systematic review and meta-analysis. Soc Sci Med. 2007;64(1):77–94. doi: 10.1016/j.socscimed.2006.08.031. [DOI] [PubMed] [Google Scholar]
- 8.Barnekow-Bergkvist M, Hedberg G, Janlert U, et al. Physical activity pattern in men and women at the ages of 16 and 34 and development of physical activity from adolescence to adulthood. Scand J Med Sci Sports. 1996;6(6):359–370. doi: 10.1111/j.1600-0838.1996.tb00108.x. [DOI] [PubMed] [Google Scholar]
- 9.Brown WJ, Heesch KC, Miller YD. Life events and changing physical activity patterns in women at different life stages. Ann Behav Med. 2009;37(3):294–305. doi: 10.1007/s12160-009-9099-2. [DOI] [PubMed] [Google Scholar]
- 10.Devine CM. A life course perspective: understanding food choices in time, social location, and history. J Nutr Educ Behav. 2005;37(3):121–128. doi: 10.1016/s1499-4046(06)60266-2. [DOI] [PubMed] [Google Scholar]
- 11.Blair SN, Goodyear NN, Gibbons LW, et al. Physical fitness and incidence of hypertension in healthy normotensive men and women. JAMA. 1984;252(4):487–490. [PubMed] [Google Scholar]
- 12.Blair SN, Kampert JB, Kohl HW, III, et al. Influences of cardiorespiratory fitness and other precursors on cardiovascular disease and all-cause mortality in men and women. JAMA. 1996;276(3):205–210. [PubMed] [Google Scholar]
- 13.Blair SN, Kohl HW, III, Paffenbarger RS, Jr, et al. Physical fitness and all-cause mortality. A prospective study of healthy men and women. JAMA. 1989;262(17):2395–2401. doi: 10.1001/jama.262.17.2395. [DOI] [PubMed] [Google Scholar]
- 14.Sui X, LaMonte MJ, Laditka JN, et al. Cardiorespiratory fitness and adiposity as mortality predictors in older adults. JAMA. 2007;298(21):2507–2516. doi: 10.1001/jama.298.21.2507. [DOI] [PMC free article] [PubMed] [Google Scholar]
- 15.Hooker SP, Sui X, Colabianchi N, et al. Cardiorespiratory fitness as a predictor of fatal and nonfatal stroke in asymptomatic women and men. Stroke. 2008;39(11):2950–2957. doi: 10.1161/STROKEAHA.107.495275. [DOI] [PubMed] [Google Scholar]
- 16.Cheng YJ, Macera CA, Addy CL, et al. Effects of physical activity on exercise tests and respiratory function. Br J Sports Med. 2003;37(6):521–528. doi: 10.1136/bjsm.37.6.521. [DOI] [PMC free article] [PubMed] [Google Scholar]
- 17.Balke B, Ware RW. An experimental study of physical fitness of Air Force personnel. U S Armed Forces Med J. 1959;10(6):675–688. [PubMed] [Google Scholar]
- 18.Pollock ML, Bohannon RL, Cooper KH, et al. A comparative analysis of four protocols for maximal treadmill stress testing. Am Heart J. 1976;92(1):39–46. doi: 10.1016/s0002-8703(76)80401-2. [DOI] [PubMed] [Google Scholar]
- 19.Pollock ML, Foster C, Schmidt D, et al. Comparative analysis of physiologic responses to three different maximal graded exercise test protocols in healthy women. Am Heart J. 1982;103(3):363–373. doi: 10.1016/0002-8703(82)90275-7. [DOI] [PubMed] [Google Scholar]
- 20.American College of Sports Medicine. ACSM's Guidelines for Exercise Testing and Prescription. Philadelphia, PA: Lippincott Williams and Wilkins; 2009. [Google Scholar]
- 21.Trost SG, Owen N, Bauman AE, et al. Correlates of adults’ participation in physical activity: review and update. Med Sci Sports Exerc. 2002;34(12):1996–2001. doi: 10.1097/00005768-200212000-00020. [DOI] [PubMed] [Google Scholar]
- 22.King AC, Kiernan M, Ahn DK, et al. The effects of marital transitions on changes in physical activity: results from a 10-year community study. Ann Behav Med. 1998;20(2):64–69. doi: 10.1007/BF02884450. [DOI] [PubMed] [Google Scholar]
- 23.Brown WJ, Hockey R, Dobson AJ. Effects of having a baby on weight gain. Am J Prev Med. 2010;38(2):163–170. doi: 10.1016/j.amepre.2009.09.044. [DOI] [PubMed] [Google Scholar]
- 24.Jeffery RW, Rick AM. Cross-sectional and longitudinal associations between body mass index and marriage-related factors. Obes Res. 2002;10(8):809–815. doi: 10.1038/oby.2002.109. [DOI] [PubMed] [Google Scholar]
- 25.Hönekopp J, Rudolph U, Beier L, et al. Physical attractiveness of face and body as indicators of physical fitness in men. Evol Hum Behav. 2007;28:106–111. [Google Scholar]
- 26.Frederick DA, Haselton MG. Why is muscularity sexy? Tests of the fitness indicator hypothesis. Pers Soc Psychol Bull. 2007;33(8):1167–1183. doi: 10.1177/0146167207303022. [DOI] [PubMed] [Google Scholar]
- 27.Singh D. Adaptive significance of female physical attractiveness: role of waist-to-hip ratio. J Pers Soc Psychol. 1993;65(2):293–307. doi: 10.1037//0022-3514.65.2.293. [DOI] [PubMed] [Google Scholar]
- 28.Brown PR, Brown WJ, Miller YD, et al. Perceived constraints and social support for active leisure among mothers with young children. Leis Sci. 2001;23(3):131–144. [Google Scholar]