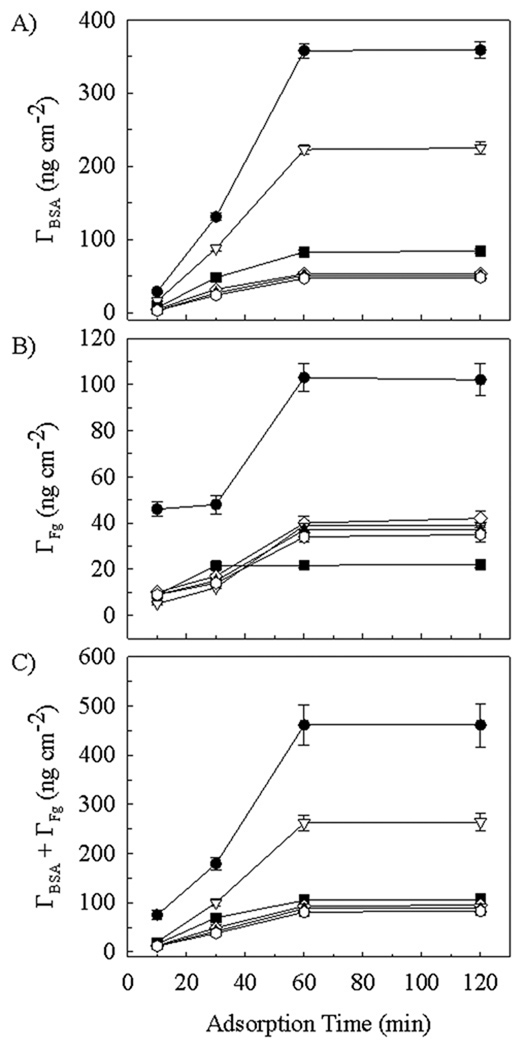
Figure 7.
Protein surface density Γ on (●) bare silicon, (▽) 4 h dextranized silicon, (■) 0.5 h dextranized silicon, (◊) human hyaluronized (1.2 mg ml−1), (▲) rooster hyaluronized (1.2 mg ml−1) and ( ) zoo hyaluronized (1.2 mg ml−1) silicon surfaces. Adsorption was from 50/50 mixtures of BSA and Fg at 20 µg ml−1 each. Panels are: (A) BSA surface concentration; (B) Fg surface concentration and (C) Total protein surface concentration.

