

Abstract
Purpose
Clinical benign prostatic hyperplasia (BPH) is primarily diagnosed based on a diverse array of progressive lower urinary tract symptoms (LUTS) and is likely distinct from histological BPH, which is detected by the presence of non-malignant proliferation of prostate cells but may or may not be associated with symptoms. Pharmacological management of LUTS has emerged as an effective initial treatment for clinical BPH due to the introduction of new drug therapies shown to be effective in recent large clinical trials. Despite advances in symptom management and research into BPH pathology, diagnostic strategies for prediction of BPH progression and response to drug modalities are lacking and questions remain as to the molecular differences underlying clinical (symptomatic) versus histological (non-symptomatic) BPH.
Materials and Methods
As part of the Medical Therapy of Prostatic Symptoms (MTOPS) clinical trial, which demonstrated the effectiveness of combination drug therapy in slowing BPH progression, an archive of biological specimens linked to clinical data were collected for future profiling of disease pathology and changes associated with response to drug therapy. The MTOPS Prostatic Samples Analysis (MPSA) Consortium was established to identify and validate molecular markers that may better define BPH-related pathologies, identify risk for progression of LUTS, and predict response to drug therapy, using this MTOPS archive. The cooperating MPSA Biomarker Discovery Sites and Pathology Coordinating Center employ diverse methodologies and scientific approaches and unique expertise in addressing the goals of the consortium.
Results
To date the MPSA has identified a number of promising biomarkers and other molecular and cellular changes associated with BPH.
Conclusions
These findings and ongoing consortium discovery efforts have the potential to provide a greater understanding of the defects underlying disease pathology and may lead to the development of early and more effective pharmacological treatment strategies for BPH.
Introduction
Benign prostatic hyperplasia (BPH) is one of the most common diseases occurring in ageing men in the United States. Pathologically diagnosed BPH is characterized by the non-malignant proliferation of the epithelial and stromal components of the prostate. Such histological BPH may or may not be associated with clinical BPH, which is defined by the progressive development of lower urinary tract symptoms (LUTS). LUTS primarily result from constriction of the urethra and resulting resistance to urinary flow and may take the form of urgency, frequency, nocturia, and a weak urine stream with incomplete emptying. If left untreated LUTS can result in acute urinary retention, urinary incontinence, recurrent urinary tract infections, and/or obstructive uropathy.1 Interestingly, some men with significantly enlarged prostates do not present with LUTS, while some men with normally sized prostates experience severe LUTS.
BPH is a chronic condition that increases in its prevalence and severity with age. The presence of histological BPH is estimated to be 8%, 50%, 70% and 90% for men in their fourth, sixth, seventh, and eight (and older) decade of life, respectively, while the presence of moderate to severe LUTS (i.e. clinical BPH) is estimated to be 26%, 33%, 41%, and nearly 50% for the same respective age groups.2 The extremely high prevalence of BPH and its associated symptoms, which can lead to severe impact in the quality of life, make it one of the nation’s major health care expenses. In 2000 the direct costs of medical services to treat BPH was estimated as $1.1 billion, excluding outpatient pharmaceutical treatment.3 Inclusion of prescription and non-prescription medication costs and indirect costs associated with morbidity (e.g. work limitations) increases this estimate significantly (Wei, et al, 2005).
Medical treatment for clinical BPH has evolved over the last decade, with a growing focus on pharmacological management of LUTS over more invasive therapies. A steady decline in surgical treatments for clinical BPH has been reported since the 1990s and was concomitant with an increase in non-surgical interventions designed to manage symptoms.4, 5 This is likely due, in part, to the ncreased use of two largely effective drugs in the treatment of LUTS, 5-α-reductase inhibitors, which in effect shrink the prostate by inducing prostatic epithelial apoptosis and atrophy, and α1-adrenergic receptor agonists, which reduce prostatic and urethral smooth muscle tone.4 A number of short duration clinical trials have compared the relative effectiveness of these drug modalities individually and in combination. In these trials 5-α-reductase inhibitors and α1 -adrenergic receptor antagonists proved effective in treating clinical BPH symptoms, but in combination showed no increased effect in alleviating symptoms or improving flow rate.5
To further investigate the efficacy of individual and combination drug therapy for medical management of clinical BPH, the National Institute of Diabetes and Digestive and Kidney Diseases (NIDDK) conducted a long-term, randomized trial known as the Medical Therapy of Prostatic Symptoms (MTOPS) Study. The MTOPS trial investigated whether finasteride, a 5-α-reductase inhibitor, and doxazosin, a α1-adrenergic receptor agonist, alone or in combination, would specifically delay or prevent clinical progression of BPH. Results demonstrated that dual drug therapy significantly reduced the risk of overall BPH clinical progression more than either drug monotherapy alone or placebo with a mean follow-up of 4.5 years.6 Importantly, as a component of the study protocol, serum samples were collected from MTOPS patients prior to randomization and at yearly intervals during the trial and at end-of-study. Prostate biopsy samples were also collected at baseline, year 1, and end-of-study from a patient subgroup. These biosamples were collected and banked in anticipation of analyses of potential molecular changes associated with patient responses to the MTOPS clinical protocol.
In 2002, the MTOPS Prostatic Samples Analysis (MPSA) Consortium was established by the NIDDK, in cooperation with the National Institute on Aging (NIA), as a BPH biomarker discovery follow-up study to the MTOPS clinical trial. The MPSA Consortium consists of seven research groups from six academic institutions. Five institutions, Harvard Medical School/Brigham and Women’s Hospital (representing two groups), Vanderbilt University Medical Center, Baylor College of Medicine, the University of Texas Southwestern Medical Center, and the Johns Hopkins University School of Medicine, act as Biomarker Discovery Centers. The University of Colorado School of Medicine acts as the Pathology Coordinating Center (PCC). Scientists from the NIDDK, the NIA, and the MTOPS Data Coordinating Center (DCC) are also involved in determining scientific direction and in overall administration. Each of the participating academic Discovery Centers contains integrated basic science and clinical expertise, including urologists, protein chemists, pathologists, molecular biologists, statisticians, and clinical chemists (for a complete listing of contributing institutions/organizations and personnel see Appendix I).
The ongoing efforts of the MPSA Consortium in identification of biomarkers for BPH that have the potential to differentiate BPH-related pathologies, which are now defined mostly through a set of symptom-driven criteria; to identify risk for progressive disease; and to direct earlier and more individualized, effective, and economical medical strategies for dealing with BPH-related LUTS. In addition, these biomarker discovery efforts may lead to new insights into the molecular etiology of histological BPH and the clinical manifestations of BPH, which remain unclear despite continued study. The MPSA Consortium is also unique in that it represents the first cooperative group of its kind dedicated to the discovery and characterization of biomarkers of clinical relevance to BPH and has as a major resource the highly important MTOPS biosample collection that is linked to a variety of clinical parameters, including response to multiple drug therapies.
Goals and Scientific Strategy
The MPSA Consortium utilizes a standard biomarker definition, namely “a biological characteristic that is measured and evaluated objectively as an indicator of normal biological processes, pathogenic processes, or a response to medical intervention” 7,8, to guide the discovery efforts. As an initial step in these efforts, the MPSA Consortium worked to establish a prioritized list of the most important clinical questions that could be addressed through the identification and characterization of molecular markers from the MTOPS clinical samples. It was decided that the primary clinical question driving biomarker identification and characterization would be whether at the time of initial therapy, the future risk of BPH clinical progress, as defined by the MTOPS group, justifies the addition of 5α-reductase inhibitor to the usual baseline α1-blocker monotherapy. This clinical outcome was also a primary question in the MTOPS clinical trial.6 Identification of biomarkers that can answer this question for a given patient is of significant relevance to the clinical management of BPH in that it would lead to more effective treatment choices by clinicians (i.e. should dual drug therapy or mono drug therapy be the initial choice for treatment) for halting or reversing the progression of symptoms earlier than present strategies and, thus, may reduce the risk of more serious eventual complications. Identification of biomarkers associated with this BPH outcome would, therefore, facilitate the initial categorization of patients likely to benefit from monotherapy or dual therapy. Secondary outcome measures of clinical importance were also identified, including symptom or flow rate improvement (or failure to improve); prostate growth; and BPH progression (or risk reduction in therapy) defined as symptom progression, acute urinary retention or the need for invasive therapy. In addition, it is hoped that the studies of the MPSA Consortium may reveal novel information on the etiology of BPH and the progression of disease symptoms. These clinical questions are deemed key to understanding BPH progression and improving treatment and have served to guide the biomarker discovery efforts of the consortium.
Cooperative resource development is another goal of the MPSA Consortium. One important common resource developed for the group is a series of tissue microarrays containing tissue derived from normal prostate, BPH, and prostate cancer. These arrays provide respective sites an opportunity to examine large numbers of well characterized tissue samples in a high throughput fashion enabling a more rapid biomarker discovery process and a comparison between benign and malignant prostate disease. In addition, to guide and standardize the discovery efforts of the group, the MPSA Consortium developed a common scientific strategy, though each site is free to utilize a range of discovery platforms (e.g. genomic and proteomic approaches, histology, biophysical approaches, etc). This strategy utilizes a three phase approach to reflect the stage of development and/or validation for a given biomarker and sets benchmarks for progress and progression (Figure 1). Phase I represents the identification of promising candidates at an individual site using local samples, such as banked prostate tissue, RNA, and serum. Candidates showing promise are then moved to Phase II testing, which involves validation of candidates using larger local sample sets and common resources (e.g. tissue arrays developed at one site and shared with other groups). Candidates that continue to show promise and relevance for our clinical questions of interest are then eligible for Phase III, which involves further analysis using appropriate sets of banked MTOPS clinical samples. This final stage allows a direct assessment of a promising biomarker’s utility in addressing our prioritized clinical questions using the well-characterized and unique MTOPS samples. The focus to date has primarily been on serum markers, as opposed to tissue markers, due to their potential utility in development of diagnostic tools in clinical practice.
Figure 1. MPSA Strategy for BPH Biomarker Discovery and Validation.
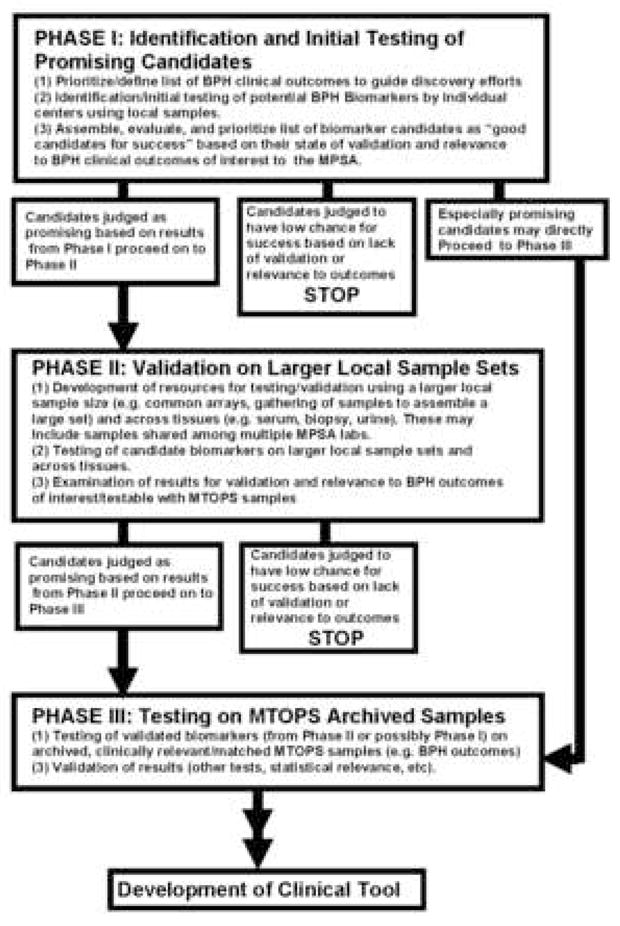
The MPSA Consortium’s three phase approach for development and/or validation for a given biomarker with associated benchmarks for progress and progression is depicted. Phase I represents the identification of promising candidates using local samples. Promising candidates are then moved to Phase II testing, which involves validation of candidates using larger local sample sets and common resources. Phase I markers may be moved directly into Phase III if they are exceptionally promising. Candidates validated in Phase II and that continue to show relevance for the group’s prioritized clinical questions are moved into Phase III testing, which involves analysis using banked MTOPS clinical samples. Putative biomarkers validated in Phase III would be candidates for future studies involving the development of tools for application in clinical and diagnostic settings.
Through an independent External Advisory Committee (EAC), each of the markers examined and the operation of the group as a whole are evaluated regularly through telephone conferences and face-to-face meetings to assess scientific progress and how the collaborative work of the consortium might be facilitated (Figure 1). In addition, the EAC, with the consortium investigators, NIH scientists, and representatives from the former MTOPS clinical group, established early, stringent criteria for use of the highly valuable MTOPS samples ensuring that only biomarkers that had been sufficiently validated in Phase I and Phase II (or in rare cases only through Phase I testing) are permitted to be tested in a Phase III analysis. In this way the valuable MTOPS biosamples are utilized only for the most appropriate experiments with a high expectation of success.
As stated above, each of the MPSA Consortium sites utilizes their own scientific methodologies and brings to bear their unique expertise in addressing the collaborative biomarker discovery efforts of the group. Some of the various approaches taken by MPSA sites and how these relate to the central goals of the MPSA Consortium in BPH biomarker identification and validation are outlined in the following section.
Biomarker Discovery Approaches
Reverse-Capture Autoantibody Platform for Identification of BPH Markers
A potential strategy to identify biologically relevant markers for BPH progression is to examine the immune system, including the generation of autoantibodies. Although the use of autoantibody profiling in BPH has not been reported, observations have shown that the majority of BPH tissues demonstrate significantly increased T-lymphocyte infiltration. 9,10,11 In addition, Mahapokai et al 12 have reported that in a hormonally-induced BPH canine model, hyperplasia was followed by cell-mediated and humoral immune responses. Finally, using expression microarrays and prostate tissues from symptomatic and asymptomatic BPH samples, Prakash et al 13 demonstrated that there is strong correlation between inflammation and symptomatic BPH. Therefore, it is possible that BPH may elicit a host immune response and that autoantibody profiling might serve as a marker for identifying BPH patients who are at risk for disease progression.
In order to identify potential antigen-autoantibody reactivity in patients with BPH, a “reverse capture” autoantibody microarray platform was developed by the Brigham and Women’s MPSA Discovery Site. 14,15 This platform allows biologically relevant antigens to be immobilized in their native configuration. The “reverse capture” autoantibody microarray platform is based on the dual-antibody sandwich immunoassay of ELISA (Figure 2). The novelty of the “reverse capture” autoantibody microarray is the use of human cell lysates as the native protein source for the detection of antigen-specific humoral immunity and the use of a high density well-characterized monoclonal antibody microarray platform to immobilize the corresponding native antigens, which then serve as “baits” for differentially labeled autoantibodies (Figure 2).14,15 By using human cells as a source of protein, the need for recombinant proteins is bypassed and, therefore, the detection of immunogenic epitopes that are not present in recombinant proteins is facilitated.14,15 Therefore, this platform has the virtue of including post-translational modifications occurring in a cell type or tissue thought to be relevant to the disease, preserving and making available for antibody binding the tertiary and quaternary structures of proteins and complexes, multiplexing for simultaneous and rapid measurement of independent reactivities, and facilitating protein-protein interaction mapping with native biological samples.
Figure 2. The “Reverse Capture” Autoantibody Microarray Platform.
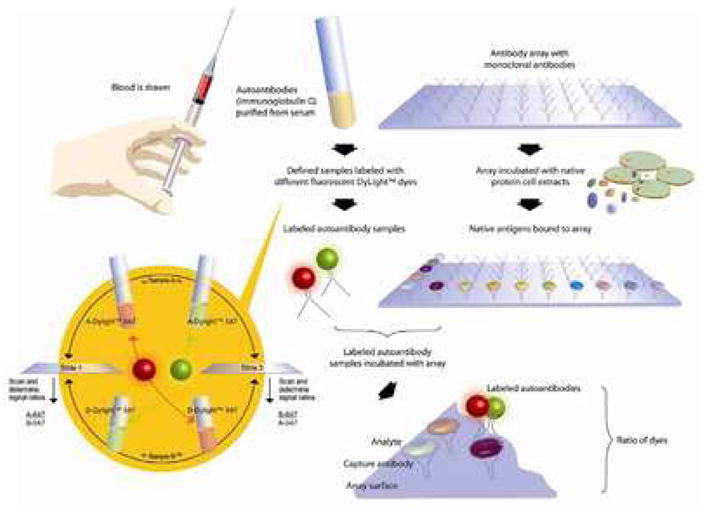
Based on the ELISA dual-antibody sandwich immunoassay, an antibody microarray is used to immobilize native antigens corresponding to 500 pairs of unique, well-characterized monoclonal antibodies. Disease-related autoantibody reactivity to target antigens is then determined by scanning the microarray slides on which differentially labeled test and control IgG samples are competitively hybridized. The two-slide dye-swap method employed with every “reverse capture” autoantibody microarray experiment is also illustrated. The dye-swap allows for normalization of fluorescence and background intensity readings, as well as differences in labeling and antibody binding efficiency between the dyes. (Reproduced with permission from Proteomics Clin. Appl., epub ahead of print, April 19, 2007).
This biomarker discovery platform was initially employed in “proof-of-principle” analyses to test the feasibility of autoantibody profiling. Sera from patients with BPH clinical progression and samples without clinical progression were chosen for this trial study. Specifically, serum from the MTOPS placebo group collected at the beginning of the trial (i.e. T0 samples) was tested. These MTOPS samples, representing patients who did not receive drug therapy, substituted for local samples for this Phase I study. For the purpose of these analyses, BPH progression was defined as ≥4-point increase in the baseline AUA symptom score within the shortest possible time period following initial enrollment. All samples were matched for baseline PSA and baseline prostate volume. The following was the sample selection criteria: PSA levels ≥3.3 ng/ml with prostate volumes ≥40 cm3 who progressed (n=9) versus those with similar baseline characteristics that did not progress by year-4 of the MTOPS trial (n=9) (as defined as AUA symptom score of less than a 4-point increase in the baseline by year-4 of the MTOPS trial). Results show that there is a clear preferential autoantibody reactivity profile for the immobilized antigens in patients with BPH progression versus those that did not progress (Figure 3).
Figure 3. Antigen-Autoantibody Reactivities Using Different CyDyes.
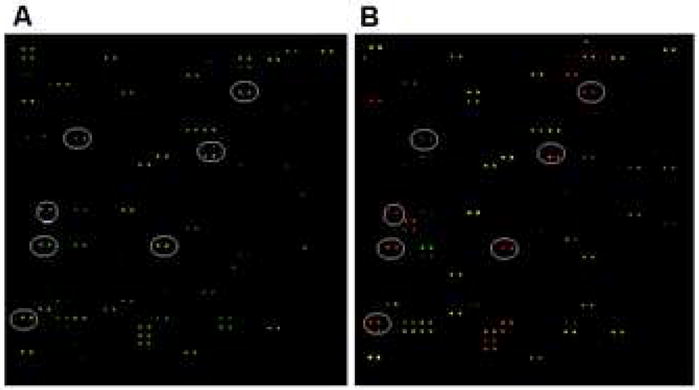
Each view represents the same autoantibody microarray in its entirety. (A) Antibodies from BPH patients with clinical progression were labeled with Cy3 dye (green), and patients without progression were labeled with Cy5 dye (red). Green spots highlighted by the ovals illustrate Cy3 > Cy5 and thus a distinct autoantibody profile for progression versus non-progression. (B) The CyDyes were reversed. Antibodies from BPH patients with clinical progression were now labeled with Cy5 dye (red), and patients without progression were now labeled with Cy3 dye (green). Red spots highlighted by the ovals illustrates Cy5 > Cy3 and, thus, illustrates the consistency of progression versus non-progression antigen-autoantibody reactivities when using different CyDyes.
Since the antigens were immobilized with known monoclonal antibodies on the array, the antigens recognized by the autoantibodies were easily identified. In this preliminary study, 19 unique autoantigens preferentially associated with BPH progression with p-values ≤0.05 were identified. Many of these autoantigens are involved in cell cycle or proliferation events, including Rb2, eEF-2 kinase, cyclin D1, cyclin D3, Ha-ras oncogene, c-myc oncogene, Stat 2, GM-CSF, p73a, among others. In addition, a Citron Rho-interacting kinase, CRIK 16, 17, which appears to be involved in the regulation of contractile activity by regulating myosin light chain phosphorylation 16, 17, was also identified in BPH progression samples versus non-progression samples.
Although these results are very preliminary, the autoantigens identified are consistent with published data derived from expression microarrays of tissues from symptomatic and asymptomatic BPH.13 Prakash et al 13 demonstrated that genes associated with cell proliferation (e.g., calcium/calmodulin-dependent serine kinase, S-phase kinase-associated protein 2 or p45) were significantly up-regulated in the symptomatic BPH group. While the results of this study are promising, further research must be carried out to evaluate the exact predictive values of individual and/or multiplexed antigen-autoantibody reactivities for stratifying BPH progression. These early results demonstrate that the “reverse capture” autoantibody microarray platform has the capacity to detect consistent differences in autoantibody expression between patients with BPH progression from patients that do not progress, thereby addressing an important question in BPH clinical management.
Transcriptone Profiling for Assessing Differential Gene Expression in the Prostate
One clinically important issue in the evaluation of BPH is the finding that histological BPH is apparently not completely associated with clinical (i.e. symptomatic) BPH. To better understand the molecular changes associated specifically with symptomatic BPH, an experimental approach assessing transcriptomic differences, meaning differences in the mRNA expression profile, between symptomatic BPH and normal non-hyperplastic prostate tissues was initiated by the UT Southwestern Medical Center MPSA Discovery Site. In this study, the transcriptome of well-demarcated prostate periurethra tissues from 12 symptomatic BPH patients who had received no treatment (age range 55–78) and from 12 normal donors (less than 33 years old) were analyzed using Qiagen 22K human oligo chips with an invert labeling confirmation (Qiagen Inc., Valencia, CA). Microarray data was analyzed sing Gene Traffic software (Lobion Informatics Inc., La Jolla, Ca). Results revealed 1,142 sequences expressed at two-fold or greater levels in the BPH tissue versus the normal tissue or in normal versus BPH tissue. Further analyses indicated that 43 of these differential expressed markers are potentially secreted proteins or are serum proteins, which are the primary focus of the MPSA discovery efforts. Candidates were prioritized for further study if they (i) are serum proteins or detectable in serum, (ii) are biologically relevant to cellular proliferation and regulation, and (iii) have available antibodies. From this analysis 14 candidates were prioritized for Phase I and Phase II proof of principle and feasibility studies. The prioritized biomarker candidates selected include the GRO3 oncogene (MIP1), cyclooxygenase-2 (COX-2), lactotransferrin, glycoprotein hormone A peptide, vitronectin (VITN), periostin (PSTN), α2-macroglobulin (α2-M), connective tissue growth factor (CTGF), amphirregulin (AREG), matrix metalloproteinase1 (MMP1), interleukin 6 (IL-6), transforming growth factor β (TGFβ), tissue factor pathway inhibitor, and chromogramlin A (Table 1). For Phase I and Phase II identification and validation locally available archived BPH tissues (UT Southwestern O’Brien Tissue Repository funded by NIDDK) and local serum specimens were utilized, as per our original three phase strategy for biomarker discovery. These analyses further demonstrated that these candidates are readily detectable in serum. ELISA results utilizing a subset of MTOPS serum samples from a pre-Phase III analysis indicated that the levels of CRO3 oncogene, lactotransferrin, glycoprotein hormones A peptide, VITN, PSTN, α2-M, and MMP1 are significantly different in serum from patients with a high AUA symptom score (28 and above) compared to those with lower AUA symptom scores (< 8).
Table 1.
Differential Expressed Genes between the Symptomatic BPH and Normal Prostate Tissues from Transcriptome Analyses.
| Gene description | Gene ID | Fold changed |
|---|---|---|
| Periostin | NM-006475 | 3.12 |
| Vitronectin | NM-000638 | 2.32 |
| Cyclooxygenase -2 | NM-000963 | 3.15 |
| Glycoprotein hormones A peptide | NM-000735 | 2.71 |
| Matrix metalloproteinase 1 | NM-002421 | 9.64 |
| Amphiregulin | NM-001657 | 6.06 |
| CRO3 oncogene | NM-002090 | 5.24 |
| α2-macroglobulin (α2-M) | NM-000014 | 3.45 |
| Connective tissue growth factor (CTGF | NM-001901 | 2.79 |
| lactotransferrin | NM-002343 | 5.27 |
| Tissue factor pathway inhibitor 2 | NM-006528 | 9.41 |
| Transforming growth factor beta | NM-000660 | 1.46 |
| Chromogranin A | NM-001275 | 3.33 |
| Interleukin 6 | NM-000600 | 15.91 |
In a Phase III analysis, these candidates were vigorously validated using ELISA and a set of 218 banked MTOPS non-randomized time zero (T0) serum specimens. Results revealed that the levels of CGA, TFP, AREG, and IL-6 are different in serum from patients with a high AUA symptom score (24 or above) compared to those with lower AUA symptom score (8 and less). These four markers are considered promising potential candidate markers for molecularly differentiating symptomatic BPH and are now being further evaluated in multi-parametric studies in which additional clinical parameters including AUR, UTI or urosepsis, incontinence, among others, will be examined. Multi-variant analyses are also in progress using age, baseline serum PSA, and baseline prostate volume as additional parameters to determine which individual parameter or combination of parameters is most predictive of future prostate growth.
Identification of Androgen Regulated Proteins Secreted by Benign Human Prostate Using an In Vivo Xenograft Model
A major effort of the MPSA is the identification of novel secreted biomarkers with the potential to predict BPH progression. To address this goal a xenografting technique developed by the Vanderbilt MPSA site18 was employed to specifically identify androgen-regulated genes in benign human prostate tissues. Androgen regulation was chosen because of the key role that steroid hormones play in prostatic development and disease. In this approach sets of benign human prostate tissues were xenografted to the renal capsule of castrated mice, which are then divided into two matched groups. One group represents an androgen ablation (i.e. castrated) group while the other is supplemented with a silastic tube containing 25mg of testosterone. Tissue grafts are allowed one month to become established in their hosts. At the end of this time period the castrate hosts are given testosterone in the form of a subcutaneous pellet. Concurrently the silastic tubes containing testosterone are removed from the androgen supplemented group. This provides two groups, a castrate group in which xenografted human prostate tissue is responding to androgens and a group in which human prostate tissue is responding to androgen withdrawal. Animals carrying the xenografts were sacrificed at initiation of the steroid manipulation experiment and at various times over a three week period following the change in androgen status. This provides samples covering the acute and longer term responses to these manipulations.
In the present study, human prostate tissues were harvested and processed to generate mRNA for microarray screening. Gene expression was examined using a 30k oligomer array with expression correlated against a common standard. Bioinformatic analysis was used to identify genes regulated either positively or negatively by androgens. Genes expressed at low levels were removed in a screening process even if they showed significant regulation. Within this group of genes, further bioinformatic screening was used to identify genes coding for secreted products. This filtering produced a subgroup of 96 candidates which was then further screened using chip-based qRT-PCR ( ). In order to identify genes regulated by androgens that also correlate with BPH (and/or prostate cancer) progression, panels of RNA isolated from normal prostate, mild, moderate and severe BPH (based upon assessment of transition zone volume) were screened using the 96 gene qRT-PCR chips. Normal and prostate cancer tissues were also compared. From this analysis, approximately 50 androgen-regulated candidate marker genes whose expression levels correlate either positively or (occasionally) negatively with BPH severity were identified. Expression of some of these genes is also elevated or suppressed in prostate cancer tissues. Changes in cancer may be in the same or opposite directions to those seen in BPH. This suggests the possibility of generating future serum-based assays to differentiate men with BPH from men with prostate cancer. Importantly, the gene list included obvious candidates, such as prostate specific antigen (PSA) and prostatic acid phosphatase (PAP), adding confidence that relevant candidates were being identified. Proteomic analysis of serum samples are currently being conducted to determine whether the various proteins can be reliably identified in serum and if levels of these proteins differ in serum from men with or without BPH. Initial studies are also being performed using traditional biochemical assays, which may be followed-up with the development of mass spectrometry based assays. If successful, these assays would allow simultaneous screening for a large number of these proteins in samples from relevant BPH and non-BPH cohorts, including Phase III analyses using MTOPS samples.
Biomarkers for Defining Histological versus Clinical BPH
As a result of gene expression analyses by the Johns Hopkins MPSA Discovery Site comparing histologic BPH and symptomatic BPH, it became apparent that although BPH is sometimes considered to be a single disease at the cellular and molecular level, is it not. 13 The populations selected for this analysis were organ donors with histologic BPH and no treatment history for BPH and that were asymptomatic for the disease, men with prostate cancer undergoing prostatectomy and no significant symptoms, and those who underwent open prostatectomies for their severely symptomatic BPH. One factor identified in this biomarker discovery study as associated specifically with symptomatic BPH was JM-27. Initial data revealed JM-27 expression is apparently quite prostate specific and is significantly up-regulated in symptomatic BPH. After completion of the initial gene expression studies the expression pattern of JM-27 was assessed at the protein level. Utilizing antibodies generated by the Johns Hopkins site, it was revealed that JM-27 is an androgen-regulated stromal-specific protein.19 Furthermore, based upon immunohistochemical analysis both in single samples and in tissue microarrays (TMAs), it was shown that JM-27 can distinguish at the tissue level highly symptomatic individuals from those with histologic disease. At the mRNA level, JM-27 is found to be expressed around 18 fold higher in men with highly symptomatic BPH. Interestingly, JM-27 expression is down-regulated by treatments with the α-adrenergic receptor agonist doxazosin in cellular models.20
As stated above, the MPSA’s primary goal is to develop serum-based biomarkers of BPH. To evaluate the potential of JM-27 as a clinical marker for BPH, a serum-based ELISA assay was developed utilizing a novel anti-JM-27 monoclonal antibody. Initial studies using Phase I local samples revealed that this assay is sensitive, detecting JM-27 at the low ng/ml level within the serum. Moreover, utilizing a cutoff established for this analysis, serum levels of JM-27 were shown to distinguish between symptomatic and asymptomatic patient sets with a sensitivity and specificity of 90% and 77%, respectively. 21 The presence of prostate cancer in these men does not appear to alter the levels of the marker. Additional samples were obtained from the non-randomized T0 MTOPS patients for a subsequent Phase II study. These samples were evaluated for JM-27 levels and supported the earlier Phase I studies. In addition, these samples permitted the evaluation of one of the MPSA’s secondary clinical outcomes for BPH, prostate volume, on serum JM-27 levels. It is apparent from these studies that prostatic volume does not appear to influence JM-27 levels. These studies are believed to represent the first characterization of a serum-based marker for severe BPH. 21 The Johns Hopkins MPSA site is currently in the process of analyzing the entire T0 sample set from the MTOPS clinical trial for JM-27 levels and the correlation of JM-27 expression with clinical parameters and outcomes. This Phase III study should address many of the primary and secondary endpoints established as part of this Consortium.
Analysis of PSA Isoforms as Serum Markers of BPH
PSA (human kallikrein 3) is a member of the tissue kallikrein family of proteases and is expressed as an inactive precursor-pro-enzyme. Activation of PSA requires initial proteolytic removal of the signal sequence to create the pro-enzyme, followed by removal of seven residues from the N-terminus of the pro-enzyme.22 Inactivation of PSA occurs through one of three mechanisms: Complexing of active PSA with protease inhibitors; proteolytic cleavage; or through a third undefined mechanism that leaves PSA full length and uncleaved, yet inactive.23 Proteolytic cleavage of PSA has been described at a number of sites but is most commonly observed at Lys145-146 and to a lesser extent at Lys182-183 (25). In serum, greater than 50% of PSA is bound to protease inhibitors. The remainder of serum PSA not in complex, termed "free PSA" (fPSA), is a mixture comprised of the various inactivated cleaved and intact forms.23,24 Most of the internally cleaved PSA in BPH tissue is cleaved at both Lys145 and Lys182.25 This mature, enzymatically inactive form of fPSA, found at highest concentration in BPH tissue, has been dubbed “BPSA” (Benign PSA) or more recently renamed “BPH-A” (BPH antigen). 25–27
The fact that BPH-A levels are elevated in BPH tissue above normal transition zone tissue or peripheral zone tissue suggests it may be of clinical utility as a biomarker, provided it is stable and detectable in serum. Taking advantage of the change in conformation created by the internal cleavage at Lys182, Beckman Coulter (Fullerton, CA) developed a Lys182 cleavage specific monoclonal antibody and a sensitive immunoassay (for research use only) that detects BPH-A at picomolar concentrations.28 Using this assay the Baylor MPSA Discovery Site has performed the first evaluations (Phase II studies) of the correlation between serum BPH-A concentration and prostate volume. The results reveal that BPH-A correlates with prostate and transition zone volume in an age-independent fashion.29 Total PSA, on the other hand, has a weaker and age-dependent correlation with transition zone volume.29 Serum BPH-A concentration outperformed both PSA and fPSA in its ability to predict transition zone enlargement.29,30 Of note, this was also the second study to evaluate the correlation of fPSA, not in a ratio to PSA, with prostate volume. As demonstrated by the only other study to evaluate this correlation, fPSA displayed an age-independent correlation with transition zone volume.31 When BPH-A was subtracted from the absolute fPSA concentration, the correlation of fPSA with prostate volume decreased to below that of total PSA.28,29 This suggests that the correlation between prostate volume and fPSA is primarily due to the contribution of BPH-A.
In light of these findings, and to determine whether BPH-A is a clinically useful predictor of BPH pathology, progression, or outcomes, BPH-A levels were measured in frozen archival serum obtained at baseline from the approximately 3000 randomized participants in the MTOPS trial. BPH-A was measured in these samples using the ELISA assay described above and constituted a Phase III test of BPH-A as a serum marker. The results from this study suggest that a threshold amount of BPH must be present in order to raise serum BPH-A above background levels and shows that BPH-A correlates with baseline transition zone volume only in patients with a total PSA above 2.5ng/ml. Furthermore, as the total PSA increases, the correlation between BPH-A and transition zone volume also increases. Furthermore, a nomogram (i.e. a mathematical algorithm that predicts the probability of a potential pathological state based on a number of clinically determined parameters) constructed using the MTOPS baseline clinical data demonstrates a significantly enhanced accuracy in predicting acute urinary retention and BPH related surgery when baseline BPH-A levels were added to the paradigm (unpublished data).
Subsequent to the measurement of BPH-A in the baseline MTOPS samples, Beckman Coulter developed a BPH-A assay formatted for the Access® clinical platform (currently for research use only). Utilizing this automated system, BPH-A was measured in approximately 1000 baseline patient serum samples from the GSK ARIA 3001–3003 dutasteride trials32 in which participants were followed for 3–5 years. The results from this additional test of BPH-A as a serum marker suggest that BPH-A improves the prediction of BPH progression and together with fPSA more accurately identifies prostate enlargement than total PSA. ROC curve analysis for prediction of baseline prostate volume >30cc, >40cc, and >50cc revealed that a model including both fPSA and BPH-A outperformed total PSA, and either BPH-A or fPSA alone33. Addition of BPH-A to a nomogram that included each patient’s symptom severity, as measured by the American Urological Association Symptom Index (AUA SI)34 and the BPH Impact Index35; maximum urinary flow rate (Qmax); history of alpha-blocker use; and dutasteride treatment improved its Concordance Index (CI) from 0.724 to 0.738. This improvement could not be matched or improved by the addition of baseline prostate volume.36,37 Taken together the results from these MPSA Phase II and III studies suggest that serum BPH-A concentration provides additional predictive value beyond that of prostate volume measurement in determining BPH progression. These findings set the stage for future development of clinical assays for prediction of BPH outcomes.
BPH Biomarkers Arising from Microarray Analysis of Enlarged Prostates or those Treated with Standard BPH Drug Therapies
The Baylor MPSA Discovery Site conducted two Phase I studies to identify: (1) prostate transition zone (TZ)-specific gene expression correlated with increased prostate volume, and (2) TZ-specific gene expression changes regulated by medical therapy for BPH using selective α1-receptor blockade, 5α-reductase type II inhibition, or both. In the first study TZ tissues were isolated from prostates of less than 30g (small) and from TZ BPH nodular tissue from prostates of greater than 80g (large) in patients undergoing radical prostatectomy for cancer. Only benign TZ tissue was collected and used for mircoarray analysis. Total RNA from these samples was amplified, reverse transcribed, labeled, and hybridized to GeneChip Human Genome U133 Plus 2.0 Arrays (Affymetrix, Santa Clara, CA). Statistical analysis of the arrays was performed using GeneSpring 7.3 software (Agilent Technologies, Foster City, CA) and revealed a total of 4,008 genes that showed significant differential gene expression (p≤0.05, t test) between large and small prostates. Of these significant genes, those with changes in mRNA levels of ≥1.5 fold (n=1,072 genes) were considered for further analysis.
In the second Phase I study, designed to address whether BPH drug therapy alters prostate TZ-specific gene profiles, patients awaiting radical prostatectomy for prostate cancer were given a standard oral therapeutic course of tamsulosin (α1-receptor blocker), finasteride (5α-reductase inhibitor) or both drugs for between 2 and 6 weeks weeks prior to surgery. TZ BPH nodular tissue was isolated post surgery from prostates with a median size of 52g. Total RNA was purified and analyzed using GeneChip Human Genome U133 Plus 2.0 Arrays (Affymetrix). Comparison of changes in gene expression between drug regimen was performed by ANOVA. This initial analysis yielded greater than 5,000 genes with significant a difference (p≤.05) in at least one comparison. Of these genes several hundred showed at least one change of ≥1.5 fold compared to untreated prostates. To narrow the field of candidate biomarker genes for BPH, the results from these two Phase I studies were combined. Genes differentially expressed in enlarged prostates and those also differentially expressed following drug treatment were grouped by cellular pathway or common function using Ingenuity pathway analysis (Ingenuity Systems, Redwood City, CA). Overlapping significant genes (i.e. those that coincided in the experimental analyses of both Phase I studies) and those with the highest fold changes in expression levels in either experiment were considered most likely to be of interest to understanding the biology of BPH and were considered for experimentation and potential marker development.
Phase II testing and validation of the differential expression of 30 identified genes that met the above criteria was then conducted. Individual comparisons were made between small and large prostates and between no drug and drug treatments for each therapeutic drug condition using real-time quantitative RT-PCR (Q-RT-PCR). The Q-RT-PCR results revealed five genes with significant differential expression (p .05; as determined by t-test) both between small and large prostate and by at least one of the drug treatments. These genes included three pro-inflammatory chemokines, CXCL9 (MIG), CXCL10 (IP-10), and CXCL11 (I-TAC), which are all induced by interferon-γ (IFNγ) and act through the same G protein coupled receptor CXCR3 38,39; the Wnt signaling inhibitor, DKK3 40, one of several Wnt genes identified in our analysis; and the predominantly neural adhesion molecule Contactin 1 41, which has recently been shown to be involved in Notch signaling 42,43. Contactin 1 is of particular interest since its adhesion ligands CD56 and tenascin are expressed in prostate stroma 44,45. In further Phase II tests, the expression of these five gene products was confirmed in prostate tissue by immunohistochemistry and in prostate cell lines by flow cytometry.
To determine if these gene products have utility as markers of BPH and for Phase III testing, the Baylor site has begun development of Luminex® (Luminex Corp., Austin, TX) bead-based protein assays. Luminex® bead assays are essentially sandwinch ELISA assays, but with the primary capture antibody attached to a latex bead instead of a 96 well plate. By attaching specific capture antibodies to a single bead variant (beads come in optically distinct variants that permit discrimination between 100 different types), measurement of several soluble serum proteins can be measured simultaneously in a multiplex array. To date functional serum assays have been developed for the three chemokines. A functional assay for contactin 1 has also been developed, which is now being optimizing for serum. Unfortunately, due to a lack of functionally appropriate antibodies, attempts to develop a functional assay for DKK3 have not proven successful. Preliminary Phase III testing of the chemokine assays has been performed on a cohort of 82 archival serum samples from MTOPS participants who failed to meet the criteria for randomization into the trial (i.e. non-randomized T0 samples). Although not significant in this small sample set, the serum concentrations of the three CXCR3 binding chemokines show a trend of increasing concentration with increasing symptoms (based on responses to the AUA Symptom Index). Currently, additional Phase II/III tests are being conducted on small local sample sets to determine if a larger Phase III study using the archival baseline MTOPS sample set is warranted. Ultimately, the aim of these studies is to extend the present nomogram models to include some or all of these novel serum markers, as well as BPH-A, in an effort to enhance the accuracy of predicting clinically important endpoints for BPH patients.
Development of a Molecular Signature for BPH Responsive to 5α-Reductase Inhibitor Treatment
The MTOPS clinical trial demonstrated definitively that medical therapy of BPH can arrest disease progress. 6,46 Alpha-adrenergic antagonist therapy has become the most widely accepted first-line therapy for symptomatic BPH.47 For patients who fail on their initial therapy, a 5α-reductase inhibitor (e.g. finasteride) can be added to the therapeutic regimen. However, some men do not respond to medical treatment, leading to either acute urinary retention or severe symptoms requiring surgery. As determined by the MPSA Steering Committee, the group’s primary clinical outcome and prioritized need driving the biomarker discovery efforts is to distinguish men that would benefit from the addition of finasteride as part of a dual drug therapy with α1-blockers. One approach adopted by the MPSA to address this question was to identify and characterize a molecular signature from the MTOPS clinical trial biopsy samples to aid in distinguishing men who respond to finasteride from men who do not benefit from this additional medical treatment.
All previous molecular studies of BPH have used non-trial materials and the majority of BPH data was derived using surgical specimens (i.e., TURP samples), which by definition are all medical or symptomatic “failures”. For example, Prakash et al. attempted to delineate molecular differences associated with BPH (50). This approach used a 42K DNA microarray with samples from patients with normal prostate tissue, asymptomatic BPH, symptomatic BPH, and BPH in combination with prostate cancer. A number of genes were identified as associated with cell proliferation (e.g. calcium/calmodulin-dependent serine kinase, phosphor-serine phosphatase, S-phase kinase-associated protein 2 or p45) that were significantly up-regulated in the symptomatic BPH group compared to all other groups examined. Two subsets of genes including several inflammatory mediators (e.g., lymphotoxin beta, immunoglobulins, and chemokine receptors), cytokines, and extracellular matrix-associated molecules (e.g., RANTES, osteonectin, lumican) appear to distinguish symptomatic BPH and BPH with cancer as a separate group distinct from the normal and asymptomatic BPH groups.13 Their study demonstrates a proof of principle but still falls short of being able to address the critical clinical question identified by the MPSA Steering Committee, namely, which men with BPH will respond to the addition of finasteride. However, the study by Prakash et al. is probably one of the most informative expression array studies on BPH, largely because the samples tested were derived from men with symptomatic BPH and were not taken from prostatectomy samples from men with prostate cancer.
To begin to address these questions, the Harvard Medical School/Brigham and Women’s Hospital MPSA Discovery Site undertook a pilot study to demonstrate the potential of performing expression array analysis on frozen prostate needle biopsy samples from the MTOPS trial. Here state of the art techniques in RNA amplification were employed using MTOPS clinical samples in order to perform expression array analysis on 30K cDNA arrays.48,49 These approaches were previously successful with prostate cancer samples. 49 As part of this pilot study, 30 frozen tissue samples that originated from needle biopsies of the left or right transitional zone of the prostatic gland (n=15 each) were obtained. Each of these MTOPS specimens represented a single case and all samples were from non-randomized patients. Initially, the samples were divided into two groups based on the overall stroma to epithelial ratio (Figure 4). The epithelial to stroma ratio was determined using a semi-automated quantitative image analysis system, ACIS II (Chromavision, San Juan Capistrano, CA). This novel approach avoids subjective determinations by pathologists, which have the potential to be extremely inaccurate (unpublished results). The mean percentage of stroma to epithelium for the 23 macro dissected samples was 96.5% (standard deviation +/− 2.6%). Given the high percentage of stroma in these 23 samples, they were directly processed for expression array analysis as outlined in figure 4. RNA was extracted, amplified according to the RubiconTM approach and cDNA was hybridized to 30K arrays.48,49 For the remaining 7 samples laser capture microscopy (LCM) was performed (VeritasTM LCM device). Stromal cells were separated from epithelial cells and RNA was isolated. The remaining steps were similar to the other non-LCM approach.
Figure 4. Expression Array Analysis on Frozen Prostate Needle Biopsy Samples.
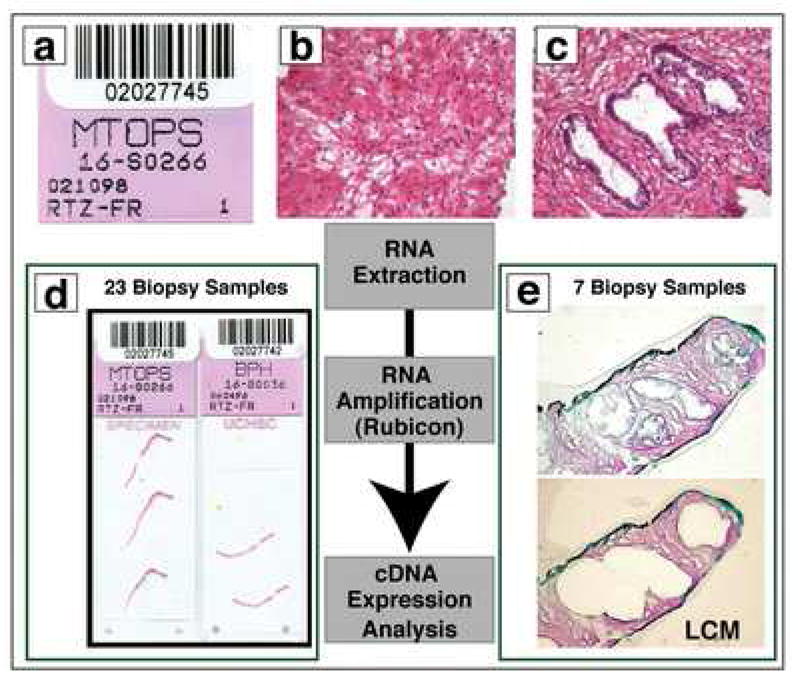
The work flow for this MPSA pilot project is presented in this schematic figure. All cases are logged into the system using the MTOPS research ID code (A). Histologic evaluation of the samples occurs to determine the precise composition of each sample (B and C; reduced from X100). Some cases had predominantly stromal tissue (B) and other cases had more epithelium (C) requiring laser capture microdissection (LCM). In the pilot study, 23 biopsy samples had high enough stromal concentration that they did not require LCM (D; reduced from X1). 7 biopsy samples underwent LCM (data pending). After pre-processing, all samples undergo RNA extraction, RNA amplification, and finally cDNA expression analysis (E; reduced from X40).
The resulting MTOPS DNA microarray biopsy profiles reflect transcriptomic differences between BPH stroma and normal stroma and between BPH stroma and BPH epithelia (Figure 5). RNA from MTOPS BPH samples (stroma-enriched) was hybridized to two-color microarrays, with RNA from the (epithelia-enriched) normal prostate pool used as reference channel. Using the MTOPS BPH expression profile data, genes (i.e. mRNAs) profiled were ranked by high expression (compared to the reference channel). Genes were ranked a second time according to the indicated criteria, using a different profile dataset as indicated. For the given number of top genes (ranging from 1 to 1000) from each ranked list, the number of genes in common between the gene sets was tabulated. The significance of shared gene overlap was assessed by permutation testing, which yielded the expected chance overlap along with standard deviation for a random assignment of sample labels in each dataset. The main findings were that there was a correspondence between the top MTOPS BPH genes and genes over-expressed in LCM samples of BPH stroma compared to normal stroma (Figure 5a). The number of transcripts shared between the BPH and pubertal prostate datasets (10689) is indicated. A greater number of genes are shared between the top genes from each ranked list than would be expected by chance. No correspondence is evident between top MTOPS BPH genes and genes over-expressed in LCM samples of BPH epithelia compared to BPH epithelia (Figure 5b). Correspondence between top MTOPS BPH genes and genes over-expressed in LCM samples of BPH stroma compared to BPH epithelia is seen (Figure 5c). These findings suggest that BPH stroma has a unique set of over expressed genes that are seen in BPH or normal stroma or normal epithelium. While these findings were a strong proof of principle demonstrating that one could perform discovery on prostate biopsy samples from the MTOPS clinical trial, the definitive studies that would compare responders to non-finasteride responders remains to be performed.
Figure 5. DNA Microarray Profiles Reflect Transcriptomic Differences Between BPH Tissues and Between BPH and Normal Prostate Tissue.
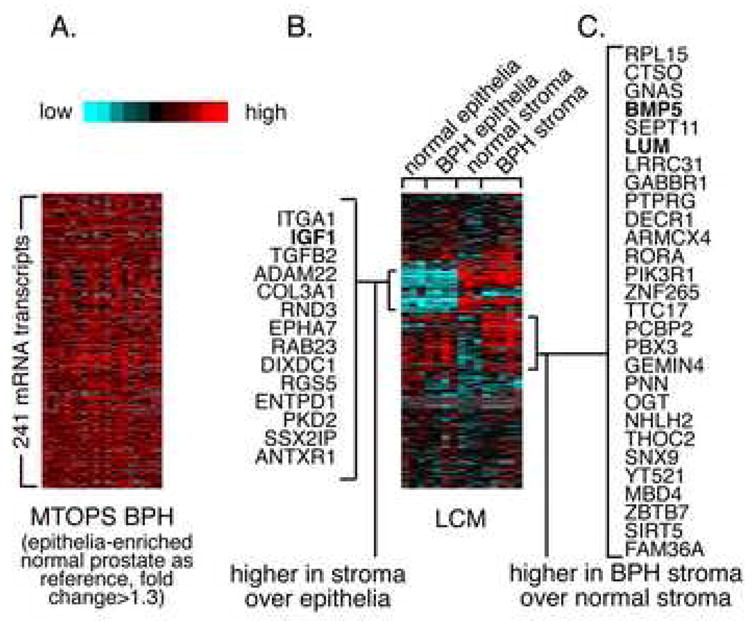
Expression data matrix of 241 genes (mRNAs) found with high expression (compared to reference channel) in MTOP BPH microarray profiles (average fold change>1.3), alongside the corresponding expression patterns for the genes in LCM profile data of stroma and epithelia from BPH and normal samples. See text for additional details.
Activities of the MPSA Pathology Coordinating Center
In 2002, the Prostate Diagnostic Laboratory at the University of Colorado Health Sciences Center was awarded designation as the Pathology Coordinating Center (PCC) for the MPSA Consortium. Parallel to activities in the MPSA Consortium, the PCC is also performing extensive image analysis studies on the formalin-fixed paraffin-embedded biopsies collected as part of the MTOPS trial. These studies are part of the MTOPS tissue analysis, a project that also holds considerable interest for the MPSA biomarker discovery group.
The PCC serves the MPSA Consortium through archival repository management and distribution of banked biological samples to consortium Biomarker Discovery Sites. The MTOPS biorepository consists of 17,499 separate serum specimens (stored at −80°C in 0.5 ml aliquots in O-ring sealed tubes); 3,474 formalin-fixed, paraffin-embedded multicore biopsies; and 6,996 un-fixed frozen biopsy cores stored in liquid nitrogen and is maintained, integrated into and tracked by a SQL database. This SQL based relational data structure allows for improved security, increased data granularity and long term data viability. The database can also be directly linked with data from the clinical data repository for the MTOPS trial (University of Alabama Birmingham). In addition, as a reference for MPSA Consortium investigators, a web-based Atlas of BPH Histopathology and Nomenclature was developed by the PCC during the first year of the project. This atlas, available on-line at http://fargo.uchsc.edu, details the complex heterogeneity of BPH from a pathologic viewpoint and provides a glossary of terminology.
The MPSA Consortium PCC is also involved in ongoing research activities, including a subcompartment analysis on archived MTOPS tissue samples. Originally initiated as a component of a tissue studies project for the MTOPS clinical group, these analyses are also of significance to the MPSA Consortium, as they provide insight into tissue biomarkers for BPH progression and are conducted cooperatively with MPSA Consortium and MTOPS clinical group. The goals of these studies are to determine the composition of individual biopsies from participants in the MTOPS trial in terms of percent of epithelium, smooth muscle, fibroconnective tissue stroma, and lumina at baseline and end-of-study and the quantification of inflammation and to correlate these findings with clinical measures of symptom severity and outcome. A more complete understanding of how tissue composition affects progression of BPH is important for several reasons. First, it may provide insight into the etiologic basis of LUTS and how successful treatment alters tissue composition. Second, identification of histopathologic changes that are associated with treatment failure in the MTOPS trial may serve as a rationale for transition zone biopsy prior to initiation of expensive therapies with little chance of success. Third, tissue-specific targets for future development of new therapies may be uncovered.
For tissue composition studies, all adequate prostate biopsies from the peripheral zone (PZ) and transition zone (TZ) from participants in the biopsy arm of the MTOPS trial (N=1,088) are sectioned and stained with a modified Masson’s trichrome method combined with immunohistochemistry for epithelial cytokeratin (AE1/AE3, Signet Laboratories, Inc., Dedham, MA). This method differentially stains epithelial elements brown, smooth muscle red, and fibrous tissue pale to dark blue. An adjacent section is also stained for basal cell-specific cytokeratin to identify basal cells within the epithelium (34βE12, Enzo Life Sciences, Farmingdale, NY). The biopsy cores are then imaged in their entirety using a microscope fitted with a computer image analysis system that captures high resolution images of the entire core that can be subsequently manipulated (Figure 6a). The images are prepped, the various subcompartments mapped by color-replacement using Adobe Photoshop (Adobe Systems, Inc., San Jose, CA) (Figure 6b) and the composition of each image quantified using Optimas (Media Cybernetics, Silver Spring, MD) software. Tissue subcompartment results are then correlated with clinical data on the participants including age, total prostate volume (PV), transition zone volume (TV), PSA, AUA symptom score and peak urinary flow rate (Qmax). Table 2 shows the Spearman correlation coefficients and P-values for the TZ biopsy subcompartment analyses. Although complete analysis of these data is currently ongoing, preliminary results show significant correlations between the quantity of several tissue components (epithelial and fibroconnective tissue) and PV, TV, PSA and age. Furthermore, the baseline stromal (smooth muscle and fibroconnective): epithelial ratios present within the TZ were modestly but significantly higher in those participants that progressed in MTOPS compared to those that did not progress (Table 3). End-of-study (i.e. year 5) biopsies from the same group of participants were collected to track longitudinal changes in tissue composition that ultimately effect outcome. In addition, similar technology is being employed to quantify the amount of inflammation in these biopsies.
Figure 6. MPSA Tissue Composition Analysis.
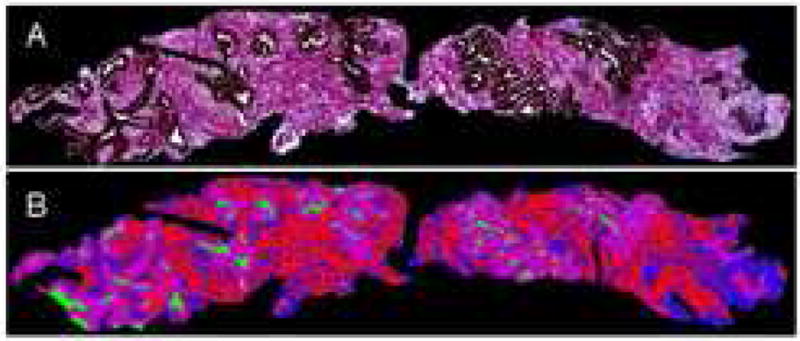
Prostate needle biopsy stained with Masson’s trichrome combined with immunhistochemistry for epithelial cytokeratin (A) and subsequently colorized (B) to demonstrate glandular epithelium (purple), glandular lumina (green), stromal smooth muscle (red), and stromal fibroconnective tissue (blue). Reduced from X2.5.
Table 2.
Spearman Coefficients (P-Values) for Morphologic Data with Clinical Data: Transition Zone.
| Age | PV | TV | PSA | AUAS | Qmax | |
|---|---|---|---|---|---|---|
| % sm muscle | -- | -- | -- | -- | -- | -- |
| % fibrous stroma | -- | -- | 0.068 (0.029) | -- | -- | -- |
| % epithelium | -- | - 0.104 (0.0007 ) | - 0.161 (<0.0001 ) | - 0.105 (0.0007 ) | -- | -- |
| % luminal epi | - 0.133 (0.04) | - 0.097 (0.013) | - 0.151 (<0.0001 ) | - 0.101 (0.001) | -- | -- |
| % basal epi | -- | - 0.076 (0.02) | - 0.109 (0.0004) | -- | -- | -- |
| % lumen | -- | - 0.113 (0.0003 ) | - 0.129 (<0.0001 ) | - 0.103 (0.0008 ) | -- | -- |
| Epi:fib stroma | - 0.171 (<0.0001 ) | - 0.084 (0.007) | - 0.133 (<0.0001 ) | - 0.090 (0.004) | -- | -- |
| Epi:sm muscle | -- | - 0.090 (0.004) | - 0.140 (<0.0001 ) | - 0.082 (0.008) | -- | -- |
| Epi:mus+stro ma | -- | - 0.105 (0.0006 ) | - 0.161 (<0.0001 ) | -0.105 (0.0006 ) | -- | -- |
Table 3.
Transition zone: Median Values in Participants with and without a Progression Event.
| No Event (N=923) | With Event (N=126) | Relative Difference | P Value | |
|---|---|---|---|---|
| Total Epithelium (%) | 15.4 (5.8, 30.6) | 14.0 (5.2, 27.5) | ↓9.1% | 0.042 |
| Mus+stroma: Epi (%) | 505.7 (200, 1566) | 564.9 (233, 1623) | ↑11.7% | 0.045 |
Summary
Evolving pharmacological therapies have proven effective for management of BPH-related LUTS and have led to a shift in focus away from invasive procedures as standard clinical care.4, 5 With new treatment options it is important to identify patients early who may benefit from particular medical therapies or are at greater risk for disease progression necessitating future surgical intervention. In response to these needs, the MPSA Consortium was established with the goal of improving predictive strategies for BPH outcomes and ultimately treatment selection, as well as further defining the pathophysiologic basis for symptomatic and non-symptomatic BPH, through the identification and validation of molecular and cellular markers. The MPSA Consortium represents a unique BPH biomarker discovery effort in its multi-site organization and highly integrated, cooperative, and methodologically diverse scientific approach.
Through the various technical approaches employed by the MPSA investigators, a number of promising biomarkers linked to clinical parameters are being identified and insights are being gained into the molecular and cellular etiology of BPH. Autoantibody and mRNA microarray approaches have yielded candidate serum markers associated with BPH progression and symptomatic BPH, respectively. Xenografting techniques identified a panel of prostate genes regulated by androgens, thus providing insights into mechanisms of prostate growth regulation. MPSA developed microarrays and serum-based ELISAs identified an especially promising biomarker candidate, JM-27, to differentiate symptomatic and non-symptomatic BPH and is currently being examined for correlation with clinical outcomes, including response to drug therapy and disease progression. Detailed studies of various PSA isoforms revealed that BPH-A (formerly termed BPSA) serum levels correlate with increased prostate volume and incorporation of BPH-A measurements significantly increases the power of nomograms to predict BPH progression. Microarray studies have yielded a number of genes differentially expressed based on prostates size and response to different drug therapies. Several chemokines identified in this study are now being examined for their utility in a clinical serum assay employing a bead-based ELISA technique. Differences in tissue specific gene transcription in BPH are being examined through an expression array assay using biopsy samples from different prostate regions. This MPSA discovery effort is yielding important insights into region specific cellular changes associated with BPH development, progression, and response to drug therapy. Histopathological studies of prostate tissue composition are providing information on cellular changes associated with response to drug therapy, failure to improve following therapy, and disease progression and have great potential to expand our understanding of the etiology of LUTS and asymptomatic BPH, as well as to allow better prediction of clinical outcomes for patients. Most of the above studies are the subject of continued investigation and are providing a foundation for future analyses and validation by not only the MPSA Consortium but also the scientific community at large.
In addition to the above scientific findings, the MPSA Consortium is providing important insights into the process of collaborative, multi-disciplinary research and serves as one model for such efforts. Initially, the group focused on generating a consensus set of scientific goals for biomarker development. Questions driving biomarker discovery were chosen and prioritized based on potential significance to clinical care, with a focus on markers that may predict patient response to initial mono and dual drug therapy and disease progression. These discussions directed the group’s efforts toward questions of highest clinical relevance. In addition, a three phase discovery strategy was developed to direct biomarker discovery and ensure stringent criteria for marker development and utilization of valuable archived samples. In addition, while the group shared a common set of goals, all participating sites were free to utilize their respective methodological strengths. This multi-disciplinary approach proved effective and has fostered diverse approaches and cross-validation of results through multiple techniques. In addition, the highly collaborative nature of the MPSA Consortium provided a synergy for advancing the discovery efforts through the active sharing of resources and data. Establishment of an independent EAC provided an objective assessment of progress and scientific direction.
Though the MPSA Consortium has made important advances in the identification and initial characterization of molecular markers for BPH, much work remains to be done to further validation of these findings and ultimately translation of validated findings to clinical practice.
Acknowledgments
The MPSA Consortium acknowledges support through NIH grants: DK63593 (R. Getzenberg, Johns Hopkins University), DK63597 (M.S. Lucia, Univ. of Colorado), DK63587 (S. Hayward, Vanderbilt University), DK63661 (V. Lin, University of Texas, Southwestern Medical Center), DK63665 (B. C.-S. Liu, Brigham and Women’s Hospital), AG022312 (M. Rubin, Harvard Medical School/Brigham and Women’s Hospital), DK63594 (K. Slawin, Baylor College of Medicine).
Appendix I: The MPSA Consortium Participating Sites and Personnel
Sponsoring NIH Institutes
National Institute of Diabetes and Digestive and Kidney Diseases (NIDDK), Bethesda, MD: C. Mullins, PhD and R. Star, MD.
National Institute on Aging (NIA), Bethesda, MD: F. Bellino, PhD.
Steering Committee Chairman
R. H. Getzenberg, PhD, Johns Hopkins University School of Medicine, Baltimore, MD.
Biomarker Discovery Centers
Johns Hopkins University School of Medicine, Baltimore, MD: R. H. Getzenberg, PhD (PI=principal investigator); G. W. Cannon; C. Minnery, Pharm. D; U. Shah, PhD; R. Dhir, MD (University of Pittsburgh).
Vanderbilt University Medical Center, Nashville, TN: S. W. Hayward, PhD (PI); S. B. Shappell, MD, PhD; J. R. Smith, MD, PhD; H. D. Love, PhD.
The University of Texas, Southwest Medical Center, Dallas, TX: V. Lin, PhD (PI); J.T. Hsieh, PhD; J.D. McConnell, MD; C.G. Roehrborn, MD; H. Saboorian, MD.
Brigham and Women’s Hospital, Boston, MA: B. C.-S. Liu, PhD (PI); S Qin, PhD; ML-T. Lee, PhD; J.R. Ehrlich, BA; J.P. Richie, MD; M.P. O’Leary, M.D.
Harvard Medical School/Brigham and Women’s Hospital, Boston, MA: M.A. Rubin, MD (PI); A.M. Chinnaiyan, MD, PhD; Scott Tomlins, PhD.
Baylor College of Medicine, Houston, TX: K. M. Slawin, MD (PI); J. M. Levitt, PhD; W. Song, MD; H-K Liu, BS; L. Guarigauta, BS.
Pathology Coordinating Center
University of Colorado Denver Health Sciences Center, Aurora, CO.: M.S. Lucia, MD (PI); F. La Rosa, MD; S. Wilson; D. Sun, MD; I. Burgschmidt, MD; M. Pardo, MD, K. Torkko, Ph.D, C. Arthur; D. Hicks; R. Dayton; E. Genova; N. Dunscomb.
Data Coordinating Center
The University of Alabama at Birmingham, Birmingham, AL: J. Y. Lee, PhD (PI); R. Oster (2005-Present).
The George Washington University Biostatistics Center, Rockville, MD: P. K. Burrows (PI); W. Noble, PhD; O. Bautista, PhD (2003–2005).
External Advisory Committee
S. Hewitt, MD, PhD (Chairman), National Cancer Institute, Bethesda, MD; G. Parmigiani, PhD, Johns Hopkins University, Baltimore, MD; R. W. Veltri, PhD, Johns Hopkins University,Baltimore,MD
Footnotes
Publisher's Disclaimer: This is a PDF file of an unedited manuscript that has been accepted for publication. As a service to our customers we are providing this early version of the manuscript. The manuscript will undergo copyediting, typesetting, and review of the resulting proof before it is published in its final citable form. Please note that during the production process errors may be discovered which could affect the content, and all legal disclaimers that apply to the journal pertain.
References
- 1.Roehrborn CG, McConnell JD, Saltzman B, Bergner D, Gray T, Narayan P, et al. Storage (irritative) and voiding (obstructive) symptoms as predictors of benign prostatic hyperplasia progression and related outcomes. Eur Urol. 2002;42:1. doi: 10.1016/s0302-2838(02)00210-5. [DOI] [PubMed] [Google Scholar]
- 2.McVary KT. BPH: epidemiology and comorbidities. Am J Manag Care. 2006;12:S122. [PubMed] [Google Scholar]
- 3.Wei JT, Calhoun E, Jacobsen SJ. Urologic diseases in America Project: benign prostatic hyperplasia. J Urol. 2005;173:1256. doi: 10.1097/01.ju.0000155709.37840.fe. [DOI] [PubMed] [Google Scholar]
- 4.Sarma AV, Jacobson DJ, McGree ME, Roberts RO, Lieber M, Jacobsen SJ. A population based study of incidence and treatment of benign prostatic hyperplasia among residents of Olmsted County, Minnesota: 1987 to 1997. J Urol. 2003;173:2048. doi: 10.1097/01.ju.0000158443.13918.d6. [DOI] [PubMed] [Google Scholar]
- 5.Chapple CR. Pharmacological therapy of benign prostatic hyperplasia/lower urinary tract symptoms: an overview for the practising clinician. BJU Int. 2004;94:738. doi: 10.1111/j.1464-410X.2004.05022.x. [DOI] [PubMed] [Google Scholar]
- 6.McConnell JD, Roehrborn CG, Baustista OM, Andriole GL, Jr, Dixon CM, Kusek JW, et al. The long-term effect of doxazosin, finasteride, and combination therapy on the clinical progression of benign prostatic hyperplasia. N Engl J Med. 2003;349:2387. doi: 10.1056/NEJMoa030656. [DOI] [PubMed] [Google Scholar]
- 7.Hewitt SM, Dear J, Star RA. Discovery of protein biomarkers for renal diseases. J Am Soc Nephrol. 2004;15:1677. doi: 10.1097/01.asn.0000129114.92265.32. [DOI] [PubMed] [Google Scholar]
- 8.De Gruttola VG, Clax P, DeMets DL, Downing GJ, Ellenberg SS, Friedman L, et al. Considerations in the evaluation of surrogate endpoints in clinical trials: summary of a National Institutes of Health workshop. Control Clin Trials. 2001;22:485. doi: 10.1016/s0197-2456(01)00153-2. [DOI] [PubMed] [Google Scholar]
- 9.Anim JT, Udo C, John B. Characterisation of inflammatory cells in benign prostatic hyperplasia. Acta Histochem. 1998;100(4):439. doi: 10.1016/S0065-1281(98)80040-8. [DOI] [PubMed] [Google Scholar]
- 10.Nickel JC, Downey J, Young I, Boag S. Asymptomatic inflammation and/or infection in benign prostatic hyperplasia. BJU Int. 1999;84(9):976. doi: 10.1046/j.1464-410x.1999.00352.x. [DOI] [PubMed] [Google Scholar]
- 11.Di Silverio F, Gentile V, De Matteis A, Mariotti G, Giuseppe V, Luigi PA, et al. Distribution of inflammation, pre-malignant lesions, incidental carcinoma in histologically confirmed benign prostatic hyperplasia: a retrospective analysis. Eur Urol. 2003;43(2):164. doi: 10.1016/s0302-2838(02)00548-1. [DOI] [PubMed] [Google Scholar]
- 12.Mahapokai W, van den Ingh TS, van Mil F, van Garderen E, Schalken JA, Mol JA, et al. Immune response in hormonally-induced prostatic hyperplasia in the dog. Vet Immunol Immunopathol. 2001;78(3–4):297. doi: 10.1016/s0165-2427(01)00236-7. [DOI] [PubMed] [Google Scholar]
- 13.Prakash K, Pirozzi G, Elashoff M, Munger W, Waga I, Dhir R, et al. Symptomatic and asymptomatic benign prostatic hyperplasia: molecular differentiation by using microarrays. Proc Natl Acad Sci U S A. 2002;99(11):7598. doi: 10.1073/pnas.112191399. [DOI] [PMC free article] [PubMed] [Google Scholar]
- 14.Ehrlich JR, Qin S, Liu BC. The “reverse capture” autoantibody microarray: a native antigen-based platform for autoantibody profiling. Nat Protoc. 2006;1:452. doi: 10.1038/nprot.2006.66. [DOI] [PubMed] [Google Scholar]
- 15.Qin S, Qiu W, Ehrlich JR, Ferdinand AS, Richie JP, O’leary MP, et al. Development of a “reverse capture” autoantibody microarray for studies of antigen-autoantibody profiling. Proteomics. 2006;6:3199. doi: 10.1002/pmic.200500673. [DOI] [PubMed] [Google Scholar]
- 16.Di Cunto F, Calautti E, Hsiao J, Ong L, Topley G, Turco E, et al. Citron rho-interacting kinase, a novel tissue-specific ser/thr kinase encompassing the Rho-Rac-binding protein Citron. J Biol Chem. 1998;273:29706. doi: 10.1074/jbc.273.45.29706. [DOI] [PubMed] [Google Scholar]
- 17.Yamashiro S, Totsukawa G, Yamakita Y, Sasaki Y, Madaule P, Ishizaki T, et al. Citron kinase, a Rho-dependent kinase, induces di-phosphorylation of regulatory light chain of myosin II. Mol Biol Cell. 2003;14:1745. doi: 10.1091/mbc.E02-07-0427. [DOI] [PMC free article] [PubMed] [Google Scholar]
- 18.Staack A, Donjacour AA, Brody J, Cunha GR, Carroll P. Mouse urogential development: a practical approach. Differentiation. 2003;71(7):402, 13. doi: 10.1046/j.1432-0436.2003.7107004.x. [DOI] [PubMed] [Google Scholar]
- 19.Shah US, Arlotti J, Dhir R, Lu S, Pirozzi G, Prakash K, et al. Androgen regulation of JM-27 is associated with the diseased prostate. J Androl. 2004;25:618. doi: 10.1002/j.1939-4640.2004.tb02832.x. [DOI] [PubMed] [Google Scholar]
- 20.Minnery CH, Getzenberg RH. Benign prostatic hyperplasia cell viability and modulation of JM-27 by doxazosin and ibuprofen. J Urol. 2005;174(1):375. doi: 10.1097/01.ju.0000161598.24740.34. [DOI] [PubMed] [Google Scholar]
- 21.Cannon GW, Mullins C, Lucia MS, Hayward SW, Lin V, Liu BC, et al. A preliminary study of JM-27: a serum marker that can specifically identify men with symptomatic benign prostatic hyperplasia. J Urol. 2007;177:610. doi: 10.1016/j.juro.2006.09.023. [DOI] [PubMed] [Google Scholar]
- 22.Lundwall A, Lilja H. Molecular cloning of human prostate specific antigen cDNA. FEBS Lett. 1987;214:317. doi: 10.1016/0014-5793(87)80078-9. [DOI] [PubMed] [Google Scholar]
- 23.Stenman UH, Leinonen J, Alfthan H, Rannikko S, Tuhkanen K, Alfthan O. A complex between prostate-specific antigen and alpha 1-antichymotrypsin is the major form of prostate-specific antigen in serum of patients with prostatic cancer: assay of the complex improves clinical sensitivity for cancer. Cancer Res. 1991;51:222. [PubMed] [Google Scholar]
- 24.Mikolajczyk SD, Marks LS, Partin AW, Rittenhouse HG. Free prostate-specific antigen in serum is becoming more complex. Urology. 2002;59:797. doi: 10.1016/s0090-4295(01)01605-3. [DOI] [PubMed] [Google Scholar]
- 25.Mikolajczyk SD, Millar LS, Wang TJ, Rittenhouse HG, Wolfert RL, Marks LS, et al. "BPSA," a specific molecular form of free prostate-specific antigen, is found predominantly in the transition zone of patients with nodular benign prostatic hyperplasia. Urology. 2000;55:41. doi: 10.1016/s0090-4295(99)00372-6. [DOI] [PubMed] [Google Scholar]
- 26.Slawin KM, Shariat S, Canto E. BPSA: a novel serum marker for benign prostatic hyperplasia. Rev Urol, suppl. 2005;7:S52. [PMC free article] [PubMed] [Google Scholar]
- 27.Levitt JM, Slawin KM. Prostate-specific antigen and prostate-specific antigen derivatives as predictors of benign prostatic hyperplasia progression. Curr Prostate Rep. 2007;5:21. doi: 10.1007/s11934-007-0072-y. [DOI] [PubMed] [Google Scholar]
- 28.Linton HJ, Marks LS, Millar LS, Knott CL, Rittenhouse HG, Mikolajczyk SD. Benign prostate-specific antigen (BPSA) in serum is increased in benign prostate disease. Clin Chem. 2003;49:253. doi: 10.1373/49.2.253. [DOI] [PubMed] [Google Scholar]
- 29.Canto EI, Singh H, Shariat SF, Lamb DJ, Mikolajczyk SD, Linton HJ, et al. Serum BPSA outperforms both total PSA and free PSA as a predictor of prostatic enlargement in men without prostate cancer. Urology. 2004;63:905. doi: 10.1016/j.urology.2003.12.037. [DOI] [PubMed] [Google Scholar]
- 30.Shariat SF, Canto EI, Kattan MW, Slawin KM. Beyond prostate-specific antigen: new serologic biomarkers for improved diagnosis and management of prostate cancer. Rev Urol. 2004;6:58. [PMC free article] [PubMed] [Google Scholar]
- 31.Morote J, Encabo G, Lopez M, de Torres IM. Prediction of prostate volume based on total and free serum prostate-specific antigen: is it reliable? Eur Urol. 2000;38:91. doi: 10.1159/000020258. [DOI] [PubMed] [Google Scholar]
- 32.Debruyne F, Barkin J, van Erps P, Reis M, Tammela TL, Roehrborn C, et al. Efficacy and safety of long-term treatment with the dual 5alpha-reductase inhibitor dutasteride in men with symptomatic benign prostatic hyperplasia. Eur Urol. 2004;46:488. doi: 10.1016/j.eururo.2004.05.008. [DOI] [PubMed] [Google Scholar]
- 33.Slawin KM, Levitt JM, Lamb DJ, Murthy L, Chuang W, Lu HK, et al. Prediction of prostate volume using molecular forms of PSA in men with BPH enrolled on the GSK Phase III Dutasteride Trials. J Urol, suppl. 2006;175(4):439. abstract 1363. [Google Scholar]
- 34.Barry MJ, Fowler FJ, Jr, O'Leary MP, Bruskewitz RC, Holtgrewe HL, Mebust WK, et al. The American Urological Association symptom index for benign prostatic hyperplasia The Measurement Committee of the American Urological Association. J Urol. 1992;148:1549. doi: 10.1016/s0022-5347(17)36966-5. [DOI] [PubMed] [Google Scholar]
- 35.Barry MJ, Fowler FJ, Jr, O'Leary MP, Bruskewitz RC, Holtgrewe HL, Mebust WK. Measuring disease-specific health status in men with benign prostatic hyperplasia. Measurement Committee of The American Urological Association. Med Care. 1995;33:AS145. [PubMed] [Google Scholar]
- 36.Slawin KM, Levitt JM, Lamb DJ, Murthy L, Chuang W, Lu HK, et al. Baseline serum BPH-A level enhances the accuracy of a nomogram to predict BPH progression in men enrolled on the GSK Phase III Dutasteride Trials. J Urol, suppl. 2006;175(4):436. abstract 1352. [Google Scholar]
- 37.Slawin KM, Kattan MW, Roehrborn CG, Wilson T. Development of nomogram to predict acute urinary retention or surgical intervention, with or without dutasteride therapy, in men with benign prostatic hyperplasia. Urology. 2006;67:84. doi: 10.1016/j.urology.2005.07.013. [DOI] [PubMed] [Google Scholar]
- 38.Lazzeri E, Romagnani P. CXCR3-binding chemokines: novel multifunctional therapeutic targets. Curr Drug Targets Immune Endocr Metabol Disord. 2005;5:109. doi: 10.2174/1568008053174723. [DOI] [PubMed] [Google Scholar]
- 39.Liu L, Callahan MK, Huang D, Ransohoff RM. Chemokine receptor CXCR3: an unexpected enigma. Curr Top Dev Biol. 2005;68:149. doi: 10.1016/S0070-2153(05)68006-4. [DOI] [PubMed] [Google Scholar]
- 40.Niehrs C. Function and biological roles of the Dickkopf family of Wnt modulators. Oncogene. 2006;25:7469. doi: 10.1038/sj.onc.1210054. [DOI] [PubMed] [Google Scholar]
- 41.Falk J, Bonnon C, Girault JA, Faivre-Sarrailh C. F3/contactin, a neuronal cell adhesion molecule implicated in axogenesis and myelination. Biol Cell. 2002;94:327. doi: 10.1016/s0248-4900(02)00006-0. [DOI] [PubMed] [Google Scholar]
- 42.Hu QD, Ang BT, Karsak M, Hu WP, Cui XY, Duka T, et al. F3/contactin acts as a functional ligand for Notch during oligodendrocyte maturation. Cell. 2003;115:163. doi: 10.1016/s0092-8674(03)00810-9. [DOI] [PubMed] [Google Scholar]
- 43.Hu QD, Ma QH, Gennarini G, Xiao ZC. Cross-talk between F3/contactin and Notch at axoglial interface: a role in oligodendrocyte development. Dev Neurosci. 2006;28:25. doi: 10.1159/000090750. [DOI] [PubMed] [Google Scholar]
- 44.Ibrahim SN, Lightner VA, Ventimiglia JB, Ibrahim GK, Walther PJ, Bigner DD, et al. Tenascin expression in prostatic hyperplasia, intraepithelial neoplasia, and carcinoma. Hum Pathol. 1993;24:982. doi: 10.1016/0046-8177(93)90112-t. [DOI] [PubMed] [Google Scholar]
- 45.Lynch DF, Jr, Hassen W, Clements MA, Schellhammer PF, Wright GL., Jr Serum levels of endothelial and neural cell adhesion molecules in prostate cancer. Prostate. 1997;32:214. doi: 10.1002/(sici)1097-0045(19970801)32:3<214::aid-pros8>3.0.co;2-k. [DOI] [PubMed] [Google Scholar]
- 46.McConnell JD, Bruskewitz R, Walsh P, Andriole G, Lieber M, Holtgrewe HL, et al. The effect of finasteride on the risk of acute urinary retention and the need for surgical treatment among men with benign prostatic hyperplasia. Finasteride Long-Term Efficacy and Safety Study Group. N Engl J Med. 1998;338(9):557. doi: 10.1056/NEJM199802263380901. [DOI] [PubMed] [Google Scholar]
- 47.Bruskewitz R. Management of symptomatic BPH in the US: who is treated and how? Eur Urol, suppl. 1999;36:7. doi: 10.1159/000052343. [DOI] [PubMed] [Google Scholar]
- 48.Tomlins SA, Mehra R, Rhodes DR, Cao X, Wang L, Dhanasekaran SM, et al. Integrative molecular concept modeling of prostate cancer progression. Nat Genet. 2007;39(1):41. doi: 10.1038/ng1935. [DOI] [PubMed] [Google Scholar]
- 49.Tomlins SA, Mehra R, Rhodes DR, Shah RB, Rubin MA, Bruening E, et al. Whole transcriptome amplification for gene expression profiling and development of molecular archives. Neoplasia. 2006;8(2):153. doi: 10.1593/neo.05754. [DOI] [PMC free article] [PubMed] [Google Scholar]