Abstract
'K2/SPICE' products are commonly laced with aminoalkylindole synthetic cannabinoids (i.e., JWH-018 and JWH-073) and are touted as ‘legal’ marijuana substitutes. Here we validate a liquid chromatography tandem mass spectrometry (LC-MS/MS) methsod for measuring urinary concentrations of JWH-018, JWH-073, and several potential metabolites of each. The analytical procedure has high capacity for sample throughput and does not require solid phase or liquid extraction. Evaluation of human urine specimens collected after the subjects reportedly administered JWH-018 or a mixture of JWH-018 and JWH-073 provides preliminary evidence of clinical utility. Two subjects that consumed JWH-018 primarily excreted glucuronidated conjugates of 5-(3-(1-naphthoyl)-1H-indol-1-yl)-pentanoic acid (> 50 ng/ml) and (1-(5-hydroxypentyl)- 1H -indol-3-yl)(naphthalene-1-yl)-methanone (> 30 ng/ml). Interestingly, oxidized metabolites of both JWH-018 and JWH-073 were detected in these specimens, suggesting either metabolic demethylation of JWH-018 to JWH-073 or a non-reported, previous JWH-073 exposure. Metabolic profiles generated from a subject who consumed a mixture of JWH-018 and JWH-073 were similar to profiles generated from subjects who presumably consumed JWH-018 exclusively. Oxidized metabolites of JWH-018 and JWH-073 were of the same pattern, but JWH-018 metabolites were excreted at lower concentrations. These results begin clinically validating the LC-MS/MS assay for detecting and quantifying aminoalkylindole metabolites. Full validation awaits further testing.
Keywords: Cannabinoids, JWH-018, JWH-073, Synthetic cannabinoids, Aminoalkylindoles
INTRODUCTION
Two subtypes of cannabinoid receptors, CB1 and CB21–4, have been identified, and the drugs that bind them are structurally diverse. The most well studied psychoactive cannabinoid found in marijuana (Cannabis sativa) is Δ9-tetrahydrocannabinol (Δ9-THC). Since the discovery of the psychoactive properties of Δ9-THC in 1964 by Gaoni and Mechoulam1, many synthetic analogs of Δ9-THC have been investigated for their CB1 receptor mediated anti-emetic, appetite stimulating, and pain-relieving properties2. However, many of these synthetic cannabinoids, which include cyclohexylphenols (CP) and aminoalkylindoles (AAI), retain undesirable psychoactive properties and thus have not been approved for human use. Unfortunately, drug abusers have identified these pharmacological agents as new drugs of choice because they skirt existing regulation and are not detected in common drug screening assays3.
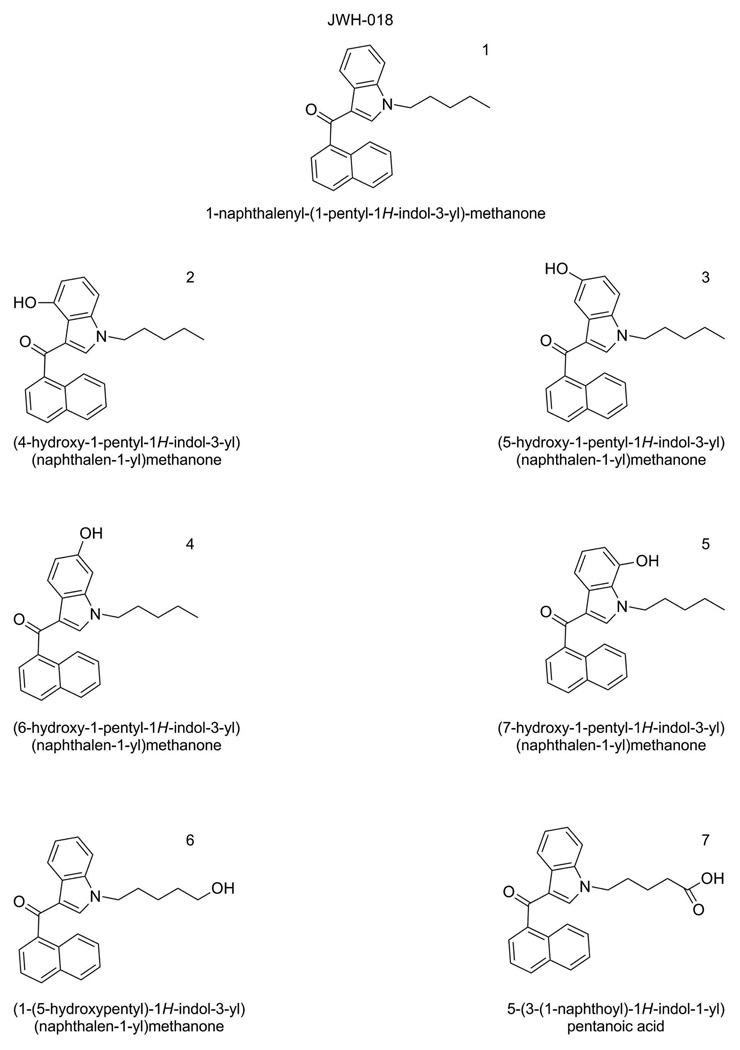
Beginning around 2004, a wide variety of products marketed as “legal” smoking blends or mixtures have been gaining popularity worldwide. These products, with popular brand names such as ‘SPICE’ and ‘K2’, are typically labeled as “incense” and “not for human consumption”, or “for aromatherapy only.” However, these products are nevertheless commonly absorbed by smoking and users often report effects similar to those of Cannabis—reddened conjunctiva, tachycardia, dry mouth, and altered perceptions and mood. Thus, it was suspected that many such products were adulterated with Δ9-THC or synthetic cannabinoids4. A German company, THC-Pharma, GmbH (Frankfurt, Germany), was among the first to identify JWH-018 (Figure 1, Compound 1) as a primary psychoactive constituent contained in these herbal products5. John W. Huffman, a Clemson University medicinal chemist, originally synthesized the “JWH” series of AAI while studying cannabinoid receptor pharmacology6. Since this initial report, many other laboratories have confirmed the presence of several synthetic CP and AAI derivatives in these commonly sold “incense” mixtures7.
Figure 1.
Structures of JWH-018 (compound 1), 5 hyroxylated metabolites of JWH-018 (compounds 2 – 6) and a carboxylated derivative of JWH-018 (Compound 7).
The emergence of synthetic cannabinoids as designer drugs of abuse is of considerable concern to physicians and public health officials because of the lack of consistent regulations and widespread use of products with varying mixtures and dosages4, 7–12. Although little data have been published to describe the clinical pharmacology of these substances, early clinical reports document patients presenting with symptoms atypical of simple marijuana use, including extreme agitation, syncope, tachycardia, and visual and auditory hallucinations13–16. Without a specific human assay, it is difficult to link clinical symptoms with product use, to associate epidemiological and clinical data with use patterns, and to fully appreciate the magnitude of potential health concerns associated with synthetic cannabinoid abuse.
There is very little information on the identification of native or hydroxylated/conjugated metabolites of AAI. Recently, two reports have measured AAI in blood or serum using LC-MS/MS17, 18, while another report by Sobolevsky et al. began identifying JWH-018 metabolites excreted in urine19 (Figure 1). The lack of metabolic standards has hindered the development of standardized assays for clinical and forensic laboratories. The purpose of the present work was to develop and preliminarily validate LC-MS/MS methods for the simultaneous quantification of the urinary concentration of JWH-018, JWH-073, and 6 oxidized metabolites previously identified for JWH-018. Similar oxidized metabolites for JWH-073 were also investigated. The utility of the method was tested in human urine specimens collected from individuals that self administered JWH-018 or a mixture of JWH-018 and JWH-073. The method uses authentic standards of hydroxylated AAI for accurate, low level quantitation and provides capacity for high sample throughput. The LC-MS/MS techniques employed remove the need for expensive and time-consuming sample preparation steps involving solid phase or liquid-liquid extraction. As the first step to begin clinically validating this procedure, we identify and quantify urinary biomarkers of JWH-018 and JWH-073 metabolism in human urine containing both hydroxylated and glucuronidated metabolites.
EXPERIMENTAL SECTION
Reagents and Chemicals
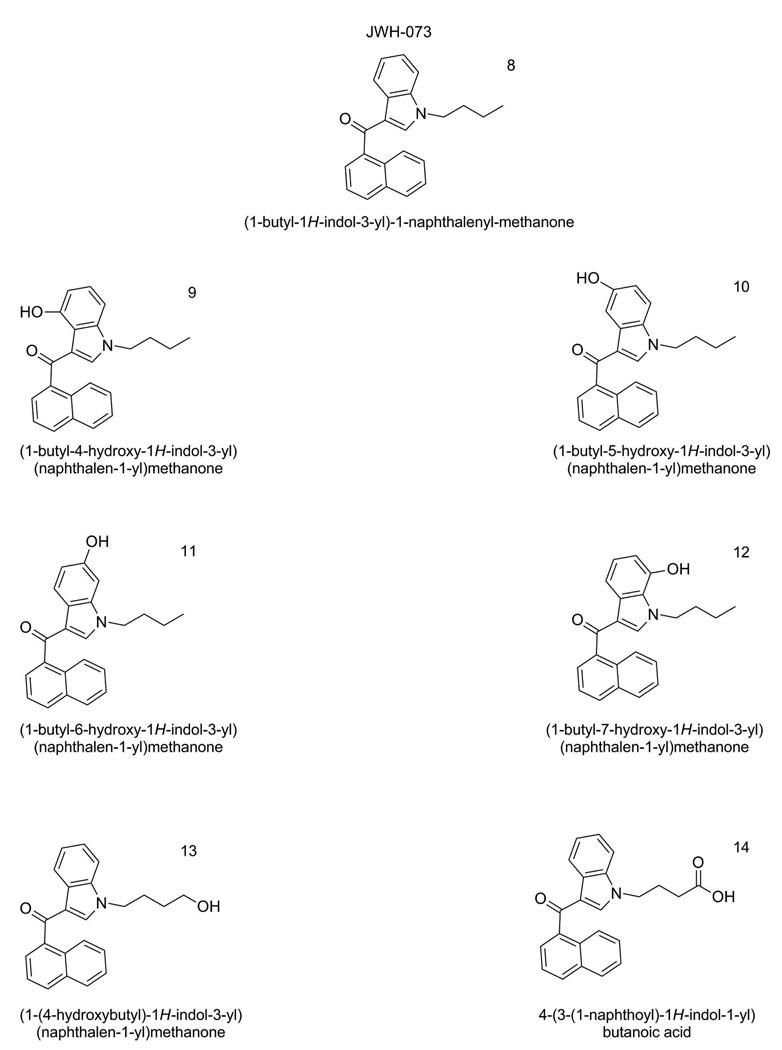
Optima LC-MS grade acetonitrile was purchased from Fisher Scientific (Pittsburgh, PA). Reagent grade formic acid (99% pure) was purchased from Acros Organic (Pittsburgh, PA). A.C.S. Spectrophotometric grade dimethyl sulfoxide (>99.9% pure) was purchased from Sigma-Aldrich (St. Louis, MO). Deionized water was purified to 18.2 MΩ-cm resistivity using an ELGA PURELAB Ultra laboratory water purification system (Woodridge, IL). Analytical standards were provided by Cayman Chemical (Ann Arbor, MI) and were assigned a sequential name (Compound 1–14). Specific nomenclature and structures for each compound are illustrated in Figures 1 and 2. Detailed information, and NMR spectra, for the analytical standards can be found as Supplemental Information.
Figure 2.
Structures of JWH-073 (Compound 7), 5 hyroxylated metabolites of JWH-073 (compounds 8–13) and a carboxylated derivative of JWH-073 (Compound 14).
Equipment
Sample analysis from 10 µl injections was performed using an Applied Biosystems API-4000 Q TRAP tandem mass spectrometer (Carlsbad, CA) interfaced with an Agilent 1200 Series quaternary liquid chromatography system (Santa Clara, CA). Analyst software (Version 1.5, Life Technologies, Carlsbad, CA) was used to control the overall operation of the HPLC system and the mass spectrometer.
Preparation of Analytical Standards, Quality Control Material, and Subject Samples
Analytical standards were prepared using a dimethyl sulfoxide calibration stock solution containing compounds 1–14 (100 µg/mL). This stock was stored at −40°C until use. Daily calibration standards were made by first preparing an intermediate working solution in a blank human urine pool (1,000 ng/mL), followed by serial dilution with blank human urine to yield final analytical standards (2–100 ng/mL). Blank human urine was collected from untimed urine collections provided by several volunteers. This quality control urine is maintained in clinical laboratories housed at the Arkansas Department of Health, Public Health Laboratory and is used for routine clinical analysis. Blank human urine pools were screened prior to use to ensure pools were void of AAI contamination.
Accuracy and precision measurements were assessed in quality control (QC) samples prepared by spiking blank human urine with varying levels of compounds 1–14. Final QC concentrations of 100, 50, and 10 ng/mL were representative of human subject samples tested in this study. All standards, QCs, and samples were processed identically and required 2-fold dilution with a 50% aqueous methanol solution prior to chromatographic separation.
Liquid Chromatography/Mass Spectrometry Conditions
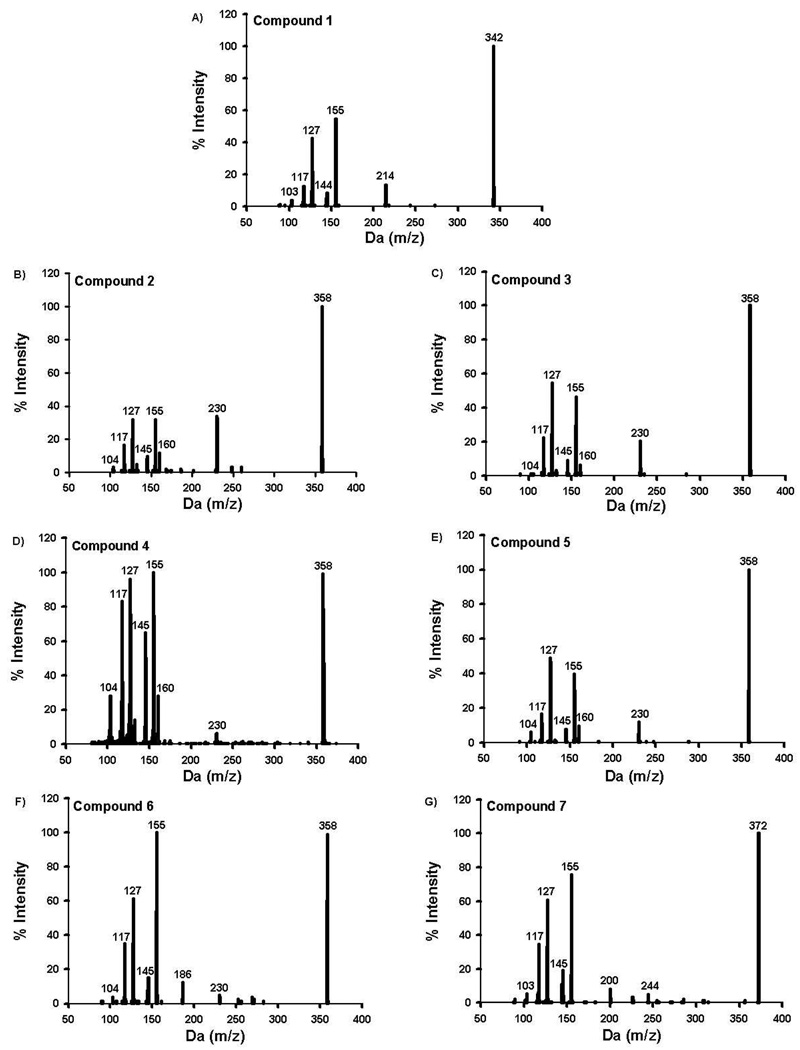
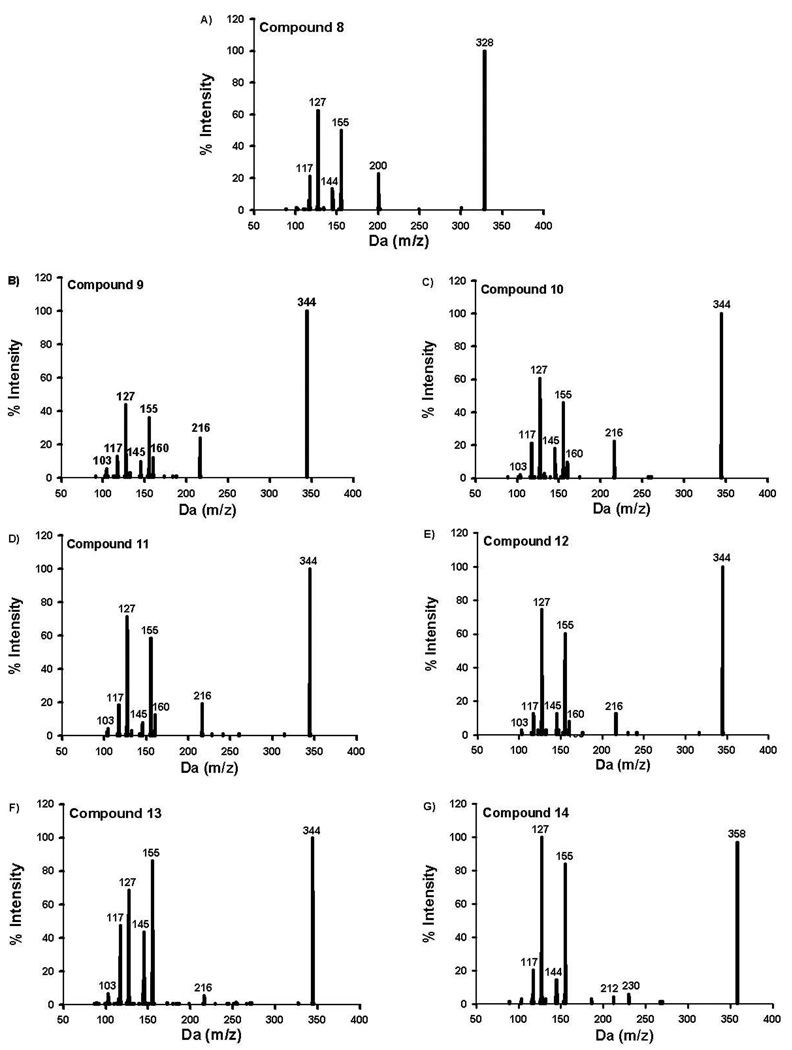
Analytes of interest were chromatographically separated using an Agilent Zorbax Eclipse XDB-C18 analytical column (150 × 4.6 mm, 5 µm) heated to 40°C. Mobile phases consisted of 0.1% formic acid in water (mobile phase A) and 0.1% formic acid in acetonitrile (mobile phase B). The gradient used consisted of 50% B (0 to 4.5 min), linear gradient from 50% B to 90% B (4.5 to 7.1 min), and 50% B (7.1 to 10 min). MS data were acquired in positive ion mode by electrospray ionization. The Turbo IonSpray source voltage was 2500 volts, and source temperature was maintained at 600°C. Nitrogen gas pressures for the GS1 and GS2 source gases, curtain gas, and collision gases were 55.0 cm/S, 55.0 cm/S, 35.0 cm/S, and “high”, respectively. Molecule specific parameters for Specific Reaction Monitoring-Information Dependent Acquisition (SRM-IDA) experiments are listed in Table 1. The SRM-IDA transition threshold that triggered Enhanced Product Ion (EPI) experiments was set to an intensity of 4000 counts per second. Specific EPI parameters are summarized in Table 1. Resulting EPI mass spectra for QC and unknown specimens were library matched against stored EPI mass spectra obtained from analytical standards (Figure 3–4) to ensure similar urinary metabolites that may interfere with analysis were fully resolved. Unidentified metabolites were identified using enhanced product ion spectra to identify appropriate molecular mass (m/z [MH]+) and characteristic fragment ions (m/z 155 and 127) expected for AAI derivatives.
Table 1.
MS/MS Experimental Conditions for Specific Reaction Monitoring (SRM) and Information-Dependent Acquisition-Enhanced Product Ion (IDA-EPI)
| Analyte | Q1 (m/z) |
Q3 (m/z) |
CEa (V) | EPb (V) | DPc (V) | CXPd (V) | |
|---|---|---|---|---|---|---|---|
| 1 | 342 | 155 | 37 | 10 | 86 | 12 | |
| 2–5 and 14 | 358 | 155 | 37 | 10 | 86 | 12 | |
| SRM | 7 | 372 | 155 | 37 | 10 | 86 | 12 |
| 8 | 328 | 155 | 35 | 10 | 71 | 12 | |
| 9–13 | 344 | 155 | 35 | 10 | 71 | 12 | |
| IDA-EPI | 1–14 | [MH]+ | 80–600 | 40 | 10 | 40 | NA |
CE, Collison Energy;
EP, Entrance Potential;
DP, Declustering Potential;
CXP, Collisiion Cell Exit Potential
Figure 3.
Resulting enhanced product ion produced from compounds 1–7 (Figure 1).
Figure 4.
Resulting enhanced product ion produced from compounds 8–14 (Figure 2).
Biochemical Assays
To evaluate the relative amount of product excreted as glucuronic acid conjugates, human urine samples were incubated in the presence and absence of β-glucuronidase (from E. coli, Type VII-A, 200 units, Sigma-Aldrich, St. Louis, MO) at 37°C for one hour. Resulting differences in calculated concentrations were used to estimate percent conjugation. Under these conditions hydrolysis of the glucuronidated metabolites was determined to be complete by establishing and monitoring SRM experiments specific for glucuronidated metabolites.
Human Subject Study Design
Three human subject urine samples used for this study were existing samples analyzed by the Arkansas Department of Health, Public Health Laboratory. The Institutional Review Board for the University of Arkansas for Medical Sciences approved the use of the samples for this study. Human urine specimens were provided by the Poison Control Center in New York, the North Shore University Hospital in New Jersey, and the Arkansas State Crime Laboratory. Clinical information has recently been published for the specimen collected by New York Poison Control20. Little to no dosing or other relevant toxicological information was provided along with the other specimens. In all cases, the specific products suspected of being consumed prior to urine collection were tested for drug content by the Arkansas State Crime Laboratory.
Statistical Methods
Accuracy was calculated as the absolute percent relative error for each of the expected QC concentrations using the following equation: [| nominal concentration–mean calculated concentration |]/nominal concentration] * 100. Analytical precision was calculated as the percent C.V. for replicate measurements at the three QC concentrations. The limit of detection was estimated as less than the lowest calibrator (2 ng/ml), while the lower limit of quantitation (LLQ) was estimated as three times the standard deviation of the mean calculated concentration of the QC low sample. Minimum reporting limits (MRL) were calculated as five times the LLQ because β-glucuronidase treatment required a 5-fold dilution prior to sample preparation.
RESULTS AND DISCUSSION
Although AAI were originally investigated as new cannabimimetic drugs, forensic reports have identified several synthetic cannabinoids in products sold on the internet and at local ‘head shops8, 12. It appears that JWH-018 and JWH-073 are commonly mixed in herbal products being sold in the US21, and it appears that the abuse of these compounds is on the rise among teenagers and other susceptible populations18. Greater than 50% of samples collected from hospitals, detoxification and therapy centers, forensic psychiatric centers and police authorities tested positive for at least one AAI.
Dressen et al. recently reported an LC-MS/MS method capable of detecting and measuring several AAI and other similar synthetic cannabinoids in human serum18. This method is effective for the detection of psychoactive compounds but does not evaluate downstream metabolic products. Sobolevsky et al. reported urinary metabolite data for JWH-018 in three subjects who smoked JWH-01819. Although authentic standards were not available for accurate quantitation and mass spectra comparison, they were able to identify compounds 6 and 7 as primary urinary metabolites excreted as glucuronic acid conjugates. Compounds 2, 3, 4, and 5 were also reported to potentially be excreted as minor metabolites, but mass spectra data could not distinguish and conclusively identify the specific metabolites.
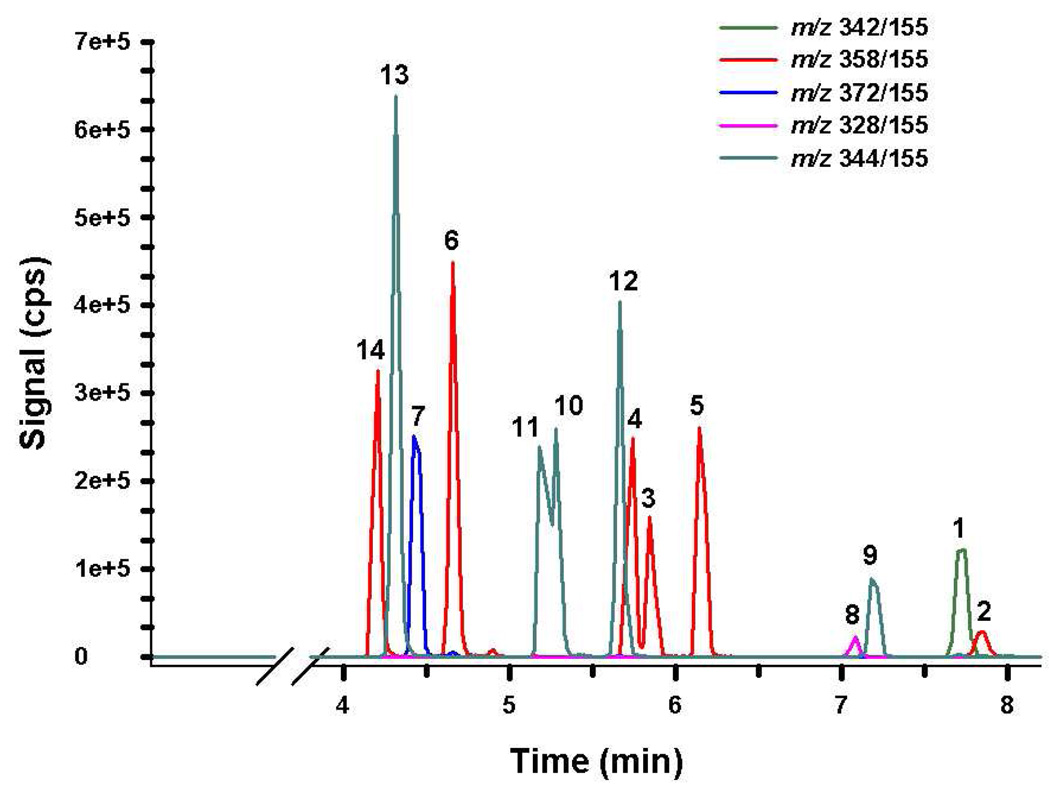
The method described in this report provides a reliable method for accurately and precisely measuring urinary concentration of compounds 1–14 (Figures 1 and 2), in human urine fortified with these standards. Baseline resolution was achieved for each analyte, except for compounds 10 and 11 (Figure 5). Retention times were consistent between all standards, QCs, and samples and did not shift upon subsequent injections. While all analytes of interest consistently elute within 8 minutes, the total analytical run time was extended to 10 minutes to ensure column equilibration prior to subsequent injections. Figures 3 and 4 are the MS/MS product ion spectra for each of the standards, and mass spectra of the corresponding metabolites identified in subject samples were essentially identical. Spectra comparisons were performed to monitor for potential unknown contaminants or other unidentified metabolites in subject samples.
Figure 5.
Resulting chromatograph produced from 50 ng/mL QC standard prepared in human urine. Chromatography was similar in all standards and unknown specimens. Different color tracings are representative of Specific Reaction Monitoring experiments (Table 1) used to detect compounds 1–14 (Figures 1 – 2).
The potential for autosampler carryover was assessed by injecting blank urine specimens that did not contain any standard material and ethanol blanks. Analysis of blank injections throughout the method validation showed no indication of autosampler carryover when methanol was used as the needle rinse solvent. Precision and accuracy was assessed by replicate, nonconsecutive analysis (N = 7) of prepared QC standards. A high degree of accuracy and precision was observed for all analytes of interest (Table 2). Since compounds 10 and 11 were not fully chromatographically resolved, these analytes required manual integration. Extended gradients were explored to fully resolve these analytes, but were not required because reasonable accuracy and precision data were obtained with manual integration (Table 2) and because it appeared that humans primarily excreted Compound 11 in urine. LLQ and MRL calculations ranged approximately from 2 to 10 ng/ml and 10 to 60 ng/ml, respectively (Table 3). A quadratic instrument response over the calibration range (2–100 ng/ml) was observed in all experiments. Independent calibration curves were produced for each batch by plotting the instrument response (counts per second) for each calibration standard against the nominal analyte concentration and applying quadratic regression with 1/X weighting to calculate a line of best fit. Mean regression coefficients were greater than 0.993 for all analytes tested over nonconsecutive days (Table 3).
Table 2.
Summary of Accuracy and Precision
| Quality Control Low (10 ng/ml) |
Quality Control Medium (50 ng/ml) |
Quality Control High (100 ng/ml) |
|||||||
|---|---|---|---|---|---|---|---|---|---|
| Analyte | Conc. ± SD (ng/ml) |
% CVa | % REb | Conc. ± SD (ng/ml) |
% CVa | % REb | Conc. ± SD (ng/ml) |
% CVa | % REb |
| 1 | 9.0 ± 0.9 | 10.0 | 9.8 | 48.5 ± 7.2 | 14.8 | 3.1 | 99.5 ± 7.9 | 7.9 | 0.6 |
| 2 | 11.3 ± 1.2 | 10.8 | 12.8 | 44.9 ± 4.7 | 10.5 | 10.2 | 107 ± 10.2 | 9.5 | 6.8 |
| 3 | 9.2 ± 0.8 | 9.0 | 8.0 | 49.1 ± 8.0 | 16.3 | 1.8 | 104 ± 12.3 | 11.8 | 3.5 |
| 4 | 10.2 ± 1.1 | 10.7 | 1.6 | 51.3 ± 6.8 | 13.3 | 2.6 | 103 ± 6.0 | 5.8 | 3.4 |
| 5 | 9.3 ± 0.8 | 8.6 | 7.6 | 51.2 ± 5.2 | 10.2 | 2.4 | 104 ± 5.2 | 5.0 | 4.1 |
| 6 | 9.8 ± 0.6 | 5.8 | 1.7 | 49.2 ± 6.9 | 14.1 | 1.6 | 116 ± 16.7 | 14.4 | 16.0 |
| 7 | 10.1 ± 1.1 | 11.3 | 0.7 | 55.9 ± 12.1 | 21.5 | 12.0 | 106 ± 31.8 | 29.8 | 6.4 |
| 8 | 10.6 ± 2.1 | 19.7 | 5.9 | 47.9 ± 3.4 | 7.10 | 4.2 | 91.9 ± 9.6 | 10.5 | 8.1 |
| 9 | 9.2 ± 1.6 | 16.9 | 8.1 | 45.9 ± 6.6 | 14.4 | 8.1 | 110 ± 10.9 | 10.0 | 10.0 |
| 10 | 8.4 ± 0.8 | 9.3 | 16.1 | 39.8 ± 2.6 | 6.55 | 20.4 | 94.9 ± 5.8 | 6.1 | 5.1 |
| 11 | 11.5 ± 3.6 | 31.2 | 14.5 | 55.9 ± 11.8 | 21.0 | 12.0 | 94.8 ± 7.9 | 8.3 | 5.2 |
| 12 | 9.3 ± 0.6 | 6.9 | 7.1 | 50.5 ± 7.2 | 14.3 | 1.1 | 99.3 ± 6.6 | 7.3 | 0.7 |
| 13 | 10.3 ± 1.1 | 10.6 | 2.6 | 50.3 ± 5.2 | 10.2 | 0.6 | 93.0 ± 4.1 | 4.4 | 7.0 |
| 14 | 10.6 ± 2.0 | 19.1 | 6.1 | 50.3 ± 10.2 | 20.2 | 0.7 | 104 ± 15.3 | 14.7 | 3.8 |
% CV, Coefficient of Variation;
% RE, Absolute Relative Error
Table 3.
Summary of Reporting Limits*
| Analyte | Mean R2 | MDLa ng/ml, (nM) |
LLQb ng/ml, (nM) |
MRLc ng/ml, (nM) |
|---|---|---|---|---|
| 1 | 0.998 | < 2.0 (5.9) | 2.7 (7.9) | 13.5 (40) |
| 2 | 0.997 | < 2.0 (5.6) | 3.6 (10.1) | 18.0 (51) |
| 3 | 0.998 | < 2.0 (5.6) | 2.4 (6.7) | 12.0 (34) |
| 4 | 0.998 | < 2.0 (5.6) | 3.3 (9.2) | 16.5 (46) |
| 5 | 0.998 | < 2.0 (5.6) | 2.4 (6.7) | 12.0 (34) |
| 6 | 0.997 | < 2.0 (5.6) | 1.8 (5.0) | 9.0 (25) |
| 7 | 0.998 | < 2.0 (6.1) | 3.3 (10.1) | 16.5 (51) |
| 8 | 0.997 | < 2.0 (5.8) | 6.3 (18.4) | 31.5 (90) |
| 9 | 0.997 | < 2.0 (5.8) | 4.8 (14) | 24.0 (70) |
| 10 | 0.993 | < 2.0 (5.8) | 2.4 (7.0) | 12.0 (35) |
| 11 | 0.996 | < 2.0 (5.8) | 10.8 (31.5) | 54.0 (158) |
| 12 | 0.998 | < 2.0 (5.8) | 1.8 (5.3) | 9.0 (27) |
| 13 | 0.996 | < 2.0 (5.8) | 3.3 (9.6) | 16.5 (48) |
| 14 | 0.997 | < 2.0 (5.6) | 6.0 (16.8) | 30.0 (84) |
Data are based on 7 independent experiments conducted on nonconsecutive days,
Minimum Detection Limit;
LLQ, Lower limit of Quantification;
MRL, Minimum Reporting Limit
Previous reports using LC-MS/MS and GC-MS methods for measuring AAI and their urinary metabolites required extraction, concentration or derivatization17–19. All of these procedures are time consuming and can significantly increase analytical costs. The method presented here only requires a simple methanolic dilution step, and depending on the specific analyte of interest, may require β-glucuronidase treatment. To examine the full utility of this new assay, urine specimens collected from three subjects who had recently used AAI were analyzed. Two individuals consumed JWH-018 prior to urine collection, while a third subject consumed a mixture of JWH-018 and JWH-073. The products suspected of being self administered by these individuals were evaluated by the Arkansas State Crime Laboratory to assess cannabinoid content and to determine if other drugs were present. Products obtained for Specimens 1 and 2 were characterized as being off-white powders, while the product obtained for specimen 3 was characterized as a green leafy material present in a cigarette butt. Using standard GC-MS testing procedures, the crime laboratory was able to confirm the presence of JWH-018 in the white powders. No other drugs of abuse were detected in the tested powders; however, a mixture of JWH-018 and JWH-073 was present in the tested plant material. The procedure used by the crime laboratory is capable of detecting trace levels of many AAIs and other synthetic cannabinoids being used to lace “K2” products.
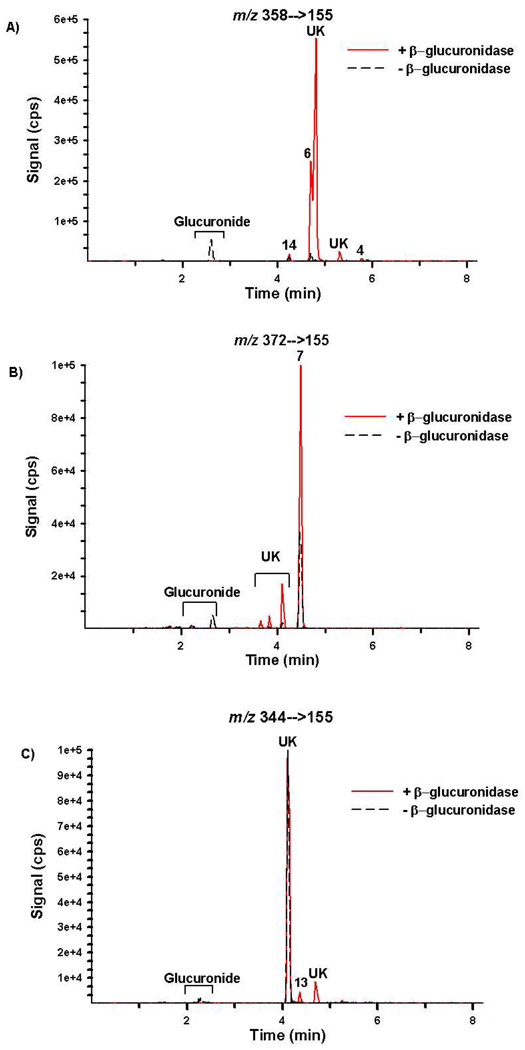
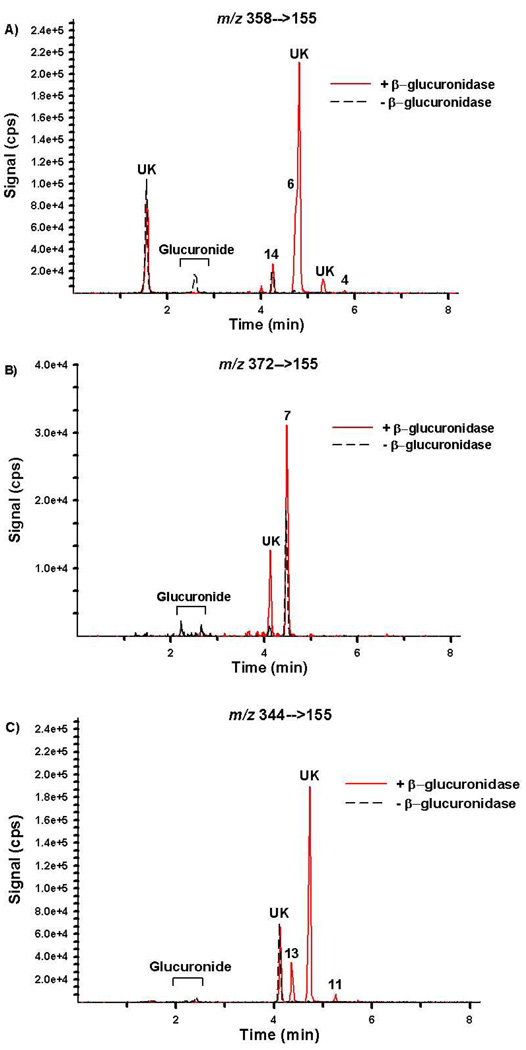
Chromatographic resolution of the primary metabolites excreted by representative subjects is presented in Figures 6 and 7 and resulting concentrations are summarized in Table 4. Retention times and product ion mass spectra comparisons are consistent with mass spectral libraries created with authentic standards (Figures 3–5). Experiments with β-glucuronidase are also consistent with previous reports19 showing that the detected oxidized metabolites are excreted primarily as glucuronic acid conjugates (Figures 6 and 7 and Table 4). Figures 6 and 7 are provided as representative examples of chromatographs generated from urine collected after consuming JWH-018 and after consuming a mixture containing JWH-018 and JWH-073, respectively.
Figure 6.
Extracted ion chromatographs from Specific Reaction Monitoring experiments performed with Specimen 1 before (black dash tracing) and after (red tracing) β-glucuronidase incubation. Signal for m/z (A) 358/155, (B) 372/155, and (C) 344/155 were used to monitor compounds 2–5 and 14; Compound 7; and compounds 9–13, respectively. This specimen was collected after JWH-018 use. “UK” denotes a potential contaminant or unidentified metabolites.
Figure 7.
Extracted ion chromatographs from Specific Reaction Monitoring experiments performed with Specimen 3 before (black dash tracing) and after (red tracing) β-glucuronidase incubation. Signal for m/z (A) 358/155, (B) 372/155, and (C) 344/155 were used to monitor compounds 2–5 and 14; Compound 7; and compounds 9–13, respectively. This specimen was collected after JWH-018 and JWH-073 use. “UK” denotes a potential contaminant or unidentified metabolites.
Table 4.
Urinalysis Summary
| Analyte | 1 | 2 | 3 | 4 | 5 | 6 | 7 | |
|---|---|---|---|---|---|---|---|---|
| Specimen 1 | Total Urinary Concentration (ng/ml) | — | — | <12 | <17 | — | 83 | 44 |
| Glucuronic Acid Conjugate (%) | — | — | 100 | 100 | — | 95 | 55 | |
| Specimen 2 | Total Urinary Concentration (ng/ml) | — | — | <12 | — | — | 50 | 30 |
| Glucuronic Acid Conjugate (%) | — | — | 100 | — | 91 | 70 | ||
| Specimen 3 | Total Urinary Concentration (ng/ml) | — | — | — | <17 | — | 26 | 16 |
| Glucuronic Acid Conjugate (%) | — | — | — | 100 | — | 86 | 44 | |
| Analyte | 8 | 9 | 10 | 11 | 12 | 13 | 14 | |
| Specimen 1 | Total Urinary Concentration (ng/ml) | — | — | — | — | — | — | <30 |
| Glucuronic Acid Conjugate (%) | — | — | — | — | — | — | 19 | |
| Specimen 2 | Total Urinary Concentration (ng/ml) | — | — | — | — | — | — | <30 |
| Glucuronic Acid Conjugate (%) | — | — | — | — | — | — | 37 | |
| Specimen 3 | Total Urinary Concentration (ng/ml) | — | — | — | <54 | — | — | <30 |
| Glucuronic Acid Conjugate (%) | — | — | — | 100 | — | — | 5 | |
Total Urinary Concentration Determined After β-glucuronidase Treatment. —, Not Detected.
Quantitation results confirm that compounds 6 and 7 and compounds 13 and 14 were the primary urinary metabolites excreted after JWH-018 and JWH-073 use, respectively. Compounds 6 and 7 were excreted at concentrations 2 to 5 times higher than any of the other metabolites measured and appear to be specific for JWH-018 use. At this point, it is not clear whether humans can demethylate JWH-018 to produce JWH-073 and the corresponding oxidized metabolites or whether the subjects studied had a non-reported, prior exposure to JWH-073. These complications prevent identification of a specific biomarker representative of JWH-073 use at this point. However, there are number of other unidentified metabolites that were detected in human urine (Figures 6 and 7), and it is possible that these metabolites may have more utility for severing as specific, more sensitive biomarkers representative of JWH-018 or JWH-073 use. It is interesting to note that some of these metabolites do not appear to be glucuronidated, while others are predominately excreted as the glucuronic acid conjugates. One unknown metabolite co-eluted with Compound 6 and prevented accurate quantification. Manual integration was used to estimate concentrations of Compound 6.
CONCLUSION
This is the first report to use authentic hydroxylated AAI standards to quantify metabolic products of JWH-018 and JWH-073 excreted in human urine. Using β-glucuronidase for the quantitive analysis of glucuronides of these compounds also allowed glucuronide metabolites of these compounds to be identified in urine. The method is both precise and accurate and has applicability for most clinical and forensic laboratories evaluating urine specimens for AAI content. Further, this procedure provides the ability to begin linking clinical symptoms and toxicological profiles with specific use patterns and relative concentrations of primary and secondary metabolites of two common AAIs used in ‘K2’ and ‘SPICE’ products. Data suggest that compounds 6 and 7 can be used as specific biomarkers to indicate JWH-018 use. Potential human metabolic pathways leading to the demethylation of JWH-018 and formation of JWH-073 hinders the ability to identify specific biomarkers representative of JWH-073 use at this time. Larger population studies are necessary to confirm these initial finding, and complete validation of the assay presented in this study will help us to begin understanding the pharmacology of popular AAIs being used as recreational drugs.
Supplementary Material
ACKNOWLEDGEMENTS
This work was supported by a Centers for Disease Control Cooperative Agreement, 200-2007-21729 (JHM); a Bioterrorism Cooperative Agreement, U90/CCU616974-07 (JHM); a National Institutes of Health grant, R01-GM075893 (AR-P); and a Pilot Research Award from the University of Arkansas for Medical Sciences Center for Clinical and Translational Research, supported by a grant from the National Center For Research Resources, 1UL1RR029884. The authors would like to thank Jeff Lapoint, Robert S. Hoffman, and Lewis Nelson, from the Poison Control Centers in New York and Mae De La Calzada from the North Shore University Hospital in New Jersey for providing specimens. The authors would also like to thank Stacie M. Bratton and Kan Hui “Nicole” Yiew for performing the β-glucuronidase assays.
Footnotes
ASSOCIATED CONTENT
Supporting Information. Detailed NMR spectra about JHW-018 metabolite authentic standards (compounds 2–7) and JWH-073 metabolite authentic standards (compounds 9–14) are provided. This material is available free of charge via the Internet at http://pubs.acs.org.
REFERENCES
- 1.Gaoni YMR. Journal of the American Chemical Society. 1964;86:1646–1647. [Google Scholar]
- 2.Iversen LL. The Science of Marijuana. 2nd ed. New York: Oxford University Press, Inc.; 2008. [Google Scholar]
- 3.Whalen J. The Wall Street Journal. October 30 ed. New York, NY: 2010. http://online.wsj.com/article/SB10001424052748704763904575550200845267526.html. [Google Scholar]
- 4.Auwarter V, Dresen S, Weinmann W, Muller M, Putz M, Ferreiros N. Journal of Mass Spectrometry. 2009;44:832–837. doi: 10.1002/jms.1558. [DOI] [PubMed] [Google Scholar]
- 5.Steup C. 2008 [Google Scholar]
- 6.Huffman JW. In: The Cannabinoid Receptors, The Receptors. Reggio PH, editor. Vol. 1. Humana Press; 2009. pp. 49–94. [Google Scholar]
- 7.Lindigkeit R, Boehme A, Eiserloh I, Luebbecke M, Wiggermann M, Ernst L, Beuerle T. Forensic Science International. 2009;191:58–63. doi: 10.1016/j.forsciint.2009.06.008. [DOI] [PubMed] [Google Scholar]
- 8.EMCDDA, European Monitoring Centre for Drugs and Drug Addiction EMCDDA 2009 Thematic paper ed, editor. Office for Official Publications of the European Communities. 2009. pp. 1–25. [Google Scholar]
- 9.Hudson S, Ramsey J, King L, Timbers S, Maynard S, Dargan PI, Wood DM. Journal of Analytical Toxicology. 2010;34:252–260. doi: 10.1093/jat/34.5.252. [DOI] [PubMed] [Google Scholar]
- 10.Piggee C. Analytical Chemistry. 2009:3205–3207. doi: 10.1021/ac900564u. [DOI] [PubMed] [Google Scholar]
- 11.Uchiyama N, Kikura-Hanajiri R, Kawahara N, Haishima Y, Goda Y. Chemical and Pharmaceutical Bulletin. 2009;57:439–441. doi: 10.1248/cpb.57.439. [DOI] [PubMed] [Google Scholar]
- 12.Dresen S, Ferreiros N, Putz M, Westphal F, Zimmermann R, Auwarter V. Journal of Mass Spectrometry. 2010 doi: 10.1002/jms.1811. [DOI] [PubMed] [Google Scholar]
- 13.Vearrier D, Osterhoudt KC. Pediatric Emergency Care. 2010;26:462–465. doi: 10.1097/PEC.0b013e3181e4f416. [DOI] [PubMed] [Google Scholar]
- 14.Muller H, Sperling W, Kohrmann M, Huttner HB, Kornhuber J, Maler JM. Schizophrenia Research. 2010;118:309–310. doi: 10.1016/j.schres.2009.12.001. [DOI] [PubMed] [Google Scholar]
- 15.Every-Palmer S. Addiction. 2010;105:1859–1860. doi: 10.1111/j.1360-0443.2010.03119.x. [DOI] [PubMed] [Google Scholar]
- 16.Schneir AB, Cullen J, Ly BT. Journal of Emergency Medicine. 2010 [Google Scholar]
- 17.Teske J, Weller JP, Fieguth A, Rothamel T, Schulz Y, Troger HD. J Chromatogr B Analyt Technol Biomed Life Sci. 878:2659–2663. doi: 10.1016/j.jchromb.2010.03.016. [DOI] [PubMed] [Google Scholar]
- 18.Dresen S, Kneisel S, Weinmann W, Zimmermann R, Auwarter V. J Mass Spectrom. :163–171. doi: 10.1002/jms.1877. [DOI] [PubMed] [Google Scholar]
- 19.Sobolevsky T, Prasolov I, Rodchenkov G. Forensic Sci Int. 200:141–147. doi: 10.1016/j.forsciint.2010.04.003. [DOI] [PubMed] [Google Scholar]
- 20.Lapoint J, Nelson LS. Emergency Medicine. 2011:26–28. [Google Scholar]
- 21.21 CFR Part 1308. 2011;76:11075–11078. [Google Scholar]
Associated Data
This section collects any data citations, data availability statements, or supplementary materials included in this article.


