

Abstract
There is a need for objective imaging markers of Parkinson’s disease status and progression. Positron emission tomography and single photon emission computed tomography studies have suggested patterns of abnormal cerebral perfusion in Parkinson’s disease as potential functional biomarkers. This study aimed to identify an arterial spin labelling magnetic resonance-derived perfusion network as an accessible, non-invasive alternative. We used pseudo-continuous arterial spin labelling to measure cerebral grey matter perfusion in 61 subjects with Parkinson’s disease with a range of motor and cognitive impairment, including patients with dementia and 29 age- and sex-matched controls. Principal component analysis was used to derive a Parkinson’s disease-related perfusion network via logistic regression. Region of interest analysis of absolute perfusion values revealed that the Parkinson’s disease pattern was characterized by decreased perfusion in posterior parieto-occipital cortex, precuneus and cuneus, and middle frontal gyri compared with healthy controls. Perfusion was preserved in globus pallidus, putamen, anterior cingulate and post- and pre-central gyri. Both motor and cognitive statuses were significant factors related to network score. A network approach, supported by arterial spin labelling-derived absolute perfusion values may provide a readily accessible neuroimaging method to characterize and track progression of both motor and cognitive status in Parkinson’s disease.
Keywords: Parkinson’s disease, arterial spin labelling, magnetic resonance imaging, perfusion, network analysis, cognition
Introduction
Abnormal metabolic and perfusion patterns show potential as Parkinson’s disease biomarkers, to assess disease progression, modification and treatment response. Radiotracer studies (positron emission tomography, PET; single photon emission computed tomography, SPECT) have identified decreased cortical metabolism and perfusion in Parkinson’s disease (Vander Borght et al., 1997; Hosokai et al., 2009; Liepelt et al., 2009; Nobili et al., 2009). Some of these studies have described independent Parkinson’s disease motor- and cognitive-related patterns of abnormal metabolism/perfusion, reporting both cortical deficits and what have been interpreted as subcortical increases (Ma et al., 2007; Hsu et al., 2007; Huang et al., 2007a; Eidelberg, 2009).
Arterial spin labelling is a non-invasive MRI perfusion method that quantitatively measures cerebral blood flow per unit tissue mass (Detre et al., 1992). Arterial spin labelling eliminates expensive, potentially harmful radioactive materials, long preparation times and requires shorter scan times than radiotracer methods. It is an easily repeatable addition to routine MRI scanning that produces absolute perfusion images. Arterial spin labelling-derived biomarkers could thus provide an effective and safe alternative to radionuclide-based imaging assessments of Parkinson’s disease status and progress.
We examined 61 patients with Parkinson’s disease, representing a broad disease spectrum that included early, recently diagnosed individuals through to subjects showing dementia and severe motor impairment. Arterial spin labelling perfusion images from these patients with Parkinson’s disease and 29 controls were entered into a principal component analysis to identify Parkinson’s disease-related patterns of cerebral perfusion. Only one previous study has used arterial spin labelling to evaluate perfusion in Parkinson’s disease, but their analysis included only nine patients with Parkinson’s disease and was restricted to a pre-existing motor-related network that had previously been derived from PET data (Ma et al., 2010). The quantitative nature of arterial spin labelling enabled us to clarify questions concerning the interpretation of relative blood flow changes in Parkinson’s disease that have been described using PET and SPECT (Borghammer et al., 2009a, b, 2010).
Materials and methods
Subjects
Seventy-three participants meeting the UK Parkinson’s Disease Society’s criteria for idiopathic Parkinson’s disease (Hughes et al., 1992) were recruited from the Movement Disorders Clinic at the Van der Veer Institute for Parkinson’s and Brain Research, Christchurch, New Zealand. This convenience sample was selected to form a group reflecting the entire cognitive spectrum in Parkinson’s disease, including those with little or no impairment through to those with dementia. A neurologist specializing in movement disorders (T.J.A.) confirmed clinical diagnosis. The control group comprised 32 volunteers, matched for mean age, years of education and sex ratio; three volunteers were excluded due to abnormally low cognitive scores. Exclusion criteria included atypical parkinsonian disorder, previous history of other neurological conditions including moderate–severe head injury, stroke, learning disability, vascular dementia (Roman et al., 1993), other central nervous system disorder and major medical illness in the previous 6 months. Screening by a neuroradiologist (R.K.) excluded five subjects with Parkinson’s disease and two control subjects due to moderate–severe white matter disease (one control, four Parkinson’s disease), marked cerebral atrophy (one Parkinson’s disease) and cerebellar infarcts (one control). Four subjects with Parkinson’s disease were excluded due to motion-corrupted magnetic resonance images. A further four subjects (one control, three Parkinson’s disease) were excluded due to unfavourable head position in the scanner, leading to signal loss in the occipital lobes of the perfusion images. Subsequent analyses were conducted on the remaining 61 subjects with Parkinson’s disease and 29 control subjects. All subjects gave written consent with additional consent from a significant other when appropriate. The study was approved by the Upper South A Ethics Committee of the New Zealand Ministry of Health.
Diagnostic criteria and assessment
At the time of assessment, 26 subjects with Parkinson’s disease had not yet received anti-parkinsonian medication, i.e. were drug naïve. The remaining 35 participants with Parkinson’s disease were assessed and imaged after they had taken their usual medications. Disease severity was measured using the Unified Parkinson’s Disease Rating Scale (UPDRS part III for motor examination; Fahn and Elton, 1987). On the basis of comprehensive neuropsychological testing, patients with Parkinson’s disease were classified as cognitively normal (n = 34) with mild cognitive impairment (n = 16) or with dementia (n = 11, Dalrymple-Alford et al., 2010). Dementia classification was based on the Movement Disorders Society Task Force criteria (Dubois et al., 2007). Mild cognitive impairment cases were defined as having intact functional activities of daily living but scored 1.5 SDs or more below normative data on at least two measures in at least one of the four Movement Disorders Society cognitive domains (executive function; attention, working memory and speed of processing; memory and visuospatial/visuoperceptual function). Global cognitive status was measured with Mini Mental State Examination (Molloy and Standish, 1997) and the Montreal Cognitive Assessment (MoCA; Nasreddine et al., 2005). Demographical details are presented in Table 1.
Table 1.
Demographics, mental status and clinical assessments of study participants
| Controls | Parkinson’s disease with normal cognition | Parkinson’s disease with mild cognitive impairment | Parkinson’s disease with dementia | |
|---|---|---|---|---|
| n | 29 | 34 | 16 | 11 |
| Female:male | 9:20 | 12:22 | 5:11 | 2:9 |
| Age, years* | 68.7 (9.4); 45–79 | 64.7 (8.6); 21–30 | 69.8 (9.1); 48–80 | 75.1 (6.7); 59–84 |
| Education, years | 13.5 (2.8); 10–18 | 14.2 (3.2); 10–19 | 12.6 (3.2); 8–19 | 13.5 (2.6); 10–17 |
| MoCA** | 27.1 (2.0); 23–30 | 26.4 (2.5); 21–30 | 22.4 (2.4); 18–26 | 16.1 (3.3); 11–20 |
| MMSE** | 29.1 (1.0); 27–30 | 28.8 (1.4); 25–30 | 27.6 (1.7); 24–30 | 23.9 (3.0); 18–27 |
| Disease duration, years*** | – | 3.3 (2.8); 1–14 | 8.8 (7.5); 1–29 | 12.2 (8.9); 1–30 |
| UPDRS-III*** | – | 23.7 (13.6); 3–62 | 38.6 (19.2); 13–74 | 50.2 (17.8); 18–81 |
| Hoehn and Yahr | – | median 1.5; 1–3 | 2.5; 1.5–4 | 4; 2–4 |
Values are mean (SD); range. Significant ANOVA across all groups *P < 0.01, **P < 0.001; significant ANOVA across Parkinson’s disease groups ***P < 0.001.
MMSE = Mini Mental State Examination.
Magnetic resonance imaging acquisition
All subjects were imaged using a 3 T General Electric HDx scanner with an eight channel head coil. The protocol included a T1-weighted, 3D spoiled gradient recalled acquisition (echo time = 2.8 ms, repetition time = 6.6 ms, inversion time = 400 ms, flip angle = 15°, acquisition matrix = 256 × 256 × 170, field of view = 250 mm, slice thickness = 1 mm, voxel size = 0.98 × 0.98 × 1.0 mm3). A stack of spiral, fast spin echo acquired images were prepared with pseudo-continuous arterial spin labelling and background suppression to measure whole brain perfusion quantitatively (Dai et al., 2008; repetition time = 6 s, echo spacing 9.2 ms, post-labelling delay = 1.5 s, labelling duration = 1.5 s, eight interleaved spiral arms with 512 samples at 62.5 kHz bandwidth and 30 phase encoded 5 mm thick slices, NEX = 5, total scan time = 8 min 11 s, units: ml/100 g/min). Subjects were instructed to close their eyes and remain as still as possible during scanning.
Magnetic resonance imaging data preprocessing
All images were preprocessed with SPM5 (Wellcome Department of Cognitive Neurology, University College London, UK) and custom scripts in MATLAB (Matlab 7.6.0, R2008a, Mathworks, MA, USA). Image preprocessing proceeded as follows: (i) each subject’s arterial spin labelling-derived perfusion map was coregistered to the spoiled gradient recalled image; (ii) the spoiled gradient recalled image was segmented (Ashburner and Friston, 2005) using tissue priors from a probabilistic elderly brain template (Lemaître et al., 2005). Grey matter images were concurrently normalized and modulated; (iii) normalization parameters produced during segmentation were then used to warp the perfusion images into the standardized space of the elderly template; (iv) normalized (unmodulated) perfusion images were resliced to 2 × 2 × 2 mm3 and smoothed using a 10 mm isotropic Gaussian kernel and (v) image slices inferior to the mid-cerebellum contained spiral artefacts and values in this region were set to zero.
A study-specific grey matter mask, used to exclude non-grey matter contributions in subsequent analyses, was created by averaging the modulated, normalized grey matter images from 30 Parkinson’s disease (10 normal, 10 mild cognitive impairment and 10 dementia) and 29 control subjects. Approximately equal numbers were used to reduce potential bias. Global grey matter perfusion was examined prior to network analysis using ANOVA.
Principal component analysis
We employed a voxel-based principal component analysis to identify sources of grey matter perfusion variation in our sample, blinded to patient status. Principal component analysis is a data-driven technique that enables the unbiased detection of spatial covariance patterns (Turk and Pentland, 1991) and has been used widely in imaging studies of neurological diseases (Ma et al., 2007; Asllani et al., 2007; Huang et al., 2007b). The in-house principal component analysis was implemented following a method described by Spetsieris et al. (2009): (i) the study-specific grey matter mask was applied to all perfusion images; voxels with <10% chance of being grey matter were excluded. Image data were log transformed, de-meaned twice (individual subject mean and group voxel-by-voxel mean were subtracted) and entered into a single principal component analysis; (ii) the eigenvectors and eigenvalues of the input data covariance matrix were calculated via principal component analysis. Statistically independent, spatially static principal component images were calculated using scaled eigenvectors, where each eigenvector was divided by the square root of its associated eigenvalue, yielding components with unit variance. The inverse scaled eigenvectors indicate the expression or score of each component in each individual. The relative size of each eigenvalue quantifies the total variance captured by that component, with the first principal component accounting for the most variance, and each subsequent component, progressively less. A higher score on a particular principal component indicates a greater expression of that spatially fixed component. Voxel values comprising each principal component are referred to as ‘loadings’ and can be either positive or negative and (iii) the number of components selected for further analysis was based on the position of the first discontinuity in the scree plot of the eigenvalues (Alexander and Moeller, 1994).
Characteristic Parkinson’s disease-related perfusion network identification and validation
We performed backward stepwise binomial logistic regression with group (Parkinson’s disease/control) as the dependent variable and the expression of the retained components as independent variables. We selected the model resulting in the smallest Akaike Information Criterion, which optimally distinguished the groups (Hastie et al., 2009). Principal components remaining in the model were considered disease-related and used in linear combination (applying the coefficients from the logistic regression) to create a combined Parkinson’s disease-related perfusion network, which was then z-scored. The expression of the pattern in each individual (that person’s network score) was quantified by applying the same linear combination of model parameters to the disease-related principal component scores. This measure was standardized by subtracting the global mean and dividing by the SD, and then subtracting the standardized control mean from all scores; this set the baseline expression (control mean) to zero (Spetsieris et al., 2009). Leave-one-out cross-validation was performed to assess the ability of the network score to discriminate Parkinson’s disease subjects from controls (Hastie et al., 2009). In the Parkinson’s disease group, measures of disease severity (UPDRS-III), disease duration, age, sex and global cognitive score (MoCA) were entered into multiple linear regression with the network score as the dependent variable. Variables with P < 0.05 were considered to be related to network score.
Network reliability
A bootstrap estimation procedure (Efron and Tibshirani, 1993) was used to assess the reliability of the spatial extent of the characteristic Parkinson’s disease-related network. Principal component analysis of resampled data produced one bootstrapped Parkinson’s disease-related network for each of the 500 resamplings. Voxel loadings of the bootstrapped networks were used to approximate the SD of the resampled population, sboot. We calculated a z-score (Asllani et al., 2007) for each voxel using z = v/sboot, where v is the voxel value from the original Parkinson’s disease perfusion network. A threshold of |z| > 1.96, corresponding to a two-tailed P < 0.05, was used to identify voxels that significantly contributed to the Parkinson’s disease-related network.
Region of interest analysis
Region of interest analysis was performed in order to describe the characteristic Parkinson’s disease-related pattern in terms of absolute perfusion. Non-smoothed, absolute perfusion values were extracted from regions comprising the network in which one region contained voxels with significant positive loadings (z ≥ 1.96) and a second contained significant negative loadings (z ≤ −1.96). The absolute perfusion values of the remaining voxels (small loadings not meeting the statistical threshold used to create the network; − 1.96 < z < 1.96) were also examined. Mean absolute perfusion difference between Parkinson’s disease and control groups in each of the three regions was assessed using 95% confidence intervals (95% CIs) of the difference between means. Absolute perfusion from each of the three regions was investigated using multiple linear regression with age, sex, disease duration, MoCA and UPDRS-III.
Classification
We used area under the curve from receiver operating characteristic analysis to assess how well the characteristic Parkinson’s disease network, the individual principal components and global grey matter perfusion distinguished between the different Parkinson’s disease cognitive groups.
Results
Global grey matter perfusion
A two-way ANOVA (Group × sex) revealed a significant difference in global grey matter perfusion between groups (F = 5.64, P = 0.02). The Parkinson’s disease group exhibited reduced perfusion with 39.2 (SD 7.46) compared with 43.3 (7.50) ml/100 g/min in controls [effect size = 0.55; 95% CI of the difference: 4.09 (95% CI 0.69–7.50) ml/100 g/min]. Receiver operating characteristic analysis of Parkinson’s disease versus controls revealed an area under the curve of 0.66. There was no evidence of a main effect of sex (P = 0.21) or interaction between group and sex (P = 0.73). Neither age [r = 0.084, P = 0.43, 95% CI ( − 0.11 to 0.24)] nor global cognitive status [MoCA, r = 0.19, P = 0.08, 95% CI (−0.04 to 0.70)] correlated with global grey matter perfusion. Multiple linear regression including age, sex, disease duration, MoCA and UPDRS-III showed no significant prediction of grey matter perfusion in the Parkinson’s disease group (R2 = 0.04, P = 0.8). Cognition as measured by MoCA significantly correlated with motor impairment (UPDRS-III; r = 0.46, P < 0.001, 95% CI 0.9–2.8).
Principal components
The first six principal components were selected for further investigation. Principal components 1, 4, 5 and 6, explaining 21.0, 4.4, 4.0 and 3.2% of the variance, respectively, remained significant predictors of group (Parkinson’s disease versus controls; Fig. 1A–D). Components 2 and 3, explaining 11.4 and 5.8%, were not related to group status. Separate multiple linear regressions using age, sex, disease duration, MoCA and UPDRS-III revealed the following significant predictors (P < 0.05) for each of the individual disease-related components in Parkinson’s disease: principal component 1, MoCA and age (adjusted R2 = 0.22, βMoCA = 0.29, βage = −0.29); principal component 4, no significant predictors; principle component 5, UPDRS-III (adjusted R2 = 0.13, βUPDRS = 0.38); and principle component 6, UPDRS-III, MoCA and age (adjusted R2 = 0.21, βUPDRS = −0.40, βMoCA = 0.27, βage = 0.22). Continuous variables failed to predict principle component 4, but it did capture disease-related information in that it significantly contributed to the discrimination of Parkinson’s disease and controls via logistic regression. The first component (Fig. 1A) was characterized by decreased perfusion in Parkinson’s disease relative to controls in posterior parieto-occipital regions, middle and superior frontal gyri (Brodmann areas 6 and 8), dorsolateral prefrontal cortex and pre- and post-central gyri, and preserved perfusion in anterior cingulate. Principle component 4 (Fig. 1B) exhibited decreased perfusion in the lingual gyrus, caudate, thalamus and anterior septal region, with preserved perfusion in anterior cingulate and pre- and post-central gyri. Principle component 5 (Fig. 1C) showed decreased perfusion in left precuneus, cuneus, middle and inferior frontal gyri and supramarginal gyri, with associated preservation in right post-central gyrus, and subcortically including brainstem, caudate and putamen. Principle component 6 (Fig. 1D) revealed decreased perfusion in right posterior parietal regions with preserved perfusion in left pre- and post-central gyri.
Figure 1.

Parkinson’s disease-related principal components, displayed on the study-specific average grey matter image. Black regions represent masked white matter and CSF. (A) Principal component 1 showed decreased perfusion (blue) in subjects with Parkinson’s disease relative to controls in posterior parieto-occipital regions, middle and superior frontal gyri (Broadmann areas 6 and 8), and post-central gyri, and preserved perfusion in anterior cingulate (red). Component 1 was significantly related to cognition (MoCA) and age. (B) Principal component 4 exhibited decreased perfusion primarily in the caudate and thalamus, with preferentially preserved perfusion in anterior cingulate, pre- and post-central gyri, lateral temporal and inferior occipital regions. (C) Principal component 5 showed decreased perfusion in left precuneus, cuneus, middle and inferior frontal gyri, frontal pole and operculum, and supramarginal gyri, with associated preservation in right post-central gyrus and subcortically including brainstem, caudate and putamen. Component 5 was significantly related to motor impairment (UPDRS-III). (D) Principal component 6 revealed large decreases in posterior parietal regions, precuneus, lateral occipital regions and middle frontal gyrus, with preserved perfusion in pre- and post-central gyri. Component 6 was significantly related to both motor and cognitive status. Components 2 and 3 were not related to Parkinson’s disease.
Characteristic Parkinson’s disease-related network
A linear combination of disease-related components (1, 4, 5 and 6; β = −2.67, 1.38, 1.80, −2.35), was used to form the characteristic Parkinson’s disease-related perfusion network. The sign of the characteristic Parkinson’s disease-related perfusion network was defined such that subjects with Parkinson’s disease showed increased mean expression compared with controls. This network (Fig. 2A) was characterized by positive loadings in Parkinson’s disease in comparison to controls in bilateral globus pallidus and putamen, anterior cingulate and post- and pre-central gyri (extending from primary somatosensory cortex to primary and supplementary motor cortices). Significant negative loadings occurred in posterior parieto-occipital cortex, posterior medial cortex (precuneus and cuneus) and middle frontal gyri (dorsolateral prefrontal cortex, Brodmann areas 8 and 9). Receiver operating characteristic analysis of the raw network score produced an area under the curve of 0.82. Leave-one-out cross validation showed a Parkinson’s disease versus control classification accuracy of 66.7% (cross-validated area under the curve = 0.72; Parkinson’s disease prediction: 40/61, control prediction: 20/29). Multiple linear regression with age, sex, disease duration, MoCA and UPDRS-III [adjusted R2 = 0.41, F (5, 55) = 9.31, P < 0.001] identified MoCA (P = 0.001, β = −0.47) and UPDRS-III (P < 0.05, β = 0.26) as significant factors related to network score (Fig. 3A–C).
Figure 2.

Parkinson’s disease-related perfusion network and associated absolute values. (A) Parkinson’s disease-related perfusion network as identified by principal component analysis of arterial spin labelling MRI. The spatial covariance network was identified from 61 subjects with Parkinson’s disease and 29 controls and represents regions shown to be robust through bootstrap resampling (|z| > 1.96; P < 0.05). Decreased perfusion (blue, significant negative loadings) was most prominent in parieto-occipital cortex, cuneus, precuneus and middle frontal gyri (Brodmann areas 8 and 9). Unchanged perfusion (red, significant positive loadings) was present in bilateral globus pallidus, putamen, anterior cingulate, primary sensorimotor and supplementary motor areas. The remaining regions (grey) showed widespread, slight perfusion deficits. (B) The difference in mean absolute perfusion between Parkinson’s disease and control groups in the three coloured regions of Fig. 1A (with 95% CI). Red corresponds to regions of positive loadings in the Parkinson’s disease-related perfusion network, showing no absolute difference between groups (i.e. the 95% CI includes zero). Grey regions of the pattern with small loadings revealed significant absolute decreases in the Parkinson’s disease group. Blue represents voxels with significant negative loadings, associated with the strongest levels of decreased perfusion.
Figure 3.
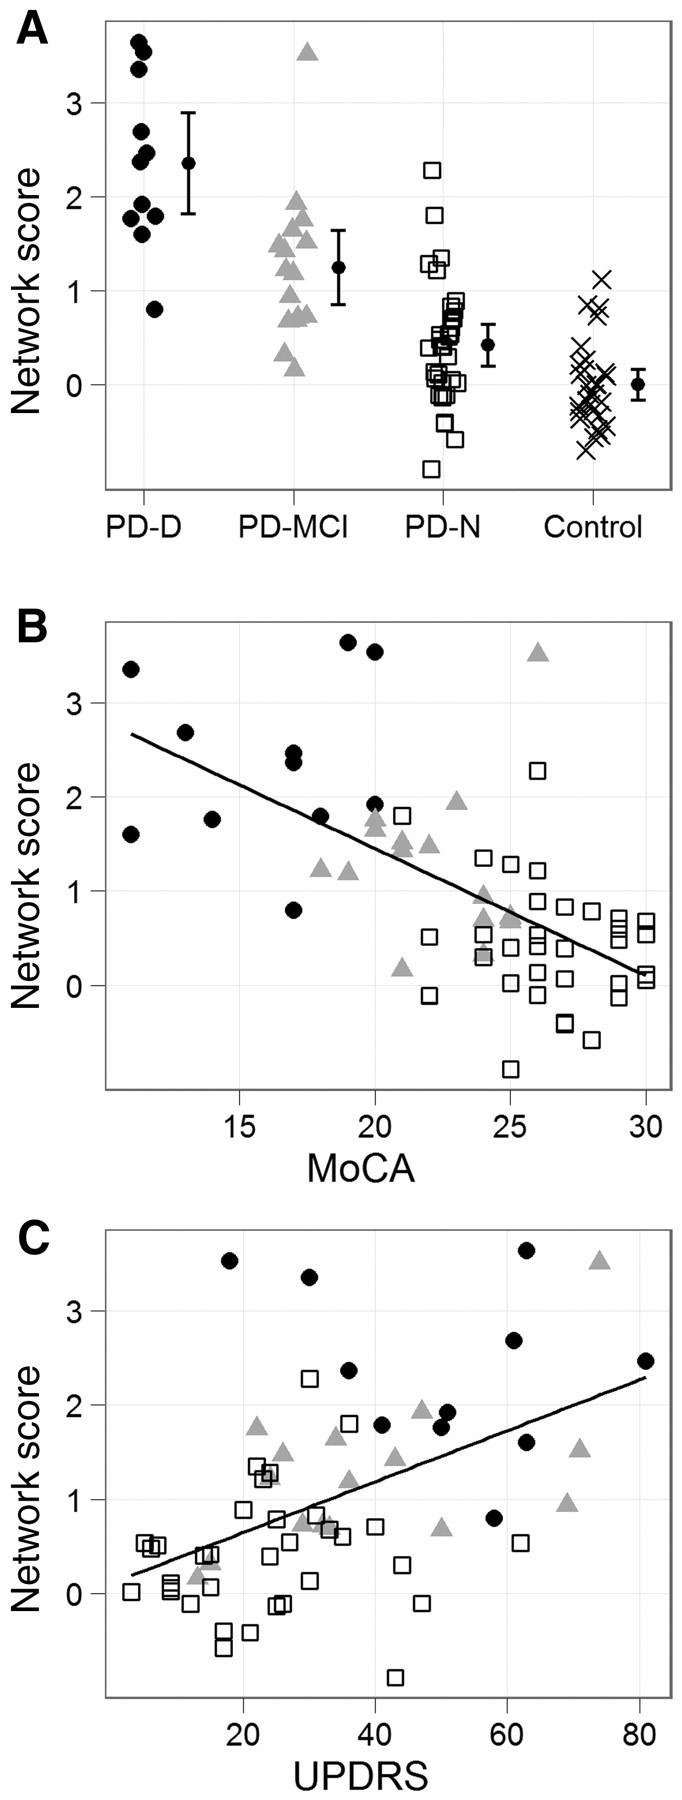
Network score in relation to cognition and motor impairment. (A) Network score by cognitive group, with 95% CI of the mean. Filled circles represent Parkinson’s disease with dementia (PD-D); grey triangles, Parkinson’s disease with mild cognitive impairment (PD-MCI); open squares, Parkinson’s disease with normal cognition (PD-N); and crosses, controls. Score increased monotonically from controls through subjects with Parkinson’s disease with normal cognition and Parkinson’s disease with mild cognitive impairment, with Parkinson’s disease with dementia exhibiting the highest value. Mean of the controls was set to zero. (B) Network score versus MoCA in Parkinson’s disease (r = −0.61, P < 0.001, slope = −0.135 network score/MoCA point) showing increased network score with decreasing global cognitive status. (C) Network score versus UPDRS-III (motor score) in Parkinson’s disease (r = 0.49, P < 0.001, slope = 0.027 network score/UPDRS-III point) depicting increased network score with more severe motor impairment.
Classification
Table 2 presents the area under the curve from receiver operating characteristic analysis of the characteristic Parkinson’s disease-related pattern scores, the individual principal component scores and global grey matter perfusion. The characteristic Parkinson’s disease network produced the largest (or equal) area under the curve compared with all individual components and global perfusion, therefore exhibiting superior discrimination between the various groups. Area under the curve values from the characteristic network were as follows: Control:Parkinson's disease with normal cognition (0.71), Control:Parkinson’s disease mild cognitive impairment (0.94), Control:Parkinson’s disease dementia (0.99), Parkinson's disease with normal cognition:Parkinson’s disease mild cognitive impairment (0.82), Parkinson’s disease mild cognitive impairment:Parkinson’s disease dementia (0.86), Parkinson’s disease with normal cognition:Parkinson's disease dementia (0.96).
Table 2.
Area under the curve for the different group classifications
| Pattern | Control vs Parkinson's with normal cognition | Control vs Parkinson’s disease with mild cognitive impairment | Control vs Parkinson’s disease with dementia | Parkinson's disease with normal cognition vs Parkinson’s disease with mild cognitive impairment | Parkinson's disease with normal cognition vs Parkinson’s disease with dementia | Parkinson’s disease with mild cognitive impairment vs Parkinson’s disease with dementia |
|---|---|---|---|---|---|---|
| Unified Parkinson’s disease | 0.71a | 0.94a | 0.99a | 0.82a | 0.96a | 0.86a |
| Principle component 1 | 0.60 | 0.77a | 0.90a | 0.70a | 0.89a | 0.72a |
| Principle component 2 | 0.60 | 0.54 | 0.53 | 0.57 | 0.59 | 0.50 |
| Principle component 3 | 0.60 | 0.56 | 0.50 | 0.46 | 0.56 | 0.54 |
| Principle component 4 | 0.59 | 0.74a | 0.70a | 0.73a | 0.60 | 0.58 |
| Principle component 5 | 0.56 | 0.59 | 0.82a | 0.48 | 0.78a | 0.77a |
| Principle component 6 | 0.59 | 0.69a | 0.81a | 0.61 | 0.75a | 0.65 |
| Grey matter mean | 0.60 | 0.72a | 0.78a | 0.67a | 0.74a | 0.51 |
Comparisons are based on the scores from the single network, individual components and global grey matter mean perfusion. The unified Parkinson’s disease network provided superior differentiation between all groups.
aIndicates statistically greater than chance (area under curve = 0.05).
Region of interest analysis
Figure 2B shows the difference in mean absolute perfusion between the Parkinson’s disease and control groups in the three investigated regions (Fig. 2A). Subjects with Parkinson’s disease showed no evidence of altered absolute perfusion compared with controls in regions of positive loadings, i.e. perfusion was unchanged or preserved [effect size d = 0.15, 95% CI of the difference between means: 1.1 (95% CI −2.0 to 4.2) ml/100 g/min]. Perfusion values from the region of small loadings not meeting the statistical threshold for network inclusion indicated significantly decreased absolute perfusion in the Parkinson’s disease group [d = 0.55, −4.1 (95% CI −7.5 −0.7) ml/100 g/min], while in regions of significant negative loadings there was an even greater decrease [d = 0.89, −8.7 (95% CI −13.1 to −4.4) ml/100 g/min]. Multiple linear regression with age, sex, disease duration, MoCA and UPDRS-III revealed no significant relation to absolute perfusion in areas of positive network loadings or small loadings not meeting the statistical threshold. Absolute perfusion in regions of negative network loadings was related to MoCA (adjusted R2 = 0.16, P = 0.001, β = 0.41), but no other variables.
Discussion
This study has established a characteristic Parkinson’s disease-related perfusion network derived via arterial spin labelling MRI and principal component analysis. This characteristic pattern optimally described our heterogeneous Parkinson’s population. Region of interest analysis of absolute perfusion revealed large decreases in parieto-occipital cortex, cuneus, precuneus and middle frontal gyri (dorsolateral prefrontal cortex, Brodmann areas 8 and 9), with smaller decreases in further cortical regions (parieto-occipital, frontal, temporal) and subcortically (thalamus, caudate). Preserved perfusion was found in bilateral globus pallidus, putamen, anterior cingulate and pre- and post-central gyri (primary sensorimotor and supplementary motor cortices).
Global grey matter perfusion was significantly reduced in the Parkinson’s disease group, but performed less well as a classifier (smaller area under the curve) than the cross-validated Parkinson’s disease network, and showed no significant relationship to cognitive or motor status in Parkinson’s disease. Multiple linear regression identified only cognition as a significant predictor of absolute perfusion in regions of significant negative loadings; clinical and demographical variables did not predict absolute perfusion in any other region. Conversely, cognitively impaired patients and those with greater motor disability had increased network scores (i.e. they expressed the spatial unified Parkinson’s disease network more strongly), highlighting its potential use as a global marker of overall impairment and the advantage of a network approach in Parkinson’s disease.
Network interpretation
Detection of networks using principal component analysis (Eidelberg, 2009) involves subtracting each subject’s global mean perfusion value and the overall group mean (voxel-by-voxel) from the original images to produce data centred on a mean of zero. If the global perfusion mean is systematically reduced in a particular group, the subtraction can lead to areas of unchanged perfusion being represented by positive loadings, which may then be interpreted incorrectly as regions of increased perfusion relative to another group (Borghammer et al., 2008, 2009a, b). This phenomenon was present in our sample, where there was reduced absolute grey matter perfusion in the Parkinson’s disease group. Borghammer et al. (2009b) have described how so-called increases can arise from a shift of baseline, where regions with preserved perfusion are interpreted as increased perfusion, regions with slightly reduced perfusion are interpreted as unchanged and strongly decreased perfusion is interpreted as only slightly reduced.
Using arterial spin labelling-derived absolute perfusion values, we could circumvent this interpretation problem by directly investigating the physiological meaning of the identified network. Areas of significant positive network loadings (red regions in Fig. 2A) showed no evidence of absolute perfusion difference (Fig. 2B), while regions of significant negative network loadings (blue) exhibited large perfusion deficits. Voxels with small loadings, not meeting the statistical threshold for network inclusion (grey areas) also exhibited significantly reduced perfusion in Parkinson’s disease. To date, studies employing network analysis and PET or SPECT (Ma et al., 2007; Huang et al., 2007b; Poston and Eidelberg, 2009) have not investigated the resultant patterns with absolute, quantitative values. In our study, areas of significant positive network loadings (that would previously have been interpreted by others as increases) actually indicated unchanged perfusion. Hence, cerebral perfusion changes in Parkinson’s disease are most aptly interpreted as an overall decrease in grey matter perfusion, with regions of particularly intense hypoperfusion (blue areas in Fig. 2A) and regions of spared/preserved perfusion in the lentiform nucleus, anterior cingulate, primary sensorimotor and supplementary motor areas (red regions). This is displayed in Table 3. Based on absolute perfusion, our findings of widespread cortical hypoperfusion with no areas of increase are consistent with metabolic/perfusion studies employing quantitative radiotracer imaging modalities (Hu et al., 2000; Berding et al., 2001; Mito et al., 2005), as well as those employing relative PET and SPECT normalized to the cerebellum or pons, rather than the global mean (Vander Borght et al., 1997; Firbank et al., 2003; Hosokai et al., 2009; Liepelt et al., 2009). Although systematic group differences can introduce bias (Scarmeas et al., 2004; Borghammer et al., 2009a), network analysis remains a powerful tool for the investigation of neurodegenerative diseases like Parkinson’s disease (Alexander and Moeller, 1994; Moeller and Habeck, 2006) if absolute perfusion is assessed.
Table 3.
Interpretation of the characteristic Parkinson’s disease-related perfusion network
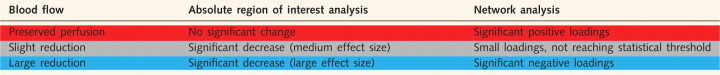 |
The table describes blood flow in Parkinson’s disease based on absolute, arterial spin labelling-derived perfusion and network analysis. The first column describes blood flow status in Parkinson’s disease in the red, grey and blue regions of Fig. 2A. The absolute region of interest analysis column describes the state of perfusion when tested using absolute arterial spin labelling-derived perfusion, while the third column describes these three regions relatively, in terms of loadings derived from network analysis. Our interpretation of the identified characteristic Parkinson’s disease-related pattern is informed by these absolute perfusion values.
Single versus multiple patterns
Prior to this study, Parkinson’s disease network investigations have utilized PET and SPECT radiotracer methods to identify separate motor and cognitive patterns (Poston and Eidelberg, 2009). It might be expected then that MRI perfusion imaging, as employed in the present study, should reveal similar patterns. We did not identify one component relating to motor impairment and one component relating exclusively to cognition. Rather, we identified one ‘motor’ component, one ‘cognitive and age’ component and a combined ‘motor and cognitive’ component. Consequently, we did not endeavour to identify independent and distinct motor and cognitive patterns. Instead, all disease-related components were used to create a single characteristic Parkinson’s disease-related network to describe overall grey matter perfusion in Parkinson’s disease. We specifically included participants across the full range of cognitive impairments associated with Parkinson’s disease (including those with dementia), in order to accurately portray the full spectrum of impairment. Those with greater motor disability tended to experience greater cognitive impairment, as might be expected (Verbaan et al., 2007; Aarsland et al., 2010). This may explain why we did not identify independent motor and cognitive patterns, but when we excluded the Parkinson’s disease dementia group and reran the principal component analysis in an attempt to identify separate patterns, we identified one component related to both motor and sex. In this post hoc analysis, we failed to identify a component in which cognition was a significant predictor despite the presence of individuals with mild cognitive impairment. Therefore the inclusion of those with dementia had a potentially large influence on the results. The present findings are at odds with network analysis literature employing radiotracer methods (Eidelberg, 2009). The characteristic network, derived from combining multiple principal components, explained more disease-related variance than a single component. Although unable to reflect motor and cognitive deterioration independently, the characteristic network correlated with both motor and cognitive status and provided superior group classification compared with individual components.
The first component in principal component analysis captures the most variance within the dataset, and each subsequent component, progressively less. A linear combination of Components 1, 4, 5 and 6 predicted disease status and collectively explained 32.6% of the variance in the data. Ma et al. (2007) employed network analysis of radiotracer data to identify a Parkinson’s disease-related motor pattern. The first component (capturing 21% of subject × voxel variance) correlated with motor impairment and was therefore called the motor-related pattern. In contrast, our characteristic Parkinson’s disease-related pattern was formed as a linear combination of four components and although Components 4, 5 and 6 explained less variance than component 1, they still contributed important disease-related information. Our first component (which also explained 21% of the variance) was related to both cognition and age in both Parkinson’s disease and the entire sample, but not to motor disability in the Parkinson’s disease group. The relationship between the first component and cognition and age was not significant in the control group, indicating that the Parkinson’s disease group may be driving this association or may reflect the restricted range of control participant cognitive scores. Cerebral blood flow decreases with age (Buijs et al., 1998), so it is unsurprising that this first component also correlated with age. Perfusion reductions in posterior parietal and frontal regions (Firbank et al., 2003; Kasama et al., 2005) have been associated with cognitive decline in Parkinson’s disease, and are also evident in the first component (Fig. 1A). In this Parkinson’s disease sample, a larger portion of the variation was related to cognition and age than motor impairment, emphasizing the relationship between blood flow and cognitive decline in Parkinson’s disease.
Component 4, with decreased flow in caudate and thalamus, showed no relation to the clinical or neuropsychological measures tested in the Parkinson’s disease group or the entire sample, but did contribute to the group discrimination. Motor disability (UPDRS-III) was the only significant predictor of principle component 5, and it could therefore be considered in itself a motor-related pattern. This single component was not, however, the only one related to motor disability, as principle component 6 was also related. The asymmetries present in principle component 5 (mildly decreased on left, preserved on right) did not correspond to side most affected by Parkinson’s disease symptoms. Precuneus hypoperfusion and positive loadings in the globus pallidus and putamen observed in our motor-related principle component 5 have been identified in previous radiotracer motor patterns, but our principle component 5 lacked involvement of the typical motor cortex involvement identified by Ma et al. (2007). Principle component 6 showed evidence of abnormal perfusion in areas associated with both cognitive and motor impairment. The decreased perfusion in posterior parietal and occipital regions in principle component 6 is consistent with regions previously related to cognition, but this component lacked medial frontal decreases shown to be involved in cognition (Firbank et al., 2003; Osaki et al., 2005; Nobili et al., 2009) and dentate increases reported in previously defined cognitive patterns (Huang et al., 2007a). Unchanged (that would previously have been interpreted by others as increased) perfusion in primary and supplementary motor areas is also consistent with areas comprising a previously identified motor pattern (Eckert et al., 2007).
The characteristic Parkinson’s disease-related network score as a putative biomarker
Multiple regression confirmed MoCA and UPDRS-III to be significant predictors of network score. This is not unexpected since both correlate during Parkinson’s disease progression (Verbaan et al., 2007; Aarsland et al., 2010) and disease-related components sensitive to both measures were used to create the network. Posterior cortical dysfunction has been cited as the most prominent metabolic imaging abnormality associated with cognitive deterioration in Parkinson’s disease (Mentis et al., 2002; Firbank et al., 2003; Nobili et al., 2009). The association between cognitive status and decreased perfusion in posterior cortical areas of the network is consistent with the observations of hypoperfusion in these regions by others (Firbank et al., 2003; Liepelt et al., 2009). Motor disability, in the present study, was also associated with the Parkinson’s disease network, albeit to a lesser extent than cognitive impairment. Both frontal and posterior deficits contributing to the network have previously been identified in motor-related radiotracer patterns (Eidelberg, 2009).
The characteristic Parkinson’s disease network provided superior discrimination between the cognitive groups, as measured by area under the curve, than individual disease-related components and global grey matter perfusion (Table 2). This network exhibited robust sensitivity in distinguishing even those with the mildest symptoms (Parkinson's disease with normal cognition) from healthy individuals (area under the curve = 0.72). Network score was also better at differentiating between those with normal cognition and those with mild cognitive impairment (area under the curve = 0.81). This is potentially a very pertinent comparison, as the Parkinson’s disease mild cognitive impairment group represents those at risk for dementia and likely to benefit most from any emergent disease-modifying therapies (Caviness et al., 2007).
The direct effect of anti-parkinsonian medication on cerebral perfusion and the characteristic pattern in this study is unknown because all medicated patients were assessed and imaged with no disruption to their normal drug regimen and the 26 drug naïve subjects were assessed and imaged before commencing anti-parkinsonian drug therapy. Although global cerebral blood flow does not change as a result of anti-parkinsonian medication (Melamed et al., 1986; Jenkins et al., 1992; Hershey et al., 2003; Hirano et al., 2008), focal blood flow increases have been identified in putamen, globus pallidus, thalamus, pons, midbrain, subthalamic nucleus and anterior cingulate (Kobari et al., 1995; Hershey et al., 2003; Hirano et al., 2008). In the context of PET-derived network analysis, Hirano et al. (2008) identified an increase in the expression of a perfusion Parkinson’s disease-related motor pattern after intravenous levodopa administration. Conversely, Hershey et al. (2003) described a difference between levodopa-naïve Parkinson’s disease and those with chronic levodopa use. Those naïve to levodopa exhibited no change in cerebral blood flow post administration, while those with a history of levodopa exposure showed decreased blood flow in sensorimotor and ventrolateral prefrontal cortices. These characteristic levodopa-induced changes in cerebral blood flow may have had an influence on our identified network, but in those areas previously reported to exhibit drug-related increases we identified unchanged rather than increased perfusion in Parkinson’s disease. Furthermore, in a post hoc comparison between drug naïve Parkinson's disease with normal cognition (n = 23) and Parkinson's disease with normal cognition on medication (n = 11) from areas with positive loadings (i.e. preserved perfusion, red region in Fig. 2A; including putamen and globus pallidus), we identified no significant difference between the two groups [t = 1.0, P = 0.3; d = 0.35, 95% CI 2.54 (−8.2 to 3.1) ml/100 g/min]. There was no significant difference between drug-naïve and medicated Parkinson's disease with normal cognition in terms of network score [t = 1.15, P = 0.26; d = 0.40; 95% CI 0.2 (−0.26 to 0.8)]. Hershey et al. (2003) reported a 3% and 1.8% blood flow reduction due to levodopa in sensorimotor and ventrolateral prefrontal cortex, respectively, whereas in the present study Parkinson’s disease subjects exhibited a much greater 19% average reduction in cerebral perfusion in the blue pattern region compared with controls. Thus, it seems unlikely that the maintenance of anti-parkinsonian therapy on the day of imaging in our patients had a significant influence on the Parkinson’s disease perfusion network.
Arterial spin labelling networks
This is the first sizeable study to derive a Parkinson’s disease-related pattern using arterial spin labelling MRI. Ma et al. (2010) collected arterial spin labelling perfusion in nine Parkinson’s disease subjects, but only utilized a pattern previously derived from PET data. Validation of our characteristic Parkinson’s disease perfusion network in other cohorts collected independently with arterial spin labelling perfusion MRI would be beneficial. This would help to clarify whether a single, inclusive pattern provides the best biomarker across the full spectrum of Parkinson’s disease or whether truly independent motor and cognitive patterns arise from arterial spin labelling-acquired perfusion images. The present investigation was cross-sectional and a longitudinal study is now needed to validate the characteristic Parkinson’s disease perfusion network as a suitable marker of disease progression.
In summary, we established a characteristic Parkinson’s disease-related perfusion network via arterial spin labelling. This network was characterized by decreased cortical and preserved subcortical and sensorimotor cortical perfusion. This non-invasive, arterial spin labelling-derived network may provide clinicians and researchers with an attractive alternative to radiotracer methods in terms of safety, availability, repeatability, cost and effectiveness without sacrificing quality of results, while also providing absolute perfusion values. Arterial spin labelling acquisition is preferable on a 3 T MRI scanner because of higher signal to noise, but implementation on 1.5 T machines is certainly feasible (Alsop et al., 2000). Though the deployment of 3 T MRI scanners is becoming commonplace worldwide, the implementation of arterial spin labelling on 1.5 T machines would permit more widespread application of this useful technique and utilization of Parkinson’s disease perfusion networks if the present findings can be replicated. This characteristic network offers an easily applicable biomarker that may prove useful for future longitudinal investigations and assessment of Parkinson’s disease progression, but as we have shown, physiological understanding requires careful interpretation informed by absolute perfusion data.
Funding
This work was supported by the Neurological Foundation of New Zealand and the Canterbury Medical Research Foundation.
Acknowledgements
We thank Saskia van Stockum for assistance in preparation of figures. Dr A.S. is employed by General Electric Healthcare. Dr D.C.A. serves as Associate Editor of Magnetic Resonance in Medicine; may accrue revenue on US Patents 7,545,142 (issued: 6/9/2009), 7,369,888 (issued: 5/6/2008), 6,980,845 (issued: 12/27/2005), and 6,717,405 (issued: 4/6/2004): Methods for perfusion imaging with arterial spin labelling MRI and US Patent 6,252,403 (issued: 6/26/2001): RF coil for high field MRI; receives research support from GE Healthcare, Merck & Co., and the NIH [1 R01 CA115745-01A1 (PI), 1 R01 AG027435-01 (Co-I), R01-EB004582(Co-I), R01 MH80729-01A2 (Co-I), R01 MH077073-01A2 (Co-I), R01DC008796-01A1 (Co-I), R01 NS047029-04A2 (Co-I), and 1P50 CA101942-01 (Co-I)]; has received license fee payments from Siemens Medical for US Patents 7,369,888 and 6,980,845: Multi-slice perfusion imaging; and may receive royalty payments through a licensing agreement with GE Healthcare for US Patent 7,545,142: Arterial spin labelling with pulsed radio frequency sequences.
Glossary
Abbreviations
- MoCA
Montreal Cognitive Assessment
- UPDRS
Unified Parkinson’s Disease Rating Scale
References
- Aarsland D, Bronnick K, Williams-Gray C, Weintraub D, Marder K, Kulisevsky J, et al. Mild cognitive impairment in Parkinson disease: a multicenter pooled analysis. Neurology. 2010;75:1062–9. doi: 10.1212/WNL.0b013e3181f39d0e. [DOI] [PMC free article] [PubMed] [Google Scholar]
- Alexander GE, Moeller JR. Application of the scaled subprofile model to functional imaging in neuropsychiatric disorders: a principal component approach to modeling brain function in disease. Hum Brain Mapp. 1994;2:79–94. [Google Scholar]
- Alsop DC, Detre JA, Grossman M. Assessment of cerebral blood flow in Alzheimer's disease by spin-labeled magnetic resonance imaging. Ann Neurol. 2000;47:93–100. [PubMed] [Google Scholar]
- Ashburner J, Friston KJ. Unified segmentation. Neuroimage. 2005;26:839–51. doi: 10.1016/j.neuroimage.2005.02.018. [DOI] [PubMed] [Google Scholar]
- Asllani I, Habeck C, Scarmeas N, Borogovac A, Brown TR, Stern Y. Multivariate and univariate analysis of continuous arterial spin labeling perfusion MRI in Alzheimer’s disease. J Cereb Blood Flow Metab. 2007;28:725–36. doi: 10.1038/sj.jcbfm.9600570. [DOI] [PMC free article] [PubMed] [Google Scholar]
- Berding G, Odin P, Brooks DJ, Nikkhah G, Matthies C, Peschel T, et al. Resting regional cerebral glucose metabolism in advanced Parkinson’s disease studied in the off and on conditions with [18F]FDG-PET. Mov Disord. 2001;16:1014–22. doi: 10.1002/mds.1212. [DOI] [PubMed] [Google Scholar]
- Borghammer P, Chakravarty M, Jonsdottir KY, Sato N, Matsuda H, Ito K, et al. Cortical hypometabolism and hypoperfusion in Parkinson’s disease is extensive: probably even at early disease stages. Brain Struct Funct. 2010;214:303–17. doi: 10.1007/s00429-010-0246-0. [DOI] [PubMed] [Google Scholar]
- Borghammer P, Cumming P, Aanerud J, Förster S, Gjedde A. Subcortical elevation of metabolism in Parkinson's disease – a critical reappraisal in the context of global mean normalization. Neuroimage. 2009a;47:1514–21. doi: 10.1016/j.neuroimage.2009.05.040. [DOI] [PubMed] [Google Scholar]
- Borghammer P, Cumming P, Aanerud J, Gjedde A. Artefactual subcortical hyperperfusion in PET studies normalized to global mean: lessons from Parkinson's disease. Neuroimage. 2009b;45:249–57. doi: 10.1016/j.neuroimage.2008.07.042. [DOI] [PubMed] [Google Scholar]
- Borghammer P, Jonsdottir KY, Cumming P, Ostergaard K, Vang K, Ashkanian M, et al. Normalization in PET group comparison studies–The importance of a valid reference region. Neuroimage. 2008;40:529–40. doi: 10.1016/j.neuroimage.2007.12.057. [DOI] [PubMed] [Google Scholar]
- Buijs PC, Krabbe-Hartkamp MJ, Bakker CJ, de Lange EE, Ramos LM, Breteler MM, et al. Effect of age on cerebral blood flow: measurement with ungated two- dimensional phase-contrast MR angiography in 250 adults. Radiology. 1998;209:667–74. doi: 10.1148/radiology.209.3.9844657. [DOI] [PubMed] [Google Scholar]
- Caviness JN, Driverdementiaunckley E, Connor DJ, Sabbagh MN, Hentz JG, Noble B, et al. Defining mild cognitive impairment in Parkinson's disease. Mov Disord. 2007;22:1272–7. doi: 10.1002/mds.21453. [DOI] [PubMed] [Google Scholar]
- Dai W, Garcia D, de Bazelaire C, Alsop DC. Continuous flow-driven inversion for arterial spin labeling using pulsed radio frequency and gradient fields. Magn Reson Med. 2008;60:1488–97. doi: 10.1002/mrm.21790. [DOI] [PMC free article] [PubMed] [Google Scholar]
- Dalrymple-Alford JC, MacAskill MR, Nakas CT, Livingston L, Graham C, Crucian GP, et al. The MoCA: well-suited screen for cognitive impairment in Parkinson's disease. Neurology. 2010;75:1717–25. doi: 10.1212/WNL.0b013e3181fc29c9. [DOI] [PubMed] [Google Scholar]
- Detre JA, Leigh JS, Williams DS, Koretsky AP. Perfusion imaging. Magn Reson Med. 1992;23:37–45. doi: 10.1002/mrm.1910230106. [DOI] [PubMed] [Google Scholar]
- Dubois B, Burn D, Goetz C, Aarsland D, Brown RG, Broe GA, et al. Diagnostic procedures for Parkinson's disease dementia: recommendations from the movement disorder society task force. Mov Disord. 2007;22:2314–24. doi: 10.1002/mds.21844. [DOI] [PubMed] [Google Scholar]
- Eckert T, Tang C, Eidelberg D. Assessment of the progression of Parkinson's disease: a metabolic network approach. Lancet Neurol. 2007;6:926–32. doi: 10.1016/S1474-4422(07)70245-4. [DOI] [PMC free article] [PubMed] [Google Scholar]
- Efron B, Tibshirani RJ. An introduction to the bootstrap. New York: Chapman & Hall; 1993. [Google Scholar]
- Eidelberg D. Metabolic brain networks in neurodegenerative disorders: a functional imaging approach. Trends Neurosci. 2009;32:548–57. doi: 10.1016/j.tins.2009.06.003. [DOI] [PMC free article] [PubMed] [Google Scholar]
- Fahn S, Elton R. Unified Parkinson’s Disease Rating Scale. In: Fahn S, Marsden C, Calne D, Goldstein M, editors. Recent developments in Parkinson’s disease. Florham Park, NJ: Macmillan Healthcare Information; 1987. pp. 153–63. [Google Scholar]
- Firbank MJ, Colloby SJ, Burn DJ, McKeith IG, O'Brien JT. Regional cerebral blood flow in Parkinson’s disease with and without dementia. Neuroimage. 2003;20:1309–19. doi: 10.1016/S1053-8119(03)00364-1. [DOI] [PubMed] [Google Scholar]
- Hastie T, Tibshirani R, Friedman JH. The elements of statistical learning: data mining, inference, and prediction. New York: Springer; 2009. [Google Scholar]
- Hershey T, Black KJ, Carl JL, McGee-Minnich L, Snyder AZ, Perlmutter JS. Long term treatment and disease severity change brain responses to levodopa in Parkinson's disease. J Neurol Neurosurg Psychiatry. 2003;74:844–51. doi: 10.1136/jnnp.74.7.844. [DOI] [PMC free article] [PubMed] [Google Scholar]
- Hirano S, Asanuma K, Ma Y, Tang C, Feigin A, Dhawan V, et al. Dissociation of metabolic and neurovascular responses to levodopa in the treatment of Parkinson’s disease. J Neurosci. 2008;28:4201–9. doi: 10.1523/JNEUROSCI.0582-08.2008. [DOI] [PMC free article] [PubMed] [Google Scholar]
- Hosokai Y, Nishio Y, Hirayama K, Takeda A, Ishioka T, Sawada Y, et al. Distinct patterns of regional cerebral glucose metabolism in Parkinson’s disease with and without mild cognitive impairment. Mov Disord. 2009;24:854–62. doi: 10.1002/mds.22444. [DOI] [PubMed] [Google Scholar]
- Hsu J-L, Jung T-P, Hsu C-Y, Hsu W-C, Chen Y-K, Duann J-R, et al. Regional CBF changes in Parkinson’s disease: a correlation with motor dysfunction. Eur J Nucl Med Mol Imaging. 2007;34:1458–66. doi: 10.1007/s00259-006-0360-7. [DOI] [PubMed] [Google Scholar]
- Hu MTM, Taylor-Robinson SD, Chaudhuri KR, Bell JD, Labbe C, Cunningham VJ, et al. Cortical dysfunction in non-demented Parkinson’s disease patients: a combined 31P-MRS and 18FDG-PET study. Brain. 2000;123:340–52. doi: 10.1093/brain/123.2.340. [DOI] [PubMed] [Google Scholar]
- Hughes AJ, Daniel SE, Kilford L, Lees AJ. Accuracy of clinical diagnosis of idiopathic Parkinson’s disease: a clinico-pathological study of 100 cases. J Neurol Neurosurg Psychiatry. 1992;55:181–4. doi: 10.1136/jnnp.55.3.181. [DOI] [PMC free article] [PubMed] [Google Scholar]
- Huang C, Mattis P, Tang C, Perrine K, Carbon M, Eidelberg D. Metabolic brain networks associated with cognitive function in Parkinson's disease. Neuroimage. 2007a;34:714–23. doi: 10.1016/j.neuroimage.2006.09.003. [DOI] [PMC free article] [PubMed] [Google Scholar]
- Huang C, Tang C, Feigin A, Lesser M, Ma Y, Pourfar M, et al. Changes in network activity with the progression of Parkinson’s disease. Brain. 2007b;130:1834–46. doi: 10.1093/brain/awm086. [DOI] [PMC free article] [PubMed] [Google Scholar]
- Jenkins IH, Fernandez W, Playford ED, Lees AJ, Frackowiak RS, Passingham RE, et al. Impaired activation of the supplementary motor area in Parkinson’s disease is reversed when akinesia is treated with apomorphine. Ann Neurol. 1992;32:749–57. doi: 10.1002/ana.410320608. [DOI] [PubMed] [Google Scholar]
- Kasama S, Tachibana H, Kawabata K, Yoshikawa H. Cerebral blood flow in Parkinson’s disease, dementia with Lewy bodies, and Alzheimer’s disease according to three-dimensional stereotactic surface projection imaging. Dement Geriatr Cogn Disord. 2005;19:266–75. doi: 10.1159/000084551. [DOI] [PubMed] [Google Scholar]
- Kobari M, Fukuuchi Y, Shinohara T, Obara K, Nogawa S. Levodopa-induced local cerebral blood flow changes in Parkinson’s disease and related disorders. J Neurol Sci. 1995;128:212–8. doi: 10.1016/0022-510x(94)00237-i. [DOI] [PubMed] [Google Scholar]
- Lemaître H, Crivello F, Grassiot B, Alpérovitch A, Tzourio C, Mazoyer B. Age- and sex-related effects on the neuroanatomy of healthy elderly. Neuroimage. 2005;26:900–11. doi: 10.1016/j.neuroimage.2005.02.042. [DOI] [PubMed] [Google Scholar]
- Liepelt I, Reimold M, Maetzler W, Godau J, Reischl G, Gaenslen A, et al. Cortical hypometabolism assessed by a metabolic ratio in Parkinson’s disease primarily reflects cognitive deterioration. Mov Disord. 2009;24:1504–11. doi: 10.1002/mds.22662. [DOI] [PubMed] [Google Scholar]
- Ma Y, Huang C, Dyke JP, Pan H, Alsop D, Feigin A, et al. Parkinson’s disease spatial covariance pattern: noninvasive quantification with perfusion MRI. J Cereb Blood Flow Metab. 2010;30:505–9. doi: 10.1038/jcbfm.2009.256. [DOI] [PMC free article] [PubMed] [Google Scholar]
- Ma Y, Tang C, Spetsieris PG, Dhawan V, Eidelberg D. Abnormal metabolic network activity in Parkinson’s disease: test-retest reproducibility. J Cereb Blood Flow Metab. 2007;27:597–605. doi: 10.1038/sj.jcbfm.9600358. [DOI] [PMC free article] [PubMed] [Google Scholar]
- Melamed E, Globus M, Mildworf B. Regional cerebral blood flow in patients with Parkinson's disease under chronic levodopa therapy: measurements during "on" and "off" response fluctuations. J Neurol Neurosurg Psychiatry. 1986;49:1301–4. doi: 10.1136/jnnp.49.11.1301. [DOI] [PMC free article] [PubMed] [Google Scholar]
- Mentis MJ, McIntosh AR, Perrine K, Dhawan V, Berlin B, Feigin A, et al. Relationships among the metabolic patterns that correlate with mnemonic, visuospatial, and mood symptoms in Parkinson’s disease. Am J Psychiatry. 2002;159:746. doi: 10.1176/appi.ajp.159.5.746. [DOI] [PubMed] [Google Scholar]
- Mito Y, Yoshida K, Yabe I, Makino K, Hirotani M, Tashiro K, et al. Brain 3D-SSP SPECT analysis in dementia with Lewy bodies, Parkinson’s disease with and without dementia, and Alzheimer's disease. Clin Neurol Neurosurg. 2005;107:396–403. doi: 10.1016/j.clineuro.2004.12.005. [DOI] [PubMed] [Google Scholar]
- Moeller JR, Habeck CG. Reciprocal benefits of mass-univariate and multivariate modeling in brain mapping: applications to event-related functional MRI, H2150-, and FDG-PET. Int J Biomed Imaging. 2006;2006:1–13. doi: 10.1155/IJBI/2006/79862. [DOI] [PMC free article] [PubMed] [Google Scholar]
- Molloy DW, Standish TI. A guide to the standardized Mini-Mental State Examination. Int Psychogeriatr. 1997;9:87–94. doi: 10.1017/s1041610297004754. [DOI] [PubMed] [Google Scholar]
- Nasreddine ZS, Phillips NA, Bédirian V, Charbonneau S, Whitehead V, Collin I, et al. The Montreal Cognitive Assessment, MoCA: a Brief Screening Tool For Mild Cognitive Impairment. J Am Geriatr Soc. 2005;53:695–9. doi: 10.1111/j.1532-5415.2005.53221.x. [DOI] [PubMed] [Google Scholar]
- Nobili F, Abbruzzese G, Morbelli S, Marchese R, Girtler N, Dessi B, et al. Amnestic mild cognitive impairment in Parkinson’s disease: a brain perfusion SPECT study. Mov Disord. 2009;24:414–21. doi: 10.1002/mds.22381. [DOI] [PubMed] [Google Scholar]
- Osaki Y, Morita Y, Fukumoto M, Akagi N, Yoshida S, Doi Y. Three-dimensional stereotactic surface projection SPECT analysis in Parkinson's disease with and without dementia. Mov Disord. 2005;20:999–1005. doi: 10.1002/mds.20463. [DOI] [PubMed] [Google Scholar]
- Poston KL, Eidelberg D. Network biomarkers for the diagnosis and treatment of movement disorders. Neurobiol Dis. 2009;35:141–7. doi: 10.1016/j.nbd.2008.09.026. [DOI] [PubMed] [Google Scholar]
- Roman GC, Tatemichi TK, Erkinjuntti T, Cummings JL, Masdeu JC, Garcia JH, et al. Vascular dementia: diagnostic criteria for research studies. Report of the NINDS-AIREN International Workshop. Neurology. 1993;43:250–60. doi: 10.1212/wnl.43.2.250. [DOI] [PubMed] [Google Scholar]
- Scarmeas N, Habeck CG, Zarahn E, Anderson KE, Park A, Hilton J, et al. Covariance PET patterns in early Alzheimer's disease and subjects with cognitive impairment but no dementia: utility in group discrimination and correlations with functional performance. Neuroimage. 2004;23:35–45. doi: 10.1016/j.neuroimage.2004.04.032. [DOI] [PMC free article] [PubMed] [Google Scholar]
- Spetsieris PG, Ma Y, Dhawan V, Eidelberg D. Differential diagnosis of parkinsonian syndromes using PCA-based functional imaging features. Neuroimage. 2009;45:1241–52. doi: 10.1016/j.neuroimage.2008.12.063. [DOI] [PubMed] [Google Scholar]
- Turk M, Pentland A. Eigenfaces for recognition. J Cogn Neurosci. 1991;3:71–86. doi: 10.1162/jocn.1991.3.1.71. [DOI] [PubMed] [Google Scholar]
- Vander Borght T, Minoshima S, Giordani B, Foster NL, Frey KA, Berent S, et al. Cerebral metabolic differences in Parkinson’s and Alzheimer's diseases matched for dementia severity. J Nucl Med. 1997;38:797–802. [PubMed] [Google Scholar]
- Verbaan D, Marinus J, Visser M, van Rooden SM, Stiggelbout AM, Middelkoop HAM. Cognitive impairment in Parkinson's disease. J Neurol Neurosurg Psychiatry. 2007;78:1182–7. doi: 10.1136/jnnp.2006.112367. [DOI] [PMC free article] [PubMed] [Google Scholar]