

Abstract
The interaction between cancer and its local microenvironment can determine properties of growth and metastasis. A critical component of the tumor microenvironment in this context is the cancer-associated fibroblast (CAF), which can promote tumor growth, angiogenesis and metastasis. It has been hypothesized that CAF may be derived from mesenchymal stromal cells (MSC), derived from local or distant sources. However, the signaling mechanisms by which tumors and MSCs interact to promote CAF-dependent cancer growth are largely unknown. In this study with in vitro and in vivo models using MDA-MB231 human breast cancer cells, we demonstrate that tumor-derived osteopontin (OPN) induces MSC production of CCL5; the mechanism involves OPN binding to integrin cell surface receptors and activator protein-1 c-jun homodimer transactivation. In a murine xenograft model, concomitant inoculation of MSC with MDA-MB231 cells induces: (i) significantly increased growth and metastasis of MB231 cells and (ii) increased MSC migration to metastatic sites in lung and liver; this mechanism is both OPN and CCL5 dependent. MSCs retrieved from sites of metastases exhibit OPN-dependent expression of the CAF markers, α-smooth muscle actin, tenascin-c, CXCL12 (or stromal cell-derived factor 1) and fibroblast-specific protein-1 and the matrix metalloproteinases (MMP)-2 and MMP-9. Based upon these results, we propose that tumor-derived OPN promotes tumor progression via the transformation of MSC into CAF.
The relationship between cancer cells and the tumor microenvironment plays a major role in cancer growth and metastasis. The surrounding stroma contains mesenchymal stromal cells (MSC), whether locally or bone marrow derived, which promote cancer growth through endocrine and paracrine signaling. However, the mechanisms by which tumors and MSCs interact to promote cancer growth are only recently becoming defined. Karnoub et al.(1) demonstrated that bone marrow-derived human MSCs interact with human breast carcinoma cells to significantly increase metastatic potency. The breast cancer cells stimulated de novo MSC secretion of the chemokine CCL5 to act in a paracrine fashion to enhance cancer cell motility, invasion and metastasis. Pinilla et al. (2) subsequently corroborated MSC CCL5 expression in cocultures of MDA-MB231 human breast cancer cells and human adipose stromal cells. Fundamentally, cancer progression depends on an accumulation of metastasis-supporting physiological changes, which are regulated by cell signaling molecules. One such molecule, osteopontin (OPN), is a secreted phosphoprotein which functions as a cell attachment protein and cytokine that signals through two cell adhesion molecules: αvβ3-integrin and CD44(3–5). Initially discovered as an inducible, tumor-promoter gene, OPN is overexpressed in human tumors and OPN serum levels correlate with advanced metastatic cancer(6–13). Gain- and loss-of-function assays have demonstrated a critical role for OPN in tumor metastatic function in colon, liver and breast cancers(14). OPN secretion by tumor cells has been associated with bone marrow cell activation, mobilization and stromal incorporation to ultimately promote local tumor growth and metastasis(15).
We sought to integrate these streams of evidence to examine OPN, CCL5 and tumor progression in cancer cells and MSC. In this paper utilizing in vivo and in vitro models of human breast cancer, we demonstrate that OPN induces human MSC expression of CCL5 to enhance tumor growth and metastasis. OPN signals via its integrin cell surface receptor and activator protein-1 (AP-1) transactivation to induce CCL5 expression. In xenograft models using MDA-MB231 and MSC, ablation of circulating OPN significantly reduces tumor growth and metastasis, MSC mobilization and serum CCL5 levels; this is reversed with CCL5. MSC extracted from sites of tumor metastasis exhibit significantly increased OPN-dependent expression of the cancer-associated fibroblast (CAF) markers, α-smooth muscle actin (αSMA), tenascin-c, CXCL12 (or stromal cell-derived factor 1) and fibroblast-specific protein (FSP)-1. In addition, these MSC also exhibited OPN-dependent matrix metalloproteinase (MMP) activities, MMP-2 and MMP-9. Our results indicate that tumor OPN expression activates MSC expression of CCL5, MMPs and CAF markers to promote tumor growth and metastasis. Ultimately, the transformation of MSC to CAF may be mediated by OPN in the tumor microenvironment.
Methods
Materials
Chemokine and cytokine assays were performed by the Cytokine Core Lab, University of Maryland, Baltimore, MD. (See supplementary Materials,available at Carcinogenesis Online for listing.) Antibodies to c-fos (SC-45), c-jun (SC-52) and CD44 (SC-7946) and small interfering RNA (siRNA) to c-jun with mismatch siRNA were purchased from Santa Cruz Biotechnology, Santa Cruz, CA. CCR5 Ab (AHP568) was purchased from Serotec, Raleigh, NC and Integrin αVβ3 Ab (78289) was obtained from Abcam, Cambridge, MA. Chromatin immunoprecipitation (ChIP) and reverse transcription–polymerase chain reaction (RT–PCR) primer, OPN aptamer and CCL5 promoter construct sequences are listed in supplementary Material, available at Carcinogenesis Online.
Western blot, real-time RT–PCR, immunohistochemical, transfection of OPN siRNA oligonucleotides and gelatin zymography analyses
See supplementary Material, available at Carcinogenesis Online.
Cell culture
The MDA-MB-231 human breast cancer cell line was obtained from the American Type Culture Collection (Manassas, VA) and cultured in Dulbecco’s modified Eagle’s medium supplemented with 10% fetal calf serum, penicillin (100 U/ml), streptomycin (100 μg/ml) and maintained at 37°C in a humidified atmosphere of 5% CO2. Human MSC (MSC; CD34/CD45/CD14/HLA-DR neg and CD105/CD73/CD44/CD90 pos) expressing green fluorescent protein (GFP) were obtained from Darwin Prockop, Texas A&M University System Health Science Center (http://medicine.tamhsc.edu/irm/msc-distribution.html) and maintained in modified Eagle's medium with 2 mM L-glutamine and 16.5% fetal bovine serum. Cells were treated with OPN (5 nM); OPN concentration was based upon the observations of Bramwell et al. (16) who measured plasma OPN levels in 158 women with newly diagnosed metastatic breast cancer; 99/158 (63%) had elevated baseline OPN levels (median ∼5 nM; range 1–80 nM).
Adhesion and invasion assays
Adhesion assays was performed on 96-well microtiter plates coated with 10 μg/ml Matrigel. Cells (105) were exposed to 100 nM aptamer or 2 μg Ab for 30 min. Cells were trypsinized and resuspended in Dulbecco’s modified Eagle’s medium with 1% bovine serum albumin, 1 mM MgCl2, 0.5 mM CaCl2 at a concentration of 1 × 10⁶ cells/ml. Cells (100 μl; 1 × 10⁵) were added into each well and incubated for 30 min at 37°C in 5% CO2. Non-adherent cells were removed by gently washing the wells three times with phosphate-buffered saline (PBS) with 1 mM MgCl2 and 0.5 mM CaCl2. Adherent cells were fixed with 3.7% paraformaldehyde for 10 min at room temperature, followed by rinsing with PBS and stained with 0.4% crystal violet for 10 min. After extensive rinsing, the dye was released from the cells by addition of 30% acetic acid, and the plates were read in a microplate reader (Molecular Devices, Berkeley, California) at 590 nm. The migration–invasion assay was carried out in a Boyden Chamber system (Corning, NY). Cells were seeded at a density of 105 cells per well in triplicate in the upper chamber of 12 well transwells (8 μm pore). After incubation, cells were treated with 100 nM aptamer or 2 ug Ab at 37°C for 24 h. The cells were fixed in 3.7% paraformaldehyde in PBS for 10 min. The cells on the top surface of the filters were wiped off with cotton swabs. Following three washes with PBS, the filters were stained with 0.4% crystal violet for 10 min, and the dye was detected as described for the adhesion assay.
ChIP RT–PCR
Chromatin was fixed and immunoprecipitated using the ChIP assay kit (Upstate Biotechnology, Lake Placid, NY) as recommended by the manufacturer. Purified chromatin was immunoprecipitated using 10 μg of anti-c-jun or c-fos Ab (Santa Cruz Biotechnology) or 5 μl of rabbit non-immune serum; eluted DNA fragments were purified to serve as templates. The input fraction corresponded to 0.1 and 0.05% of the chromatin solution before immunoprecipitation. The average size of the sonicated DNA fragments subjected to immunoprecipitation was 500 bp as determined by ethidium bromide gel electrophoresis. After DNA purification, the presence of the selected DNA sequence was quantified by RT–PCR.
Mouse xenograft model
Animal handling and procedures were approved by the Duke University Animal Care and Use Committee. Six-week-old female NOD scid mice were purchased from the Jackson Laboratory (Bar Harbor, Maine) (17). The 2 × 10⁶ MDA-MB-231-Luciferase-expressing cells (a gift of Dr Mark Dewhirst, Duke University, NC) and/or 2 × 10⁶ GFP-labeled MSC were suspended in PBS and implanted into the R4 positions of the mice mammary fat pad (four per group). OPN-R3 (10 mg/kg), OPN-R3 mutant (10 mg/kg) and OPN-R3 plus CCL5 (10 μg/kg) were injected, respectively, into the mouse tail vein every 2 days following tumor cell implantation. The mice were anesthetized with intraperitoneal ketamine (75 mg/kg) and xylazine (10 mg/kg). For bioluminescence imaging, animals were placed in a light-tight chamber in which grayscale reference images were obtained under dim conditions. A pseudocolor image acquired in the dark was superimposed on the grayscale image to represent photons emitted from tumors. Bioluminescence is reported as the sum of detected photons per second from a constant region of interest (photons/second/region of interest). Ten minutes after administration of luciferase substrate (D-luciferin, 150 mg/kg), anesthetized mice were imaged with the IVIS 100 Imaging System (Xenogen, Alameda,CA). Initial in vivo images at day 2 were obtained to establish baseline tumor volume as measured by photon emission. For ex vivo imaging, D-luciferin (150 mg/kg) was injected into the mice before necropsy. Primary tumor, lung lobes and liver were excised and placed into tissue culture plates with D-luciferin (300 μg/ml) in PBS. For fluorescence optical imaging, the small animal imaging System 200 (Caliper Lifesciences, Hopkinton, MA) containing an MT-20 light source and GFP filter was used. High-resolution GFP images were captured. Images were analyzed with the use of software AxioVision LE (Carl Zeiss MicroImaging, Thornwood, NY) After imaging, tissues were either kept in −80°C freezer for RNA and protein analysis, in 1% formalin solution for immunohistochemical analysis or immediately prepared for flow cytometry cell sorting.
Fluorescence activated cell sorting
Fresh primary tumor, lung or liver tissue was obtained. Single cell suspension was prepared as reported by Keng et al. (18). The tissues were finely minced with surgical scissors and transferred to 10 ml collagenase–PBS solution (1 × PBS, PH7.4; 0.025% collagenase, 0.05%pronase and 0.04% Dnase). After 1 h incubation at 37°C, the tissue pellets were centrifuged at 1000 r.p.m. for 10 min at 4°C and washed three times with 5 ml PBS. The tissue homogenate was gently passed through 70 um pore nylon mesh filter at 4°C. GFP-labeled cell sorting was performed using BD FACStar using an air-cooled argon laser at 100 mW on a 488 nm argon line to identify GFP fluorescence with a 530/30 band pass filter. GFP-positive cells were collected in PBS and stored at −80°C.
Statistical analysis
All data are presented as mean ± standard deviation. Analysis was performed using a Student’s t-test. Values of P < 0.05 were considered significant.
Results
OPN-mediated MSC CCL5 expression and function
The interplay between tumor cells and MSC may depend, in part, upon OPN paracrine-signaling pathways. MSC cells in culture were exposed to OPN (5 nM) for a period of 24 h. Untreated cells (CTRL) and cells were exposed to OPN, OPN-R3 aptamer (APT, 1.5 μM) and/or mutant OPN-R3 (MuAPT, 1.5 μM); OPN-R3 is an RNA aptamer which specifically binds and inactivates extracellular OPN(17). Using enzyme-linked immunosorbent assay, the culture medium was evaluated for chemokine and cytokine expression. (See supplementary Materials, available at Carcinogenesis Online for listing of chemokines and cytokines assayed.) Only CCL5 was significantly elevated (∼ 10-fold) following OPN stimulation, 356 ± 63 pg/ml, in contrast to 26 ± 10 pg/ml, 29 ± 11 pg/ml and 323 ± 29 pg/ml in CTRL, OPN + APT, and OPN + MuAPT, respectively (P < 0.001 OPN versus CTRL and OPN + APT). Dose- (0, 0.5, 5.0 and 50 nM OPN) and time-dependent (0, 12, 24, 26 and 48 h) MSC expression of CCL5 following OPN stimulation was then determined. (Figure 1A) CCL5 levels peaked at 12 h (1113 ± 119 pg/ml with OPN 50 nM and 823 ± 99 pg/ml with OPN 5.0 nM) and decreased to levels not different from CTRL after 36 h (P < 0.01 OPN 50 nM versus OPN 5 nM). Western blot analysis of cell lysates and RT–PCR for OPN messenger RNA (mRNA) demonstrate that MSC do not express detectable OPN following exposure to OPN. In studies that follow, MSC were exposed to 5 nM OPN for 12 h.
Fig. 1.

(A) Dose- (0, 0.5, 5.0 and 50 nM OPN) and time-dependent (0, 12, 24, 26 and 48 h) MSC expression of CCL5 following OPN stimulation was then determined using enzyme-linked immunosorbent assay. Data presented as mean ± standard deviation of four experiments (*P < 0.01 versus 0, 36 and 48 h; **P < 0.01 versus 0, 36 and 48 h; @P < 0.01 versus 0, 24, 36 and 48 h). (B) CCL5 was measured in MSC were exposed to OPN (5 nM for 12 h) in the presence of RGD, a competitive ligand inhibitor of integrin binding, CD44-blocking Ab or OPN-R3 aptamer APT. Arg-Gly-Glu, IgG and mutant aptamer (MuAPT) served as controls. Data presented as mean ± standard deviation of four experiments (*P < 0.001 versus CTRL, OPN + RGD, OPN + APT). (C) Northern blot analysis of MSC CCL5 mRNA following exposure to OPN (5 nM) for 2 h. Blot is representative of three studies. (D) ChIP RT–PCR for RNA Pol II binding to the OPN promoter region in MSC. Data presented as mean ± standard deviation of four experiments (*P < 0.001 versus CTRL, OPN + RGD, OPN + APT).
OPN mediates critical cell-matrix and cell–cell signaling through integrin and CD44 receptors(19). MSC were exposed to OPN in the presence of Arg-Gly-Asp (RGD), a competitive ligand inhibitor of integrin binding, CD44-blocking Ab or OPN-R3 APT (Figure 1B). Blockade of integrin binding and APT binding of extracellular OPN-ablated CCL5 expression suggesting that OPN-dependent CCL5 expression requires integrin binding. MuAPT, Arg-Gly-Glu and IgG did not alter MSC CCL5 production (Data not shown). Northern blot analysis performed after 2 h of OPN (5 nM) stimulation demonstrated that CCL5 mRNA was readily detected. (Figure 1C) Again, integrin blockade and APT ablated this signal. To assess the effect of OPN on CCL5 transcription, recruitment of RNA polymerase II to the CCL5 promoter was determined by RT–PCR ChIP. OPN stimulation increased CCL5 transcription (∼30-fold) over CTRL; again, this was abolished in the presence of RGD and APT (P < 0.001 OPN versus CTRL, OPN + RGD and OPN + APT) (Figure 1D) Transient transfection analysis was then performed using a CCL5 promoter (976 bp; GenBank GQ504011.1) and various deletion constructs(20). OPN stimulation resulted in significant transactivation of the full-length promoter. Among the deletion constructs, there was a significant step off between CCL5 nt-389 and nt-329. (Figure 2A) This segment contained three canonical AP-1 and one Oct-1-binding sites(20). ChIP assays examined the potential for OPN-dependent binding of AP-1 c-jun, AP-1 c-fos or Oct-1 to this region (Figure 2B). OPN stimulation of MSC resulted in AP-1 c-jun binding to the CCL5 promoter in the nt-389 to nt-329 region, suggesting that c-jun binds as a homodimer. These images were corroborated with ChIP RT–PCR (data not shown). The 976 bp CCL5 promoter–reporter construct was mutated by deletion of the three presumptive AP-1-binding sites spanning the region from nt-331 to nt-355. Transfection studies were then repeated (Figure 2C). Mutation of the AP-1 site and siRNA-mediated silencing of c-jun significantly decreased CCL5 promoter activity. Finally, secreted CCL5 protein was measured in OPN-stimulated MSC exposed to siRNA to c-jun (Figure 2D). Ablation of c-jun expression significantly decreased CCL5 protein in OPN-stimulated MSC.
Fig. 2.

(A) Transient transfection analysis of the human CCL5 promoter constructs. CCL5 promoter reporter-constructs were transfected into MSC and stimulated with OPN (5 nM). The histograms are representations of normalized luciferase activity. Data are expressed as mean ± standard deviation of three experiments (*P < 0.01 versus CCL5 -900, -718, -624, -433 and -389 constructs). (B) ChIP assay in MSC for OPN-dependent binding of AP-1 c-jun, AP-1 c-fos or Oct-1 to CCL5 promoter region: nt-389 and nt-329. This segment of 60 nt contained one canonical AP-1 and one Oct-1-binding site. Blot is representative of three studies. (C) Transient transfection analysis of human CCL5 promoter constructs. The 976 bp CCL5 promoter–reporter construct was mutated by deletion of the three presumed AP-1-binding sites spanning the region from nt-331 to nt-355. In selected instances, siRNA targeting c-jun was transfected into the MSC 24 h prior to OPN stimulation. The histograms are representations of normalized luciferase activity. Data are expressed as mean ± standard deviation of three experiments (*P < 0.001 versus Unstim, Mutant and siRNA c-jun). (D) Secreted CCL5 protein was measured using western blot analysis in OPN-stimulated MSC, which were exposed to siRNA to c-jun. Cell lysate β-actin served as a control. Blot is representative of three studies. (E) OPN-dependent adhesion, migration and invasion of MSC. In vitro adhesion, migration and invasion assays were performed. MSC were exposed to OPN (5 nM for 12 h) in the presence of RGD, a competitive ligand inhibitor of integrin binding, CCL5 Ab, CCR5 Ab, αvβ3 integrin Ab, OPN-R3 aptamer APT or APT + CCL5. Arg-Gly-Glu, IgG and mutant aptamer (MuAPT) served as controls. Data are presented as mean ± standard deviation of four experiments (*P < 0.01 versus CTRL, OPN + APT, OPN + RGD, OPN + CCL5 Ab, OPN + Integrin Ab and OPN + CCR5 Ab; #P < 0.01 versus CTRL, OPN + APT, OPN + RGD, OPN + CCL5 Ab, OPN + Integrin Ab and OPN + CCR5 Ab).
We then performed MSC adhesion and migration/invasion assays (Figure 2E). OPN-increased MSC adhesion and migration/invasion by ∼5- and 2- fold, respectively. (P < 0.01 OPN versus CTRL for both adhesion and migration/invasion) This was again ablated by addition of APT or RGD with OPN; addition of CCL5 Ab, CCR5 Ab and αvβ3 integrin Ab also decreased adhesion and migration/invasion to levels equivalent to CTRL. Repletion of CCL5 to the OPN + APT cells restored MSC adhesion and migration/invasion.
Breast cancer cell lines and MSC coculture studies
MDA-MB231 and MCF7 breast cancer cell lines were utilized in coculture studies with MSC. MDA-MB231 expresses a substantial amount of OPN and was selected as a positive control, whereas MCF7 expresses minimal OPN and served as the negative control. (Figure 3A) OPN and CCL5 were then assayed in coculture studies (Figure 3B). APT, RGD and CD44 Ab were added in selected instances. MB231 + MSC cocultures’ CCL5 expression was ∼10-fold greater than that noted in MSC or MB231 alone. (P < 0.01 versus MSC and MB231) Similarly, MCF7 + MSC expression of CCL5 was increased in comparison with MSC or MCF7 alone. (P < 0.01 versus MSC and MCF7) However, in contrast to MB231 + MSC, in MCF7 + MSC, CCL5 levels were increased by only ∼1.5-fold. In both cocultures, CCL5 expression was ablated by OPN-R3 APT and RGD integrin blockade. The cells in MB231 + MSC were then isolated and RT–PCR performed for OPN and CCL5 mRNA (Figure 3C). MSC were the source of CCL5 while OPN was derived from MB231. To determine whether endogenous OPN expression by MSC might contribute to CCL5 production, MSC were exposed to OPN siRNA and CCL5 subsequently measured by western blot analysis (Figure 3D). Endogenous OPN expression in MSC was significantly decreased by OPN siRNA. Exogenous OPN (5 nM × 12 h) resulted in MSC CCL5 production, and there was not a significant difference between OPN siRNA and sham siRNA treatment sets. MSC were then treated with OPN 5 nM and CCL5 protein expression determined at 0, 6, 12, 24 and 48 h(Figure 3E). CCL5 protein peaked at 12 –24 h and declined substantially by 48 h. These data indicate that MSCs were the predominant but transient source of CCL5, the MB231 cells were the source of OPN and endogenous MSC expression of OPN does not significantly contribute to autocrine signaling of CCL5 expression.
Fig. 3.

(A) Western blot analysis of OPN in cell lysate and media of MD-MB231 and MCF7 cells. Blot is representative of three studies. (B) Enzyme-linked immunosorbent assay of CCL5 expression in media from cocultures of MSC with MD-MB231 or MCF7 cells. In selected instances, MSC were incubated with RGD, a competitive ligand inhibitor of integrin binding or OPN-R3 aptamer APT. Arg-Gly-Glu and mutant aptamer (MuAPT) served as controls. Data are presented as mean ± standard deviation of three experiments (*P < 0.01 versus MSC and MD-MB231 or MCF7). (C) RT–PCR of OPN and CCL5 mRNA expression in lysates from cocultures MB231 and MSC. Data are presented as mean ± standard deviation of three experiments (*P < 0.01 versus MB231 coculture, MSC alone and MB231 alone; **P < 0.01 versus MSC coculture and MSC alone). (D) CCL5 protein expression in MSC exposed to OPN siRNA. Following exposure to OPN siRNA or sham siRNA control, MSC were treated with OPN (5 nM) for 6 h. Blot is representative of three experiments. (E) Time course of MSC CCL5 expression. MSC were treated with OPN (5 nM) and western blot analysis performed at 0, 6, 12, 24 and 48 h. Blot is representative of three experiments.
Xenograft tumor studies
We performed tumor xenograft studies using MB231 cells in NOD/Scid mice. In the first set of studies, Luc-MB231 were implanted into the R4 positions of the mice mammary fat pad. In selected instances, GFP–MSC were co-implanted with MB231. Animals were injected via tail vein with OPN-R3 APT (10 mg/kg) or MuAPT every 2 days, and the animals were imaged weekly for in vivo bioluminescence or fluorescence for 8 weeks(Figure 4A). At virtually every time point, bioluminescence was significantly greater by 10-fold in MB231 + MSC compared with MB231(P < 0.01) (Figure 4B). In MB231 + MSC, addition of OPN-R3 APT significantly decreased local tumor growth at week 4, 6 and 8, when compared with the Controls and MuAPT group (P < 0.001 MB231 + MSC + APT versus MB231 + MSC or MB231 + MSC + MuAPT). In the MB231 animals, addition of OPN-R3 APT also significantly decreased local tumor growth at week 4, 6 and 8, when compared with Controls and MuAPT (P < 0.001 MB231 + APT versus MB231 or MB231 + MuAPT). In parallel studies, CCL5 was administered with the OPN-R3 APT in MB231 + MSC. Repletion of CCL5 abolished the functional inhibition of tumor growth and metastasis by OPN-R3 APT. At 10 weeks, serum OPN and CCL5 were measured in each experimental setting (Figure 4C). Serum OPN was significantly increased in MB231 and MB231 + MSC in the presence and absence of MuAPT (P < 0.01 versus MSC, MB231 + APT and MB231 + MSC + APT). In the MSC alone control group, significantly less serum OPN was noted. Minimal OPN was detected with APT. Serum CCL5 was also measured by enzyme-linked immunosorbent assay. High levels of CCL5 were noted in MB231 + MSC; addition of OPN-R3 APT decreased CCL5 by 15-fold(P < 0.01 versus MB231 + MSC). In contrast, MuAPT did not alter CCL5 levels in MB231 + MSC. Predictably, CCL5 was readily detected with exogenous CCL5 (MB231 + MSC + APT + CCL5). Functional inhibition of circulating OPN using the OPN-R3 APT significantly decreased local tumor growth and CCL5 expression.
Fig. 4.


(A) Luc-bioluminescence of MB231 cells coinjected with or without MSC in the mammary fat pad of NOD/scid mice. In selected instances, mice were treated with OPN-R3 aptamer APT, mutant aptamer (MuAPT) or APT + CCL5. Photos are representative of four animals in each group. (B) Bioluminescence of MB231 + MSC and MB231 xenografts. Bioluminescence is reported as the sum of detected photons per second from a constant region of interest (photons/sec/region of interest). Data is represented as mean ± standard deviation of four animals in each group. Two lower panels show identical data with different y-axes to emphasize differences (*P < 0.01 MB231 + MSC + APT versus MB231 + MSC, MB231 + MSC + MuAPT and MB231 + MSC + APT + CCL5; *P < 0.01 MB231 + APT versus MB231 and MB231 + APT). (C) Enzyme-linked immunosorbent assay determination of serum OPN and CCL5 in xenograft model. Data is represented as mean ± standard deviation of four animals in each group (*P < 0.01 versus MSC, MB231, MB231 + APT, MB231 + MSC + APT and MB231 + MuAPT; #P < 0.01 versus MSC, MB231, MB231 + APT, MB231 + MSC + APT, MB231 + MuAPT, MB231 + MSC and MB231 + MSC + MuAPT; **P < 0.01 versus MSC, MB231 + APT, MB231 + MSC + APT, MB231 + MuAPT and MB231 + MSC + APT + CCL5). (D) Luc-bioluminescence and GFP fluorescence analysis of liver, lung and primary mammary fat pad from MB231 cells coinjected with MSC in NOD/scid mice. MSC cells injected alone served as a control. In selected instances, mice were treated with OPN-R3 aptamer APT, mutant aptamer (MuAPT) or APT + CCL5. Photos are representative of four animals in each group. (E) Representative immunohistochemistry of Luc and GFP foci in liver and lung from the MB231 + MSC xenograft model (magnification ×200). Normal tissue did not express Luc or GFP. (F) Representative immunohistochemistry of CAF-associated markers, αSMA, CXCL12, tenascin-c and FSP-1 foci in liver, lung and primary tumor site from the MB231 + MSC xenograft model (magnification ×200) Normal tissue did not express Luc or GFP.
At 8 weeks, necropsy tissue from lung, liver and primary tumor locations were examined for luc-bioluminescence and GFP fluorescence (Figure 4D). In lung and liver from MB231 + MSC, luc-bioluminescence in the APT group was <1% of that in the MuAPT and Control(P < 0.01 APT versus MuAPT and Control). Exogenous CCL5 in the APT group significantly increased bioluminescence compared with Controls. MB231 + MSC lung and liver were analyzed for MSC-associated GFP fluoresence. In all settings, fluoresence was detected at the co-injection site of primary tumor and MSC. In Controls, punctate foci of fluorescence were found in both lung and liver; in a similar fashion, fluorescence was present in the MuAPT and APT + CCL5. We did not detect a fluorescence signal in APT. In MSC alone, no fluorescence was found in the liver or lungs.
To confirm the presence of tumor and MSC, immunohistochemistry was performed on tissue sections of lung and liver from MB231 + MSC animals (Figure 4E). Luciferase and GFP-tagged cells were readily detected in both tissues. This tissue was then examined using immunohistochemistry for the CAF markers, αSMA, tenascin-c, CXCL12 (or stromal cell-derived factor 1) and FSP-1 (Figure 4F). All markers were expressed in all sites.
Ex vivo and in vitro characterization of CAF markers in MSC
To better characterize the MSC component, we used fluorescence activated cell sorting (FACS) to isolate MSC–GFP from the lungs and livers of the MB231 + MSC. Lung and liver were dissociated, and GFP-expressing MSC were isolated(Figure 5A). In OPN-R3 APT animals, there were significantly fewer GFP cells isolated from lung (0.1%) and liver (0.13%) tissues compared with Control (lung 6.5% and liver 2.97%) and MuAPT (lung 7.7%% and liver 2.62%). In mice with MSC alone, minimal GFP cells were present. Finally, in the APT + CCL5, GFP were found at levels (lung 10.8% and liver 6.0%) noted in Control and MuAPT.
Fig. 5.
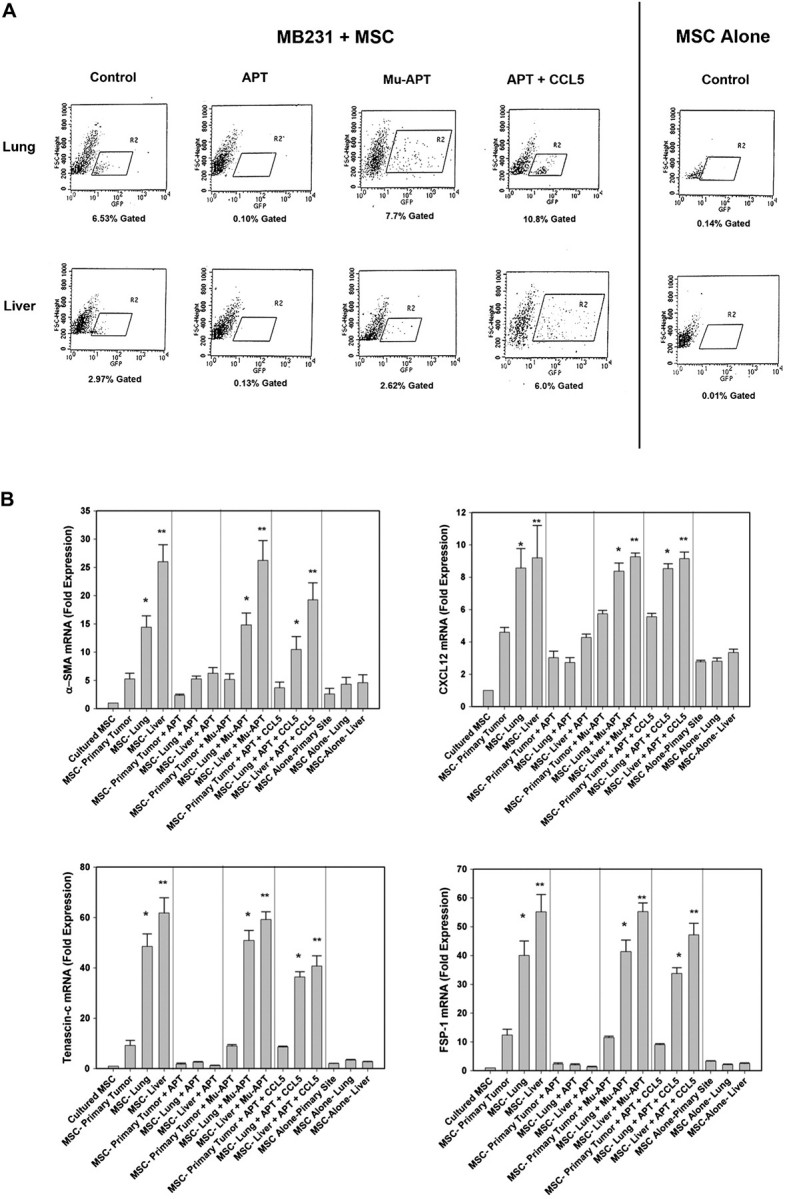

(A) FACS histogram of GFP-labeled cells from livers and lungs of MB231 + MSC and MSC alone. Data is representative of four animals in each treatment arm. (B) RT–PCR mRNA analysis of the CAF-associated markers, αSMA, CXCL12, tenascin-c and FSP-1 in MSC isolated using FACS from mammary fat pad, liver and lung. Data is represented as mean ± standard deviation of four animals in each group (*P < 0.001 versus culture MSC, MSC-primary tumor, MSC-primary tumor + APT, MSC-lung + APT, MSC-liver + APT, MSC-primary tumor + MuAPT, MSC-primary tumor + APT + CCL5, MSC alone primary site, MSC alone liver and MSC alone lung; **P < 0.001 versus MSC-lung, MSC-lung + MuAPT and MSC-lung + APT + CCL5. (C) RT–PCR mRNA analysis of the CAF-associated markers, αSMA, CXCL12, tenascin-c and FSP-1 in MSC stimulated with OPN (5 nM) for 6 h. Data are presented as mean ± standard deviation of three experiments (*P < 0.01 versus OPN + APT, OPN + RGD, OPN + CCL5 Ab, OPN + CCR5 Ab and OPN + αVβ3 integrin Ab). (D) RT–PCR mRNA analysis of MMP-2 and MMP-9 mRNA expression in MSC stimulated with OPN (5 nM) for 6 h. Data are presented as mean ± standard deviation of three experiments (*P < 0.01 versus Unstimulated, OPN + APT and OPN + RGD). (E) Composite MMP-2 and MMP-9 gel zymography activity in MSC stimulated with OPN (5 nM) for 6 h. Data are presented as mean ± standard deviation of three experiments (*P < 0.01 versus Unstimulated, OPN + APT and OPN + RGD).
In the MB231 + MSC, GFP–MSC isolated via FACS were then examined for expression of the CAF markers, αSMA tenascin-c, CXCL12 (or stromal cell-derived factor 1) and FSP-1 mRNA. (Figure 5B) When compared with MSC in culture, MSC co-implanted at the primary site and recovered by FACS demonstrated significantly increased expression of αSMA (5-fold), tenascin-c (9-fold), CXCL12 (5-fold) and FSP-1 (12-fold) (P < 0.01 for all markers). However, MSC recovered from liver and lung exhibited incrementally greater expression compared with the primary site. In the liver, αSMA, tenascin-c, CXCL12 and FSP-1 were increased 25-, 61-, 9- and 55-fold, respectively (P < 0.01 liver versus primary for all markers). In the lung, αSMA, tenascin-c, CXCL12 and FSP-1 were increased 14-, 48-, 8- and 40-fold, respectively (P < 0.01 lung versus primary for all markers). In the animals administered OPN-R3 APT, the expression of αSMA, tenascin-c, CXCL12 and FSP-1 in the primary, lung and liver sites was equivalent to or less than those of MSC from the primary site in the absence of APT. Administration of CCL5 with APT restored αSMA, tenascin-c, CXCL12 and FSP-1 to levels equivalent to that of MB231 + MSC alone.
We performed in vitro studies in which MSC were stimulated with OPN (5 nM) for 6 h (Figure 5C). The changes in mRNA expression parallel those found in the ex vivo studies described above; however, the changes were more modest. OPN stimulation of MSC increased αSMA, CXCL12, tenascin-c and FSP-1 mRNA levels by 1.5-, 1.6-, 3- and 2.5-fold (P < 0.05 versus CTRL). OPN-R3 APT decreased these OPN-stimulated changes, as a group, to levels equivalent to those of the CTRL group (P < 0.05). Addition of CCL5 with OPN and APT-restored mRNA levels similar to that found with OPN stimulation. In the presence of CCR5 Ab or αVβ3 integrin Ab, OPN did not increase levels of SMA, CXCL12, tenascin-c and FSP-1 mRNA. These results suggest that OPN binding to αVβ3 integrin and CCR5 binding of CCL5 are required for MSC expression of CAF markers. RT–PCR was performed for MMP-2 and MMP-9 expression (Figure 5D). OPN stimulation increased MSC expression of MMP-2 and MMP-9 by ∼8- and 5-fold (P < 0.01 versus unstimulated cells for MMP-2 and MMP-9). This increase was blocked by APT- and RGD-mediated cell surface integrin binding. Composite gel zymography was performed for MMP-2 and MMP-9 (Figure 5E). OPN stimulation increased MMP-2 and MMP-9 activity by 4- and 5-fold, respectively. This increase was again blocked by APT and RGD. These data indicate that OPN mediates MSC expression of CAF markers and functional expression of extracellular MMPs.
Discussion
In this study, we demonstrate that OPN interacts in vitro with MSC cell surface integrin receptors to upregulate CCL5 expression via AP-1 c-jun homodimer transactivation of the CCL5 promoter. In the context of cocultures of MSC with MDA-MB231 breast cancer cells-expressing OPN, CCL5 expression by MSC is significantly increased. The provision of the OPN-R3 APT ablates OPN-dependent CCL5 production by MSC. Using a murine xenograft model of MB231 and MB231 + MSC, co-inoculation of MSC significantly increases tumor growth and metastasis, serum CCL5 levels and migration of MSC to sites of metastasis. These are abolished by administration of OPN-R3 APT and reconstituted by coadministration of CCL5. In MB231 alone, the APT also significantly decreases growth and metastasis. Finally, when MSC were isolated by FACS from sites of metastasis, there was OPN- and CCL5-dependent expression of the CAF markers, αSMA, CXCL12, tenascin-c and FSP-1. We conclude that OPN potentiates tumor growth via interaction with MSC to upregulate expression of CCL5 and the CAF markers, αSMA, CXCL12, tenascin-c and FSP-1. These findings suggest a novel mechanism in which OPN regulates conversion of MSC into CAF to influence tumorigenesis.
It is recognized that tumorigenesis requires context-dependent interactions with the surrounding stroma(21). As the tumor progresses, the tissue architecture becomes disordered and the extracellular matrix is remodeled by the CAF/myofibroblast. Evidence indicates that CAF promote tumor growth, angiogenesis and metastases. The definition of CAF remains in evolution, but it is thought that expression of αSMA, CXCL12, tenascin-c and FSP-1 may characterize the CAF(22–24). Orimo et al. (25) further define CAF to include functional characteristics such as cancer growth, angiogenesis, expression of myfibroblast traits and production of SDF-1 (CXCL12). The origin of the CAF has not been not characterized. Four tentative models have been suggested by Shimoda(21). First, populations of residual mesenchymal cells may transdifferentiate into CAF/myofibroblasts. Second, circulating progenitor cells, such as MSC, are recruited into the tumor stroma. Third, a population of pre-existing myofibroblasts may be clonally expanded. Or, lastly, acquisition of genetic alterations, such as p53 loss, within a population of fibroblasts may allow clonal expansion. With regard to MSC as CAF progenitor cells, MSC are pluripotent cells that contribute to the homeostasis of bone, adipose, cartilage and muscle tissues and may serve as local sources of dormant stem cells (1). Mishra and coworkers exposed human bone marrow-derived MSC to conditioned media from MB231 cells and found that they exhibited myofibroblast differentiation as defined by increased expression of αSMA, CXCL12 and FSP-1(23). Spaeth et al. (26) used a model of xenograft ovarian cancer to demonstrate that CAF are derived from MSC as exemplified by the presence of FSP, fibroblast activated protein, tenascin-c, thrombospondin-1, hepatocyte growth factor and interleukin-6. In addition, they demonstrate that interleukin-6 derived from CAF/MSC can drive paracrine tumor growth through interleukin-6. CCL5 was not examined.
CCL5 has been previously characterized as a chemoattractant for stromal cells, including macrophages and increased tumor neovascularization via endothelial cell attraction(1,27). CCL5 promotes local tumor and macrophage MMP9 expression. Interestingly, in the Karnoub study, CCL5 did not promote epithelial–mesenchymal transition of MB231 breast cancer cells. While, CCL5 promoted lung metastases, it was not the result of pro-survival or anti-apoptotic functions; rather, it was promotion of extravasation and/or motility of the cancer cells at sites of disseminated metastases. In our study, OPN- and CCL5- dependent expression of CAF markers was found in the MSC extracted from sites of metastases.
The signaling pathway by which CAF develop in the tumor microenvironment is not well characterized. Finak et al. (28) utilized laser capture microdissection to compare gene expression profiles of tumor stroma from 53 primary breast cancers and developed a microarray based stroma-derived prognostic predictor algorithm. SPP1 (or OPN) was among the genes included in this set. The potential central role of OPN was also demonstrated in a study by McAllister et al. (15) in which activated bone –marrow-derived cells incorporate into tumor stroma of breast and colon cancers to instigate local growth and distant metastases. Secretion of OPN by the tumor is required for activation of these bone marrow cells. MSC trafficking and localization has been examined. Udagawa et al. (29) utilized a transgenic scid model in which the bone marrow was transplanted from GFP-expressing SCID mice. Lewis lung carcinoma cells were implanted, GFP+ cells were present in explanted tumors and metastases but in a spatially isolated and disorganized fashion. This is similar, by description, to our findings. In another study, Wang et al. (30) injected firefly luc-MSC via tail vein in a model of spontaneous metastasis using 4T1 murine breast cancer cells. These authors found that the MSC selectively localized and proliferated in both subcutaneous and lung metastases sites. In both studies, the signaling pathways were not addressed.
Our results coalesce these disparate but parallel streams of evidence into a model that centers on OPN. The potential role of OPN has been examined as a cancer biomarker, therapeutic target and central actor in the progression and metastases of a variety of cancers, including breast, liver, prostate and lung(19). However, its function in this setting remains ill defined. In other settings, OPN regulates fibrosis and wound healing, all of which may center around the interplay between OPN and MSC (or its local tissue equivalent) with subsequent transformation into the myofibroblast (or CAF)(14). We propose that tumor-derived OPN promotes tumor progression via transformation of MSC into CAF.
Supplementary material
supplementary Materials can be found at http://carcin.oxfordjournals.org/
Funding
National Institutes of Health (R01 GM065113, T32 GM069331, NIH UL1 RR024128); JJR Foundation grants to P.C.K.
Supplementary Material
Acknowledgments
Conflict of Interest Statement: None declared.
Glossary
Abbreviations
- AP-1
activator protein-1
- CAF
cancer-associated fibroblast
- CHIP
chromatin immunoprecipitation
- FACS
fluorescence activated cell sorting
- FSP
fibroblast-specific protein
- GFP
green fluorescent protein
- MMP
matrix metalloproteinase
- mRNA
messenger RNA
- MSC
mesenchymal stromal cell
- OPN
osteopontin
- PBS
phosphate-buffered saline
- RGD
Arg-Gly-Asp
- RT–PCR
reverse transcription–polymerase chain reaction
- siRNA
small interfering RNA
- αSMA
α-smooth muscle actin
References
- 1.Karnoub AE, et al. Mesenchymal stem cells within tumour stroma promote breast cancer metastasis. Nature. 2007;449:557–563. doi: 10.1038/nature06188. [DOI] [PubMed] [Google Scholar]
- 2.Pinilla S, et al. Tissue resident stem cells produce CCL5 under the influence of cancer cells and thereby promote breast cancer cell invasion. Cancer Lett. 2009;284:80–85. doi: 10.1016/j.canlet.2009.04.013. [DOI] [PubMed] [Google Scholar]
- 3.Denhardt DT, et al. Osteopontin-induced modifications of cellular functions. Ann. N. Y. Acad. Sci. 1995;760:127–142. doi: 10.1111/j.1749-6632.1995.tb44625.x. [DOI] [PubMed] [Google Scholar]
- 4.Denhardt DT, et al. Role of osteopontin in cellular signaling and toxicant injury. Annu. Rev. Pharmacol. Toxicol. 2001;41:723–749. doi: 10.1146/annurev.pharmtox.41.1.723. [DOI] [PubMed] [Google Scholar]
- 5.Weber GF, et al. Interaction between CD44 and osteopontin as a potential basis for metastasis formation. Proc. Assoc. Am. Physicians. 1997;109:1–9. [PubMed] [Google Scholar]
- 6.Denhardt DT, et al. Overcoming obstacles to metastasis-defenses against host defences: osteopontin as a chield against attack by sytotoxic host cells. J. Cell. Biochem. 1994;56:48–51. doi: 10.1002/jcb.240560109. [DOI] [PubMed] [Google Scholar]
- 7.Brown LF, et al. Osteopontin expression and distribution in human carcinomas. Am. J. Pathol. 1994;145:610–623. [PMC free article] [PubMed] [Google Scholar]
- 8.Agrawal D, et al. Osteopontin identified as lead marker of colon cancer progression, using pooled sample expression profiling. J. Natl Cancer Inst. 2002;94:513–521. doi: 10.1093/jnci/94.7.513. [DOI] [PubMed] [Google Scholar]
- 9.Coppola D, et al. Correlation of osteopontin protein expression and pathological stage across a wide variety of tumor histologies. Clin. Cancer Res. 2004;10:184–190. doi: 10.1158/1078-0432.ccr-1405-2. [DOI] [PubMed] [Google Scholar]
- 10.Das R, et al. Osteopontin stimulates cell motility and nuclear factor kappaB-mediated secretion of urokinase type plasminogen activator through phosphatidylinositol 3-kinase/Akt signaling pathways in breast cancer cells. J. Biol. Chem. 2003;278:28593–28606. doi: 10.1074/jbc.M303445200. [DOI] [PubMed] [Google Scholar]
- 11.Fedarko NS, et al. Elevated serum bone sialoprotein and osteopontin in colon, breast, prostate, and lung cancer. Clin. Cancer Res. 2001;7:4060–4066. [PubMed] [Google Scholar]
- 12.Gotoh M, et al. Overexpression of osteopontin in hepatocellular carcinoma. Pathol. Int. 2002;52:19–24. doi: 10.1046/j.1440-1827.2002.01316.x. [DOI] [PubMed] [Google Scholar]
- 13.Grano M, et al. HGF and M-CSF modulate adhesion of MDA-231 breast cancer cell by increasing osteopontin secretion. J. Biol. Regul. Homeost. Agents. 2002;16:190–195. [PubMed] [Google Scholar]
- 14.Wai PY, et al. The role of Osteopontin in tumor metastasis. J. Surg. Res. 2004;121:228–241. doi: 10.1016/j.jss.2004.03.028. [DOI] [PubMed] [Google Scholar]
- 15.McAllister SS, et al. Systemic endocrine instigation of indolent tumor growth requires osteopontin. Cell. 2008;133:994–1005. doi: 10.1016/j.cell.2008.04.045. [DOI] [PMC free article] [PubMed] [Google Scholar]
- 16.Bramwell VH, et al. Serial plasma osteopontin levels have prognostic value in metastatic breast cancer. Clin. Cancer Res. 2006;12:3337–3343. doi: 10.1158/1078-0432.CCR-05-2354. [DOI] [PubMed] [Google Scholar]
- 17.Mi Z, et al. RNA aptamer blockade of osteopontin inhibits growth and metastasis of MDA-MB231 breast cancer cells. Mol. Ther. 2009;17:153–161. doi: 10.1038/mt.2008.235. [DOI] [PMC free article] [PubMed] [Google Scholar]
- 18.Keng PC, et al. Evaluation of cell subpopulations isolated from human tumor xenografts by centrifugal elutriation. Int. J. Radiat. Oncol. Biol. Phys. 1990;18:1061–1067. doi: 10.1016/0360-3016(90)90441-l. [DOI] [PubMed] [Google Scholar]
- 19.Wai PY, et al. Osteopontin: regulation in tumor metastasis. Cancer Metastasis Rev. 2008;27:103–118. doi: 10.1007/s10555-007-9104-9. [DOI] [PubMed] [Google Scholar]
- 20.Nelson PJ, et al. Genomic organization and transcriptional regulation of the RANTES chemokine gene. J. Immunol. 1993;151:2601–2612. [PubMed] [Google Scholar]
- 21.Shimoda M, et al. Carcinoma-associated fibroblasts are a rate-limiting determinant for tumour progression. Semin. Cell Dev. Biol. 2009;21:19–25. doi: 10.1016/j.semcdb.2009.10.002. [DOI] [PMC free article] [PubMed] [Google Scholar]
- 22.Ostman A, et al. Cancer-associated fibroblasts and tumor growth–bystanders turning into key players. Curr. Opin. Genet. Dev. 2009;19:67–73. doi: 10.1016/j.gde.2009.01.003. [DOI] [PubMed] [Google Scholar]
- 23.Mishra PJ, et al. Carcinoma-associated fibroblast-like differentiation of human mesenchymal stem cells. Cancer Res. 2008;68:4331–4339. doi: 10.1158/0008-5472.CAN-08-0943. [DOI] [PMC free article] [PubMed] [Google Scholar]
- 24.Muehlberg FL, et al. Tissue-resident stem cells promote breast cancer growth and metastasis. Carcinogenesis. 2009;30:589–597. doi: 10.1093/carcin/bgp036. [DOI] [PubMed] [Google Scholar]
- 25.Orimo A, et al. Cancer-associated myofibroblasts possess various factors to promote endometrial tumor progression. Clin. Cancer Res. 2001;7:3097–3105. [PubMed] [Google Scholar]
- 26.Spaeth EL, et al. Mesenchymal stem cell transition to tumor-associated fibroblasts contributes to fibrovascular network expansion and tumor progression. PLoS One. 2009;4:e4992. doi: 10.1371/journal.pone.0004992. [DOI] [PMC free article] [PubMed] [Google Scholar]
- 27.Azenshtein E, et al. The CC chemokine RANTES in breast carcinoma progression: regulation of expression and potential mechanisms of promalignant activity. Cancer Res. 2002;62:1093–1102. [PubMed] [Google Scholar]
- 28.Finak G, et al. Stromal gene expression predicts clinical outcome in breast cancer. Nat. Med. 2008;14:518–527. doi: 10.1038/nm1764. [DOI] [PubMed] [Google Scholar]
- 29.Udagawa T, et al. Analysis of tumor-associated stromal cells using SCID GFP transgenic mice: contribution of local and bone marrow-derived host cells. FASEB J. 2006;20:95–102. doi: 10.1096/fj.04-3669com. [DOI] [PubMed] [Google Scholar]
- 30.Wang H, et al. Trafficking mesenchymal stem cell engraftment and differentiation in tumor-bearing mice by bioluminescence imaging. Stem Cells. 2009;27:1548–1558. doi: 10.1002/stem.81. [DOI] [PMC free article] [PubMed] [Google Scholar]
Associated Data
This section collects any data citations, data availability statements, or supplementary materials included in this article.