Abstract
Objective
Tumor-associated neoangiogenesis (TAN) is one of the earliest events in ovarian tumor growth and represents a potential target for early detection of ovarian cancer (OVCA). Because it is difficult to identify patients with early stage OVCA, the goal of this study was to explore a spontaneous animal model of in vivo ovarian TAN associated with early-stage OVCA detectable by Doppler ultrasound (DUS).
Methods
White Leghorn laying hens were scanned transvaginally at 15-week intervals up to 45 weeks. Gray scale ovarian morphologic characteristics and Doppler indices were recorded. Hens were euthanized at diagnosis for ultrasonographic morphologic/vascular abnormalities or at the end of the study (those that remained normal). Ovarian morphologic and histologic characteristics were evaluated. Vascular endothelial growth factor (VEGF) and αvβ3-integrins expression was assessed by immunohistochemistochemical analysis. Doppler ultrasonographic observations were compared with histologic and immunohistochemistochemical findings to determine the ability of DUS to detect ovarian TAN.
Results
Significant changes in ovarian blood flow parameters were observed during transformation from normal to tumor development in the ovary (P<0.05). Tumor-related changes in ovarian vascularity were identified by DUS before the tumor became detectable by gray scale. Increased expression of VEGF and αvβ3-integrins was associated with tumor development. Ovarian TAN preceded tumor progression in hens.
Conclusions
The results suggest that ovarian TAN may be an effective target for the detection of early-stage OVCA. The laying hen may also be useful to study the detection and inhibition of ovarian TAN using various means including the efficacy of contrast agents, targeted molecular imaging and antiangiogenic therapies.
Keywords: Doppler ultrasonography, early detection, ovarian cancer ovarian neoangiogenesis, spontaneous animal model
Ovarian cancer (OVCA) remains a fatal malignancy of women and is responsible for the third highest rate of mortality due to gynecological cancers, after breast and cervical cancers.1 In contrast to OVCA, the availability of early-detection tests for other gynecological malignancies including breast and cervical cancers, has contributed in part to the gradual decline in death rates due to these malignancies.1 Because of the lack of an effective screening tool or an early diagnostic method, it is difficult to detect OVCA at an early stage, and, in most cases, it is detected at late stages, when the 5-year survival rate of patients is less than10% as compared with greater than 90% when detected at early stages.2, 3 The non-specificity of OVCA symptoms at early stages reduces the accessibility to a patient’s specimens. It is therefore difficult to validate potential targets for early diagnosis and to establish an effective method to detect that targets.4 Consequently, this represents one of the main obstacles to the development of an early-detection test for OVCA.
Substantial studies have been described, involving 3 different approaches to develop an effective early-detection test for OVCA, including a serum marker (Cancer Antigen 125[CA-125), traditional transvaginal ultrasounography(TVUS) and their combination. 5, 6 Although circulating levels of CA-125 have proven useful in determining prognosis and response to treatment for patient undergoing chemotherapy, elevated CA-125 levels are also associated with many benign gynecologic conditions. In addition to mucinous OVCA in which elevation of CA-125 level is less frequent, 20% patients with OVCA do not show elevated CA-125 levels. 7 On the other hand, the effectiveness of the Doppler indices (Resistive Index [RI and Pulsatility Index [PI]) from TVUS has been tested extensively to detect early-stage OVCA in humans without any success because of due to limited resolution and overlap between normal and abnormal indices. Improvement in the overall level of OVCA detection was not observed even with the use of TVUS together with CA-125 because no imaging target in the ovary (indicative of early OVCA-associated morphologic or cellular changes) corresponding to serum CA-125 level has been defined. Therefore, appropriate changes the in ovarian morphologic, cellular or molecular architecture associated with early stage OVCA need to be identified.
Tumor- associated neoangiogenesis (TAN) is one of the earlier events in tumor development. Similar to cancer of other organs, neoangiogenesis is an early event in ovarian malignancy and is a critical determinant of tumor growth, invasion, progression and metastatic potential.8, 9 Therefore, ovarian TAN represents a potential target for early detection of OVCA and non-invasive diagnostic techniques to assess in vivo TAN are needed to detect OVCA at an early stage. Ultrasonography is the currently recommended non-invasive method for the evaluation of ovarian abnormalities, but the difficulty in diagnosing early-stage OVCA impedes conducting of studies to improve the ability of Doppler ultrasonography (DUS) to detect early-stage OVCA in humans. Animal models have been useful for preclinical testing of diagnostic paradigms 10 but the often used rodent models of OVCA do not develop OVCA spontaneously, and the histopathologic characteristics of induced OVCA differs from spontaneous OVCA in humans. 10, 11 Laying hens (Gallus domesticus) develop OVCA spontaneously 12, 13 with similarities to human OVCA in histopathologic characteristics 12, 13 and expression of several markers. The objective of this study was to examine the suitability of ovarian TAN as an in vivo detection target of early-stage OVCA by DUS and to further explore the feasibility of the laying hen as a preclinical model to elucidate the ovarian vascular changes relative to OVCA development.
Materials and Methods
Animals
A flock of 110 commercial strains of White Leghorn laying hens (G. domesticus) was reared under standard poultry husbandry practices with the provision of feed and water ad libitum. Egg production and mortality rates of hens (if any) were recorded daily. On the basis of egg laying rates and ultrasound scan, 3-year old apparently healthy hens with low or irregular egg-laying rates (n=15) were selected from the flock to monitor prospectively. The incidence of OVCA in laying hens of this age group is approximately 15–20% and is associated with low or complete cessation of egg-laying. A low egg-laying rate indicates reduced ovarian function, and hens that lay 50% less eggs than their peers are considered to have abnormal ovarian function. The normal rate egg-laying rate for a commercial laying hen is more than 250 eggs/year and less than 50% of normal laying rate is considered a low egg-laying rate.
Ultrasound scanning
Hens were scanned by TVUS (both B-mode and Doppler) as reported previously 14 and hens with apparently normal health without any sonographic ovarian abnormality were selected for the study. All hens with suspected ovarian abnormalities by gray scale ultrasonography were excluded from prospective monitoring, and euthanized immediately, and ovarian tissues were processed for routine histologic and immunohistochemical evaluations. All procedures were performed according to Institutional Animal Care and Use Committee-approved guidelines. After initial scan, hens were monitored by gray scale ultrasonography and DUS at 15, 30 and 45 weeks using an instrument equipped with a 5 to7.5-MHz endovaginal transducer (Z.one ultrasound system; Zonare Medical Systems, Inc, Mountain view, CA). Briefly, each hen was immobilized by placing the breast up with the legs gently restrained by an assistant. Transmission gel was applied to the surface of the transducer which was then covered with a probe cover and gel was reapplied to the covered probe to ensure uninterrupted conductance of the sound waves. The transducer was inserted (transvaginally) approximately at a 30° angle to the body and 3 to 5 cm into the cloaca (place of vaginal opening). Two-dimensional transvaginal gray scale ultrasonography and color and pulsed DUS were performed. Young egg-laying hens (the ovaries of these hens contain more developing eggs compared with old hens) were used as standard controls for mechanical adjustment to reveal and characterize the fully functional normal ovary. The laying hen contains one functional (left ovary) and the region surrounding the ovary was scanned. Once the ovary was located, the transducer was swept through the entire area for complete scanning of the ovary. Gray scale B-mode morphologic evaluation of the ovary was performed with attention to the follicular development and the presence of any abnormality including cysts, septations, papillary projections or solid areas, and variation in echogenicity.
After morphologic evaluation, the color Doppler mode was activated for identification of vascular color signals. If blood flow was detected, it was shown as either “peripheral” (color signals in the ovarian periphery) or “central” (blood flow detected in septa, papillary projections, or solid areas). Once a vessel was identified on color Doppler imaging, the pulsed Doppler gate was activated to obtain a flow velocity waveform. The resistive index (RI; [systolic velocity – diastolic velocity]/systolic velocity) and the pulsatility index (PI; [systolic velocity – diastolic velocity]/mean) were automatically calculated from at least 2 consecutive samples, and the average RI and PI values were used for analysis. In the stroma of hens with normal ovaries, high blood flows with prominent vascular areas were observed on the surface of developing preovulatory follicles, and data from these areas were excluded from the study. In addition to the blood flow patterns mentioned above, abnormal ovarian Doppler patterns (suggestive of ovarian TAN) were characterized by evaluating intratumoral blood flow and RI and PI values. Hens with higher intra-tumoral blood flow as well as lower RI and PI values than their normal counter parts were predicted to have ovarian TAN. All images were processed and archived for future reference.
Ovarian Morphologic and Histologic Evaluations
All hens were euthanized at diagnosis for ovarian TAN or at the end of the study and gross ovarian morphologic specimens were examined, recorded, compared with sonographic evaluations, and photographed. Normal ovarian function was judged on the basis of the number of large preovulatory follicles (described in detail previously 15) without any ovarian abnormality such as a cyst or solid mass. Abnormal ovaries were characterized by the presence of cysts, a shrunken ovarian volume, or a higher number of bloody, discolored, involuted or atretic small and pearlike follicles. Tumor staging was performed as reported previously15, and the early stage of ovarian tumors was characterized by a detectable solid tissue mass within the ovary followed by histological observation. Ovarian tissues were fixed in buffered formalin or OCT compound and snap frozen as reported previously. To detect microscopic OVCA lesions in any part of the ovary, the whole ovary was sampled. The tissue blocks were sectioned (5µm for paraffin and 10µm for frozen). Sections from each tissue block (paraffin or frozen) were stained with hematoxylin-eosin and observed under a light microscope to determine the microscopic features, including tumor lesions and types, and compared with the ultrasonographic evaluations.
Immunohistochemical Analysis
Tissue expression of TAN markers including the vascular endothelial growth factor (VEGF) and αvβ3-integrins was examined by routine immunohistochemical analysis to assess angiogenesis using Rabbit polyclonal anti-human VEGF (Abcam Inc., Cambridge, MA) and mouse anti-human αvβ3-integrins (CD51/CD61, clone 23C6, Biolegend, San Diego, CA) according to the manufactures protocol. The densities of VEGF and αvβ3-integrins positive microvessels were counted from the tumor vicinity or stroma of normal hens (excluding the follicular areas) using a light microscope attached to a digital imaging stereological software (MicroSuite version 5; Olympus Corporation, Tokyo, Japan) and are expressed as the number of positive vessels in 20,000µm2 area of the normal or tumor ovary. The index for TAN (angiogenesis index [AI]) was calculated for hens with early- and -late stage OVCA as a ratio of the frequencies of VEGF expressing vessels to that in normal ovaries (number of ovarian VEGF-expressing microvessels in each tumor hen/average of ovarian VEGF-expressing microvessels in normal hens. The AI for normal ovary is considered to be 1).
Statistical Analysis
Differences in ultrasonographic measurements between two scans of the same group of hens were analyzed by paired sample t tests. Differences between two groups (normal and OVCA) of hens (for ultrasound indices and the number of microvessels positive for angiogenic markers) were analyzed by 2-sample t tests and Mann-Whitney tests. All reported P values are 2-sided and P <0.05 was considered significant. Statistical analyses were performed in SPSS Version 15 (SPSS Inc, Chicago, IL).
Results
Gray Scale Ultrasonography
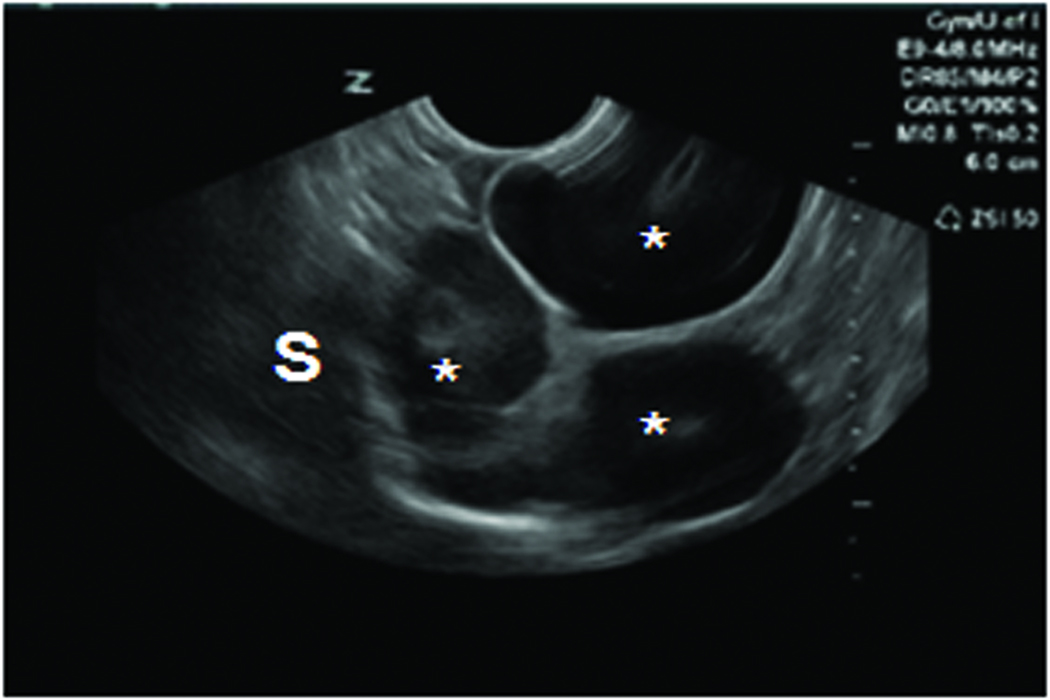
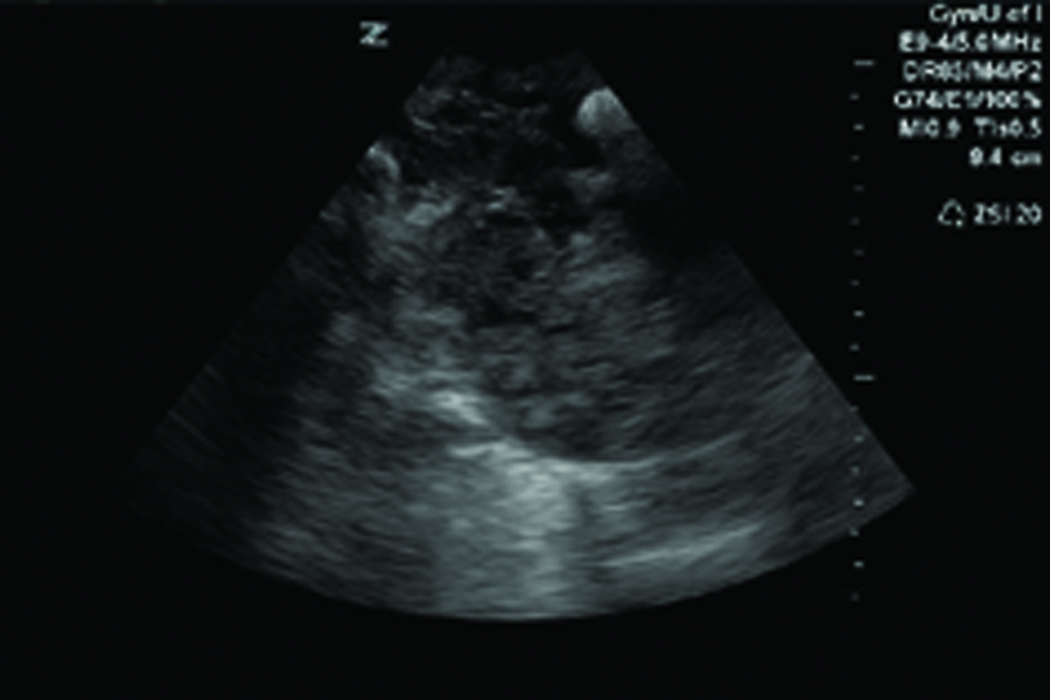
No significant changes were detected in the ovarian morphologic characteristics of hens at the second scan (15 weeks from the initial scan) by gray scale ultrasonography. Similar to initial scan, all hens had a normal appearing ovary containing 2–3 preovulatory follicles with developing eggs at the second scan, 15weeks from initial scan (Figure 1A). At the third scan, 30 weeks from the initial scan, significant changes in the gray scale ovarian morphologic characteristics were observed in 4 out of 15 hens (Figure 1C), including the absence of preovulatory large follicles with the appearance of solid tissue masses. However, no such changes were observed in the ovaries of the remaining 11 hens. At the final scan (45 weeks from initial scan) 5 of the remaining 11hens developed ovarian abnormalities with no detectable large preovulatory follicles.
Figure 1.
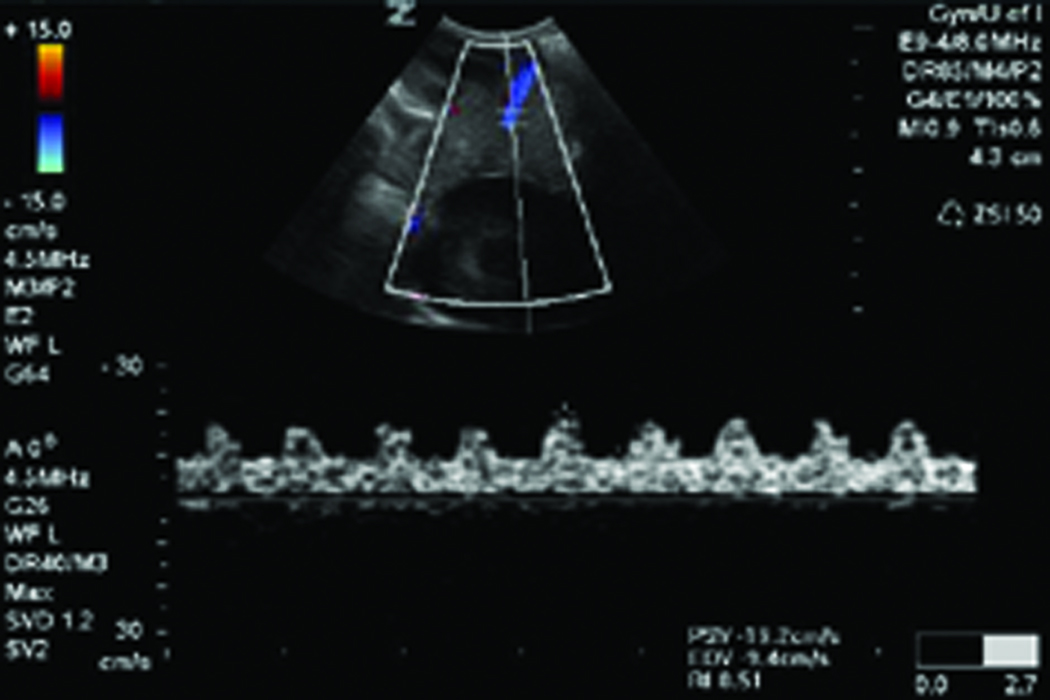
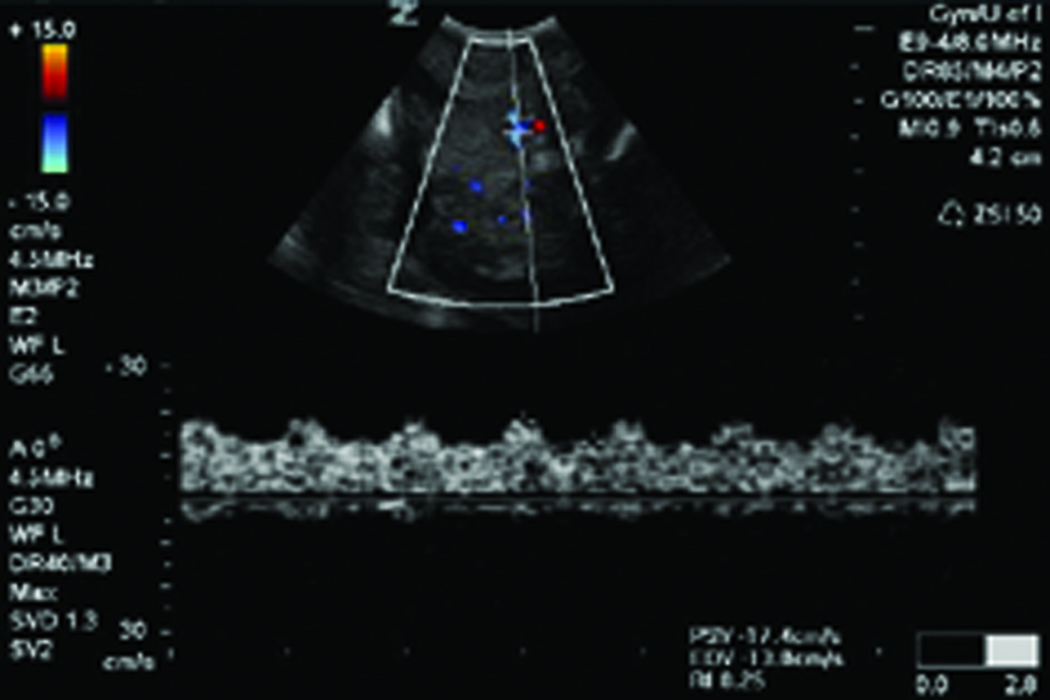
Changes in ovarian morphologic characteristics with blood flow patterns leading to tumor development in laying hens. A, Gray scale sonogram of a normal hen ovary at second scan (15 weeks after first scan). The presence of multiple preovulatory follicles (asteriks) of various sizes with no solid mass indicates the functionally normal ovary. B, Doppler sonogram of the same ovary imaged in A showing blood flows on the follicular wall of the larger preovulatory as well as small stromal follicles, suggesting active follicular growth in the ovary. C, Gray scale sonogram of the ovary of same hen shown in A at third scan (after 30 weeks from first scan). No developing follicle is seen and the ovary appears to have solid tissue masses indicating abnormal morphologic characteristics suggestive of ovarian tumor. D, Doppler sonogram of the same ovary shown in C. A central pattern of blood flow is seen on the solid ovarian mass, suggesting the presence of ovarian tumor. EDV indicates end-diastolic velocity; PSV, peak systolic velocity; and S, stroma.
Doppler Ultrasonography and Detection of Ovarian TAN
The blood flow patterns at initial scan were located in ovarian “periphery” mostly on the surface of large preovulatory follicles and small growing follicles in the stroma of hens with normal ovarian morphologic characteristics selected for prospective monitoring. Confluent blood flow in areas surrounding the small developing follicles and the wall of the larger preovulatory follicles was observed in these hens. Although no detectable change in ovarian morphologic characteristics was identified (by gray scale mentioned above), blood flow patterns changed from peripheral to a mixture of peripheral (on the surface layer of large ovarian follicles) and central at the second scan (after 15 weeks) (Figure 1B) in 6 hens. In the 9 hens, values of RI (mean = 0.42 ± 0.03) and PI (mean = 0.54 ± 0.07) values at the second scan were significantly lower compared with the initial scan (mean RI= 0.52 ± 0.05, mean PI= 0.70 ± 0.1) (P < 0.001 for both RI and PI based on paired sample t tests) (Table 1). At the third scan, with the changes in gray scale morphologic characteristics (including the reduction in the number of detectable follicles and appearance of solid tissue masses), flow patterns changed from “mixed to central” in these hens (Figure 1D). The RI and PI in these hens decreased further from the second to third scan (mean RI= 0.32 ± 0.09, mean PI= 0.40 ± 0.11) (P < 0.008 and 0.005 for RI and PI, respectively, based on paired sample t tests) (Table 1). The ovaries of the remaining 6 hens had a normal appearance on DUS scan throughout the monitoring period (mean RI= 0.56 ± 0.08, range = 0.47–0.69; mean PI= 0.84 ± 0.2, range = 0.63–1.21). Thus 9 of 15 hens showed changes in the patterns of their ovarian blood flow and were suspected to have ovarian TAN by 45 weeks from the initial scan.
Table1.
Changes in DUS indices in Association With the Development of Ovarian TAN in a Laying hen Model of Spontaneous OVCA (n = 9 hens)
| Parameters | 1st scan (Initial scan) |
2nd scan (after 15 weeks) |
P value (between 2nd and 1st scan) |
3rd scan (after 30 weeks) |
P value (between 2nd and 3rd scan) |
|||
|---|---|---|---|---|---|---|---|---|
| Range | Mean ± SD | Range | Mean ± SD | Range | Mean ± SD | |||
| Resistive Index (RI) | 0.43–0.60 | 0.52 ± 0.05 | 0.36–0.46 | 0.42 ± 0.03 | P < 0.001 | 0.18–0.48 | 0.32 ± 0.09 | P < 0.008 |
| Pulsatile Index (PI) | 0.56–0.84 | 0.70 ± 0.1 | 0.42–0.62 | 0.54 ± 0.07 | P < 0.001 | 0.21–0.54 | 0.40 ± 0.11 | P < 0.005 |
Ovarian Morphologic and histologic caracteristics
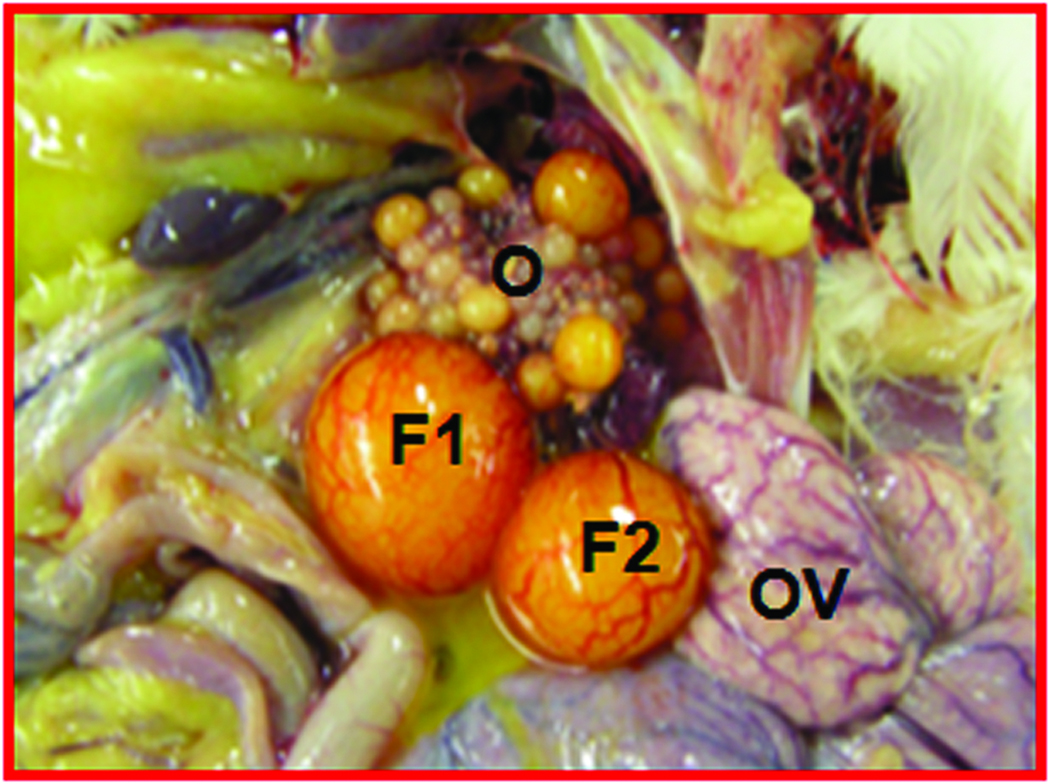
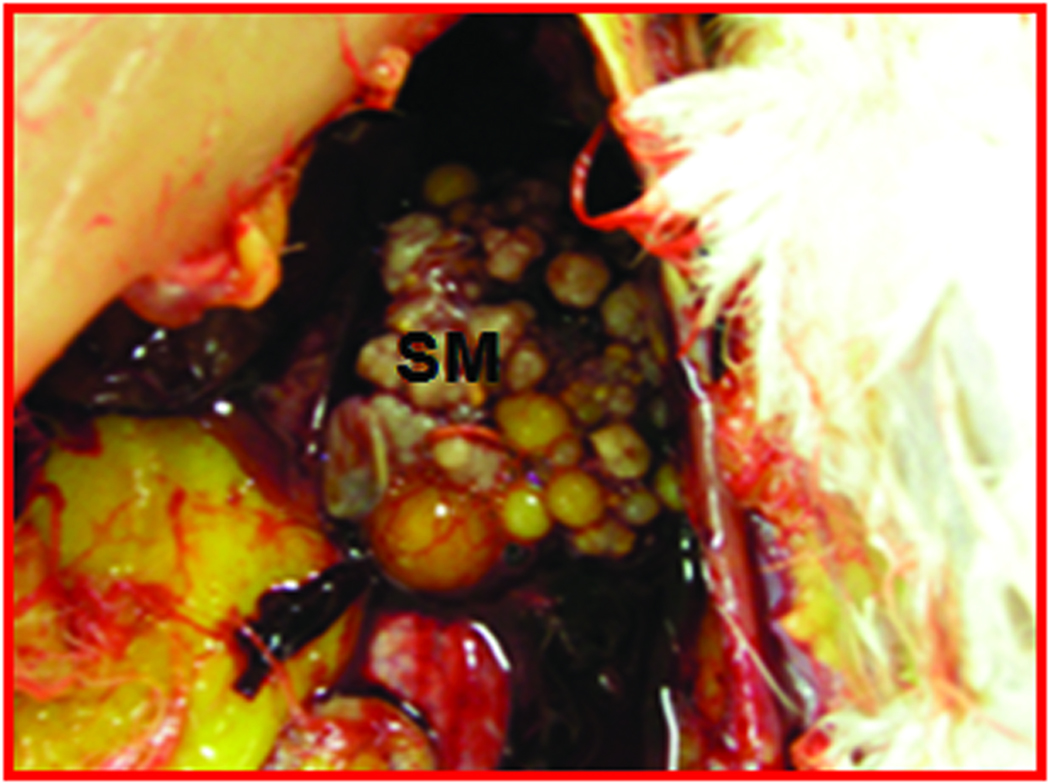
Gross ovarian morphologic findings were consistent with the ultrasonographic observations. No detectable tissue mass was found in 6 hens predicted to have normal ovarian morphologic characteristics and vascularity by gray scale ultrasonography and DUS, respectively at final scan at 45 weeks (Figure 2A). In contrast, hens with the diagnosis of ovarian TAN and tumor- related morphologic characteristics during or at the end of the study on ultrasonography had tumor related solid tissue masses (Figure 2C). These hard and solid tissue masses were found to be limited in 1 or 2 areas of the ovary only, although other parts were normal. In addition, no accompanying ascites was found at euthanasia.
Figure 2.
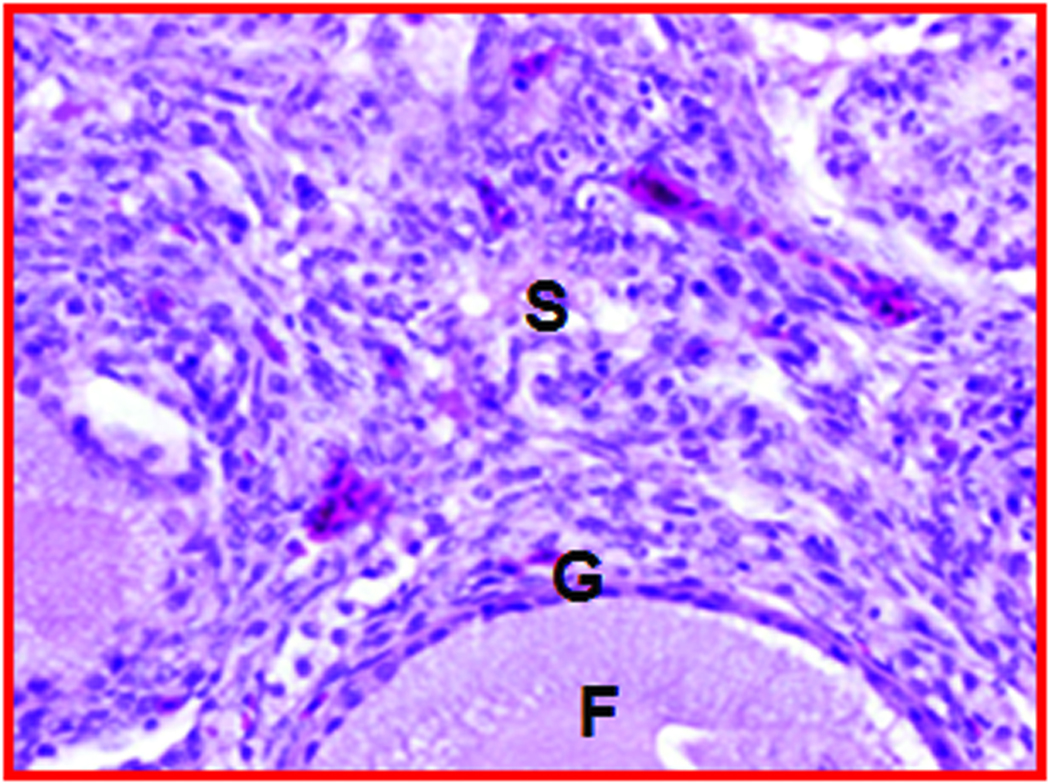
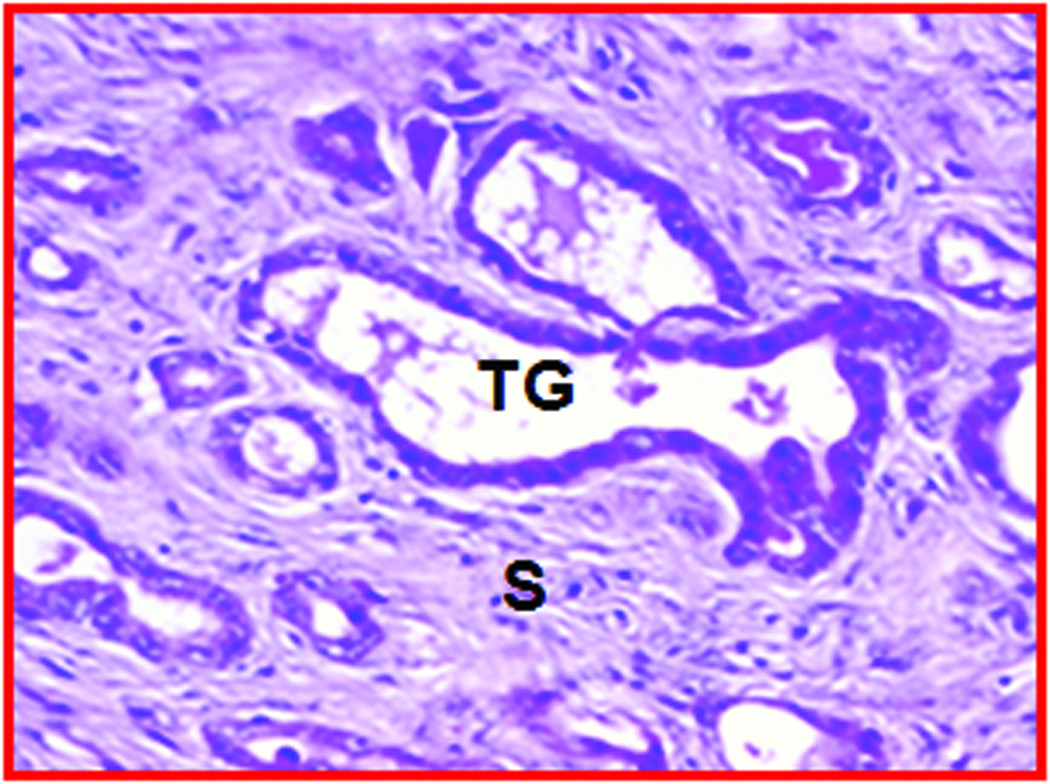
Gross and microscopic appearance of a normal and an early-stage ovarian tumor in laying hens. The predicted presence of ovarian TAN by ultrasonography was confirmed by gross and histologic examination after euthanasia. A, Normal hen ovary showing preovulatory follicles (developing eggs). B, ovarian stroma of the same hen containing embedded follicles (paraffin section stained with hematoxylin-eosin; original magnification X100). C, Ovary showing a solid tumor mass (early stage without ascites). D, Corresponding paraffin section stained with hematoxylin-eosin showing confluent tumor glands in the stroma; original magnification X100). F indicates follicle; G, granulosa layer; O, ovary; OV, oviduct; S, stroma: SM, solid mass; TG, tumor gland.
Histologic evaluation confirmed the presence of ovarian tumors (Figure 2D) in 9 hens suspected to have ovarian TAN and tumor-related hardened tissue mass as detected by DUS and gross morphologic characteristics. Glandular tumor structures containing a single layer of epithelial cells or lace-like papillary projections or glands with secretory ciliated goblet cells as well as many blood vessels of different sizes were seen in hens with the diagnosis of ovarian TAN (Figure 2D). However, such tumor-associated microscopic features, together with hyperplasia and dysplasia were also found by histologic examinations in 3 additional hens that were not suspected to have TAN by ultrasonography. Thus, out of 15 hens, 9 had DUS-detectable ovarian TAN and small tumor masses, 3 had microscopic tumor lesions that remained undetectable by DUS monitoring up to 45 weeks. In contrast, no such change was detected in 3 of the remaining 6 hens that appeared normal at the end of 45 weeks of monitoring (Figure 2B).
Expression of Angiogenic Markers
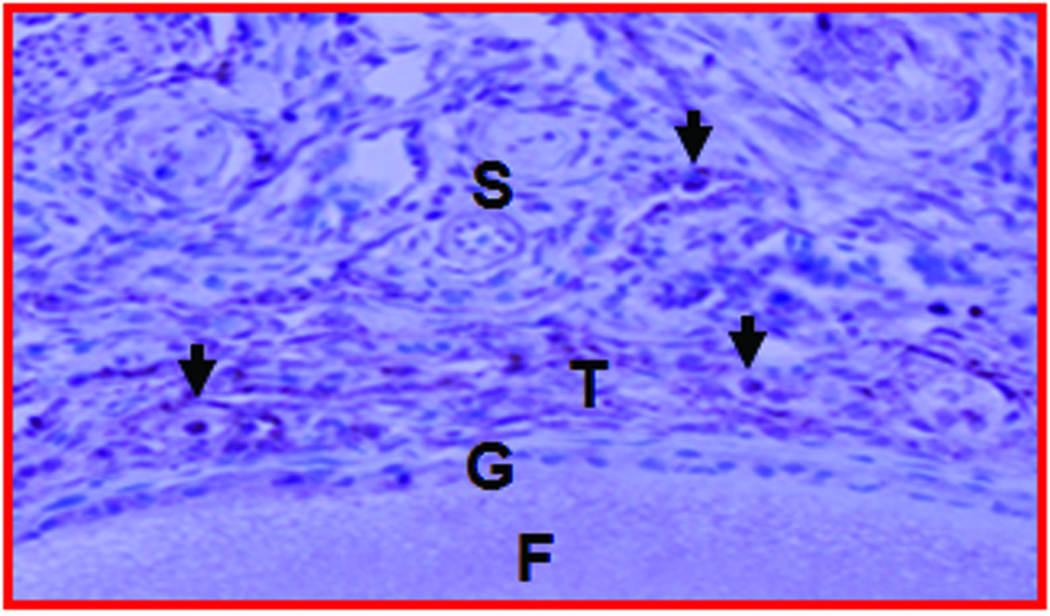
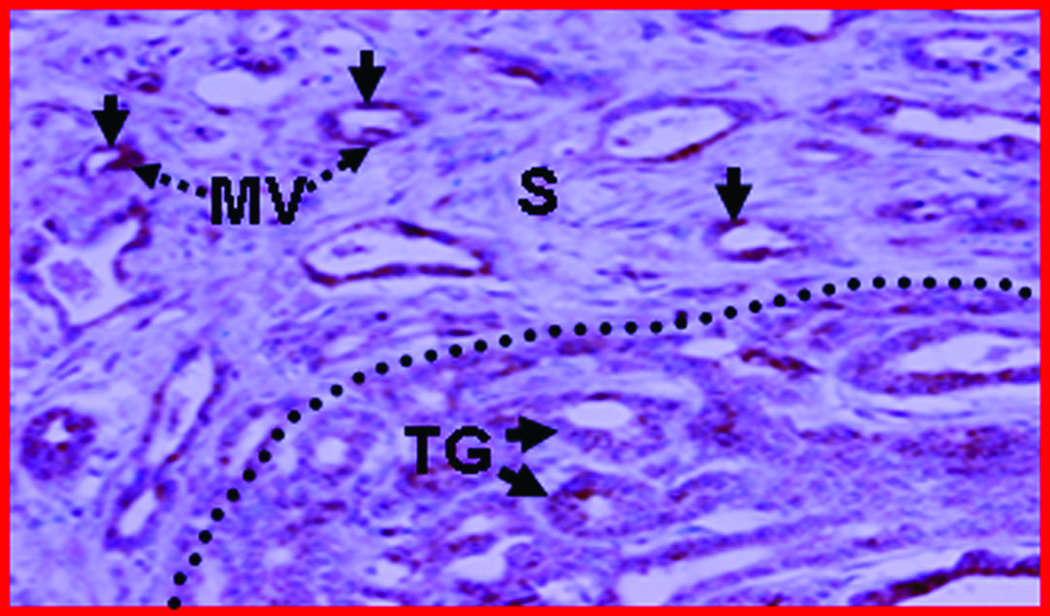
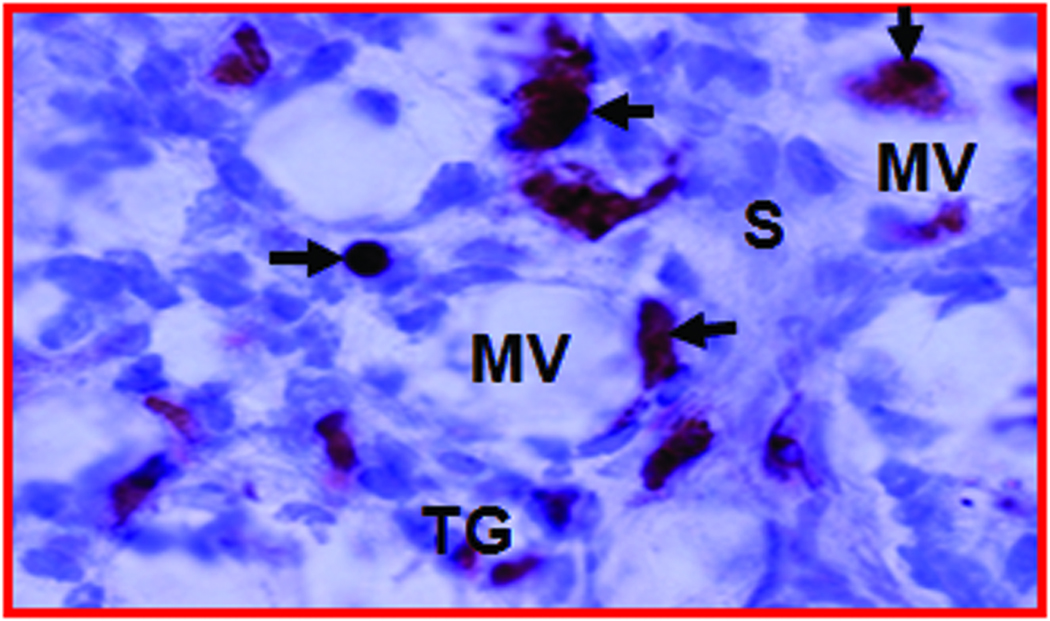
Intense staining for VEGF was observed in the tumor epithelium and microvessels at the tumor vicinity in hens suspected to have ovarian TAN and subsequently diagnosed for early-stage OVCA by histologic evaluations (Figure 3B, dotted line). In addition to the tumor vicinity, many microvessels expressing VEGF were also seen in the stroma preceding tumor glands (Figure-3B). Similar patterns were also observed for αvβ3-integrin expression in tumor glands as well as stromal blood vessels (Figure 3C). These immunopositive microvessels appeared to be leaky without any well organized continuous smooth muscle layer surrounding them and stained intermittently. In normal ovaries, immunopositive vessels were seen in and around the developing stromal follicles with very few in the stroma outside the follicles (Figure 3A). The frequency of ovarian VEGF-expressing microvessels was significantly higher (P < 0.002, from Mann-Whitney Exact test) in hens with TAN (mean 3.7 ± 0.58, 6.89 ± 0.73 and 9.8 ± 1.1 microvessels/20,000µm2 area of the ovarian tumor tissues in microscopic, early-stage and late-stage OVCA, respectively) than normal hens (mean 2.4 ± 0.51 microvessels/20,000µm2 of the ovarian tissues). Similar trends were also observed in the frequency of ovarian αvβ3-integrin positive vessels with respect to the different OVCA stages. The AI for early-stage OVCA was significantly higher than in hens with normal ovary (2.83 vs 1, P <0.01, Mann-Whitney Exact test). The AI was highest in hens with late-stage OVCA (4.08 vs 1, P <0.04, hens that had a diagnosis of late-stage OVCA at first scan and euthanized immediately instead of prospective monitoring). Tumor volumes were not examined in this study; hence no correlation between tumor size and the Doppler intensity was evaluated. However, Doppler signals were significantly lower with advancing tumor stages. Moreover, we evaluated the correlation between abnormal versus normal Doppler patterns and immunohistochemical findings, and tissue expression of angiogenic markers and AI values were inversely correlated (r = −0.90 and −0.88 for RI and PI values, respectively) to Doppler indices (the higher the AI, the lower the RI and PI) indicating that establishment of ovarian TAN is associated with increase in blood flow to the tumor vicinity.
Figure 3.
Expression of neoangiogenic markers in hen ovaries predicted to be normal and with ovarian TAN by ultrasonography. A, Section showing normal vasculature with few VEGF stained vessels in the follicular theca and stroma of a hen monitored prospectively by ultrasonography up to 45 weeks (from the hen shown in Figure 2A; original magnification 40X). B, Ovarian section of hen suspected to have ovarian TAN by ultrasonography (from the hen shown in Figure 2C; original magnification 40X). In contrast to A, many microvessels and the tumor epithelium expressed VEGF with high intensity. More VEGF expressing microvessels are seen in the tumor vicinity and in the stroma preceding tumors (separated by an imaginary dotted line). The numbers of VEGF-expressing microvessels in hens suspected to have ovarian TAN are negatively correlated to their ovarian Doppler indices (RI and PI; see “Materials and Methods” for detail analysis. Furthermore, the pattern of localization of VEGF-positive vessels in TAN-diagnosed hens suggests that ovarian TAN precedes tumor progression and is associated with decline in Doppler indices. C, Frozen ovarian section of a hen with ovarian tumor (shown in Figure 2C) immunostained for αvβ3-integrins (original magnification X100). αvβ3-integrins are expressed in the microvessels. F indicates follicle; G, granulosa layer; MV, microvessels; S, stroma; T, theca layer of stromal follicle (F); TG, tumor glands. Arrows indicate the examples of immunopositive vessels (A–C) and arrow heads indicate examples of immunopositive tumor glands (B and C).
Discussion
To our knowledge, a study reporting the detection of ovarian TAN during the early stage of the disease by gray scale ultrasonography and DUS in an animal model of human spontaneous OVCA has not been reported previously. This study revealed that ovarian TAN is initiated after the neoplastic cellular transformation in the ovary even before the tumor becomes detectable by traditional TVUS. The results of this study suggest that ovarian TAN can be a potential target for the detection of early-stage OVCA by non-invasive ultrasonography if its current detection limit can be improved. Because of the difficulty in identifying patients at early-stage of OVCA, the laying hen model can be used to study methods to enhance the detectability of early-stage OVCA on ultrasonography.
The fatality of OVCA is due in part to the lack of a reliable and effective early-detection method. A plethora of serum tumor markers have been reported, and given the heterogeneity of OVCA in different women, none of these markers are routinely effective in detecting early-stage OVCA.7 Moreover, the association of any of these makers with the early tumor-related changes in ovarian morphologic characteristics has not been reported. Furthermore, despite extensive efforts, the use of CA-125, with or without ultrasonography, to detect early-stage OVCA remains ineffective.[7] Use of a morphologic index of the architectural features of ovarian neoplasms on pelvic ultrasound to predict a probability of ovarian malignancy without the use of CA-125 has been shown to have positive predictive values of up to 0.45.16 However, this morphologic index requires information on tumor parameters including tumor size and the presence of ascites (which in most cases is associated with advanced OVCA), to effectively predict tumor malignancy. Consequently, this method is unable to detect early-stage OVCA. Previous studies reported the expression of VEGF and αvβ3-integrins by tumor epithelia and blood vessels in patients with OVCA patients 9. Similarly, these markers of ovarian TAN were also detected in hens with early and late stage OVCA. In addition, in hens with early-stage OVCA (including hens in which tumor were not detected by DUS), the expression of VEGF and αvβ3-integrins by many blood vessels in the tumor vicinity (Figure 3B and C) as well as in the stroma adjacent to the tumor, suggest that ovarian TAN precedes tumor progression. Thus, ovarian TAN represents an effective target for the detection of early-stage OVCA if it can be detected. Because it is difficult to study patients with early-stage OVCA, laying hens can be used to determine the ultrasonographic parameters indicative of early-stage OVCA-related neoangiogenesis.
Doppler ultrasonography is related to the vascular architecture of a tissue and is currently an accepted method for in vivo imaging of tissue vascularity. In this study, we monitored healthy laying hens with reduced ovarian function by DUS methods until they developed ovarian TAN or up to 45 weeks at 15-week interval. Hens with reduced ovarian function compared with their peers of similar genetic background and reared under similar condition are considered to be at risk of developing OVCA as reported earlier.14,15 Detection of changes in ovarian vascularity before the tumor became detectable by gray scale ultrasonography in 9 out of 15 hens suggests that ovarian TAN can be detected by prospective monitoring of hens. However, this study also confirmed some limitations of the DUS in detecting early-stage OVCA related ovarian TAN. Although DUS imaging detected 9 hens with early stage OVCA (hens with a small solid ovarian mass while the larger area of the ovary remained normal at detection), it failed to detect ovarian TAN in 3 hens with microscopic OVCA without any detectable mass. We believe that had we continued to monitor beyond 45 weeks, we would have been able to detect OVCA in these hens also. This failure of DUS reveals its limited capability in detecting ovarian TAN related to microscopic OVCA. It is known that Doppler sensitivity is limited for distinction of OVCA but in this study we analyzed changes in the indices, each hen serving as its own control. Although Doppler indices obtained by traditional ultrasonography do not confirm the in vivo detection of microvessels, but immunohistochemical detection of VEGF expression indicates the presence of increased number of microvessels in OVCA hens compared to normal hens. Ultrasonographic contrast agents have been used to enhance the detection limits of DUS in other organs, and few studies of patients with advanced stage OVCA have shown improvement in the detection of ovarian tumor-related vascularity. 17–21
The lack of a suitable animal model of spontaneous OVCA is also a reason for fewer studies with contrast agents and presents a considerable barrier to developing effective contrast media for diagnosing early-stage OVCA. With our imaging methods, a laying hen can be scanned repeatedly with DUS in a short interval without affecting it physiologically. This animal model can also be useful in testing which contrast agents show early-stage ovarian tumor-related vascularity better than others. Because ovarian tumors in laying hens also express VEGF and αvβ3-integrins, this spontaneous animal model of OVCA can be used to determine the efficacy of molecularly targeted imaging using microbubbles conjugated with anti-αvβ3-integrins or anti-VEGFR-2 against ovarian αvβ3-integrins and VEGFR-2. Similarly, it may also be useful in determining the efficacy of in-vivo imaging guided, ovary-targeted antiangiogenic therapy in the future.
This was a pilot study, and the small sample size is a limitation. On the basis of our results, however, we conclude that neoangiogenesis may be detected by DUS in the laying hen model of spontaneous OVCA. Expression of relevant markers is associated with the detection of very early ovarian tumors, suggesting that neoangiogenesis may be a feasible target for the detection of early-stage OVCA. Furthermore, this study showed that progression from normal to abnormal ovaries could be followed in the hen model, supporting its utility as a preclinical model of OVCA.
Acknowledgement
We thank Sanjib Basu, PhD (Department of Preventive Medicine, Rush University Medical Center), for help regarding statistical analysis of the data and the staff of the University of Illinois at Urbana-Champaign Poultry Farm, including Chet and Pam Utterback and Doug Hilgendorf for the maintenance of the hens. This study was supported by Prevent Cancer Foundation (Dr. Barua), a University Research Committee Grant (Dr. Barua), the Segal Women’s Cancer Research Fund (Dr. Barua), Pacific Ovarian Cancer Research Consortium Career Development Program grant P50 CA83636 (Dr. Barua) and US Department of Defense grant OC073325 (Dr. Luborsky).
Abbreviations
- AI
angiogenic index
- CA-125
cancer antigen 125
- DUS
Doppler ultrasonography
- OVCA
ovarian cancer
- PI
pulsatility index
- RI
resistive index
- TAN
tumor-associated neoangiogenesis
- TVUS
transvaginal ultrasonography
- VEGF
vascular endothelial growth factor
References
- 1.Jemal A, Siegel R, Ward E, Hao Y, Xu J, Murray T, et al. Cancer statistics, 2008. CA Cancer J Clin. 2008;58:71–96. doi: 10.3322/CA.2007.0010. [DOI] [PubMed] [Google Scholar]
- 2.Goodman MT, Correa CN, Tung KH, Roffers SD, Cheng Wu X, Young JL, Jr, et al. Stage at diagnosis of ovarian cancer in the United States, 1992–1997. Cancer. 2003;97:2648–2659. doi: 10.1002/cncr.11347. [DOI] [PubMed] [Google Scholar]
- 3.Ries LA. Ovarian cancer. Survival and treatment differences by age. Cancer. 1993;71:524–529. doi: 10.1002/cncr.2820710206. [DOI] [PubMed] [Google Scholar]
- 4.Holschneider CH, Berek JS. Ovarian cancer: epidemiology, biology, and prognostic factors. Semin Surg Oncol. 2000;19:3–10. doi: 10.1002/1098-2388(200007/08)19:1<3::aid-ssu2>3.0.co;2-s. [DOI] [PubMed] [Google Scholar]
- 5.Moore RG, Bast RC., Jr How do you distinguish a malignant pelvic mass from a benign pelvic mass? Imaging, biomarkers, or none of the above. J Clin Oncol. 2007;25:4159–4161. doi: 10.1200/JCO.2007.11.9594. [DOI] [PubMed] [Google Scholar]
- 6.Bosse K, Rhiem K, Wappenschmidt B, Hellmich M, Madeja M, Ortmann M, et al. Screening for ovarian cancer by transvaginal ultrasound and serum CA125 measurement in women with a familial predisposition: a prospective cohort study. Gynecol Oncol. 2006;103:1077–1082. doi: 10.1016/j.ygyno.2006.06.032. [DOI] [PubMed] [Google Scholar]
- 7.Bast RC, Jr, Urban N, Shridhar V, Smith D, Zhang Z, Skates S, et al. Early detection of ovarian cancer: promise and reality. Cancer Treat Res. 2002;107:61–97. doi: 10.1007/978-1-4757-3587-1_3. [DOI] [PubMed] [Google Scholar]
- 8.Folkman J. What is the evidence that tumors are angiogenesis dependent? J Natl Cancer Inst. 1990;82:4–6. doi: 10.1093/jnci/82.1.4. [DOI] [PubMed] [Google Scholar]
- 9.Ramakrishnan S, Subramanian IV, Yokoyama Y, Geller M. Angiogenesis in normal and neoplastic ovaries. Angiogenesis. 2005;8:169–182. doi: 10.1007/s10456-005-9001-1. [DOI] [PubMed] [Google Scholar]
- 10.Vanderhyden BC, Shaw TJ, Ethier JF. Animal models of ovarian cancer. Reprod Biol Endocrinol. 2003;1:67. doi: 10.1186/1477-7827-1-67. [DOI] [PMC free article] [PubMed] [Google Scholar]
- 11.Stakleff KD, Von Gruenigen VE. Rodent models for ovarian cancer research. Int J Gynecol Cancer. 2003;13:405–412. doi: 10.1046/j.1525-1438.2003.13317.x. [DOI] [PubMed] [Google Scholar]
- 12.Damjanov I. Ovarian tumours in laboratory and domestic animals. Curr Top Pathol. 1989;78:1–10. doi: 10.1007/978-3-642-74011-4_1. [DOI] [PubMed] [Google Scholar]
- 13.Fredrickson TN. Ovarian tumors of the hen. Environ Health Perspect. 1987;73:35–51. doi: 10.1289/ehp.877335. [DOI] [PMC free article] [PubMed] [Google Scholar]
- 14.Barua A, Abramowicz JS, Bahr JM, Bitterman P, Dirks A, Holub KA, et al. Detection of ovarian tumors in chicken by sonography: a step toward early diagnosis in humans? J Ultrasound Med. 2007;26:909–919. doi: 10.7863/jum.2007.26.7.909. [DOI] [PubMed] [Google Scholar]
- 15.Barua A, Bitterman P, Abramowicz JS, Dirks AL, Bahr JM, Hales DB, et al. Histopathology of ovarian tumors in laying hens: a preclinical model of human ovarian cancer. Int J Gynecol Cancer. 2009;19:531–539. doi: 10.1111/IGC.0b013e3181a41613. [DOI] [PMC free article] [PubMed] [Google Scholar]
- 16.DePriest PD, Shenson D, Fried A, Hunter JE, Andrews SJ, Gallion HH, et al. A morphology index based on sonographic findings in ovarian cancer. Gynecol Oncol. 1993;51:7–11. doi: 10.1006/gyno.1993.1238. [DOI] [PubMed] [Google Scholar]
- 17.Abramowicz JS. Ultrasonographic contrast media: has the time come in obstetrics and gynecology? J Ultrasound Med. 2005;24:517–531. doi: 10.7863/jum.2005.24.4.517. [DOI] [PubMed] [Google Scholar]
- 18.Testa AC, Ferrandina G, Fruscella E, Van Holsbeke C, Ferrazzi E, Leone FP, et al. The use of contrasted transvaginal sonography in the diagnosis of gynecologic diseases: a preliminary study. J Ultrasound Med. 2005;24:1267–1278. doi: 10.7863/jum.2005.24.9.1267. [DOI] [PubMed] [Google Scholar]
- 19.Testa AC, Timmerman D, Exacoustos C, Fruscella E, Van Holsbeke C, Bokor D, et al. The role of CnTI-SonoVue in the diagnosis of ovarian masses with papillary projections: a preliminary study. Ultrasound Obstet Gynecol. 2007;29:512–516. doi: 10.1002/uog.4013. [DOI] [PubMed] [Google Scholar]
- 20.Cosgrove D. Ultrasound contrast agents: an Overview. Eur J Radiol. 2006;60:324–330. doi: 10.1016/j.ejrad.2006.06.022. [DOI] [PubMed] [Google Scholar]
- 21.Fleischer A, Lyshchik A, Jones HJ, Crispens M, Loveless M, Andreotti R, et al. Contrast-enhanced transvaginal sonography of benign versus malignant ovarian masses: Preliminary findings. J Ultrasound Med. 2008;27:1011–1018. doi: 10.7863/jum.2008.27.7.1011. [DOI] [PubMed] [Google Scholar]


