Abstract
Exposure to the aryl hydrocarbon receptor (AHR) agonist, 2,3,7,8-tetrachlorodibenzo-p-dioxin (TCDD), alters B cell differentiation and suppresses antibody production. Previous genomic studies in mouse B cells identified Bach2 as a direct target of the AHR. Bach2 is known to repress expression of Prdm1, a key transcription factor involved in B cell differentiation, by binding to Maf elements (MAREs) in the regulatory regions of the gene. Chromatin immunopreciptiation followed by quantitative PCR in TCDD-treated lipopolysaccharide (LPS)-activated B cells showed increased binding of the AHR within the first intron in the Bach2 gene. The binding was further confirmed by electrophoretic mobility shift assay (EMSA). TCDD also induced expression of Bach2 in activated as well as resting B cells from 2 to 24 h post-treatment in a time and concentration-dependent manner. Expression of Prdm1 was decreased by TCDD at 24 h and was consistent with repression by Bach2. Increased DNA binding activity to the intron 5 MARE with increasing TCDD concentration was observed by EMSA. Supershifts identified the presence of Bach2 in the DNA binding complex associated with the intron5 MARE of Prdm1. Functional validation of the role of Bach2 in the suppression of B-cell differentiation by TCDD was performed using RNAi. Knockdown of Bach2 showed approximately 40% reversal in the TCDD-induced suppression of IgM secretion when compared to controls. The results suggest that the transcriptional regulation of Bach2 by the AHR is one of the mechanisms involved in the suppression of B-cell differentiation by TCDD.
Keywords: Bach2; AHR; 2,3,7,8-tetrachlorodibenzo-p-dioxin; B-cell differentiation
INTRODUCTION
B-cell development begins from pluripotent hematopoietic stem cells in the fetal liver or in the adult bone marrow followed by migration to the spleen to complete the differentiation process (Hardy and Hayakawa, 2001; Chung et al., 2003). Mature B cells have the ability to differentiate into IgM secreting plasma cells upon antigen stimulation or exposure to a polyclonal activator such as lipopolysaccharide (LPS). The regulation of differentiation process is primarily controlled by two reciprocal negative feedback loops. In an inactivated state, two key transcriptional repressors, B cell lymphoma 6 (Bcl6) and Paired box protein 5 (Pax5), are actively transcribed. Bcl6 and Pax5 both repress key genes involved in B cell to plasma cell differentiation, while Bcl6 also represses the transcription of an activator of B cell differentiation, PR domain zinc finger protein 1 (Prdm1)(Shaffer et al., 2000; Lin et al., 2002). Activation of B cells via LPS or the B-cell receptor increases the expression of Prdm1, which then represses transcription of Bcl6 and Pax5 allowing differentiation to proceed (Shaffer et al., 2002).
BTB and CNC homology 2 (Bach2) is transcriptional repressor and a member of the basic region-leucine zipper (bZip) family (Muto et al., 1998). Bach2 is highly expressed in the early stages of B-cell differentiation and turned off in terminally differentiated B cells (Muto et al., 1998). Within the nucleus, Bach2 dimerizes with MafK and binds to the Maf recognition element (MARE) of B-cell differentiation related genes (Muto et al., 1998; Ochiai et al., 2006). Two functional MARE elements have been identified in the Prdm1 gene that result in transcriptional repression, one within the promoter (Ochiai et al., 2006) and another within intron 5 (Ochiai et al., 2008). The inhibition of Prdm1 by Bach2 maintains B cells in an undifferentiated state.
Suppression of the humoral immune response is among the earliest and most sensitive endpoints of 2,3,7,8-tetrachlorodibenzo-p-dioxin (TCDD) exposure. Although TCDD affects multiple aspects of the immune system, cell-type fractionation reconstitution studies of heterogeneous leukocyte preparations have shown that B cells are the primary cellular targets involved in suppression of the humoral immune response (Dooley and Holsapple, 1988). Other studies have shown that direct addition of TCDD to naïve primary B cells or B cell lines suppresses immunoglobulin-M (IgM) secretion, suggesting that TCDD impairs the differentiation of B cells to IgM secreting plasma cells (Holsapple et al., 1986; Morris et al., 1993; Sulentic et al., 1998).
Most of the biological effects of TCDD including the suppression of the humoral immune response are mediated through the activation of the aryl hydrocarbon receptor (AHR) (Sulentic et al., 1998; Gu et al., 2000). The AHR is a ligand-activated transcription factor and a member of the basic helix-loop-helix, Per/Arnt/Sim (PAS) superfamily. In the canonical model for AHR signaling, the unliganded form of the receptor exists in the cytoplasm in a stable complex with Hsp90, Aip, and Ptges3 (Petrulis and Perdew, 2002). Following ligand binding, the AHR translocates to the nucleus and binds with the AHR nuclear translocation protein (Arnt). The heterodimer binds to xenobiotic response elements to activate transcription of target genes (Gu et al., 2000).
In a previous study, we demonstrated that the AHR binds to a region within the first intron of the Bach2 gene (NCBI36/mm8) in activated B cells exposed to TCDD (De Abrew et al., 2010). The Bach2 mRNA was also upregulated at the 8 and 12 h post TCDD treatment in resting and activated B cells suggesting direct regulation of Bach2 by the AHR. The increased AHR binding and upregulation in Bach2 expression were observed in both a mouse B-cell line (i.e., CH12.LX cells) as well as primary mouse B cells. Given the role of Bach2 in transcriptionally repressing Prdm1, the present study investigated the role of Bach2 in the TCDD-mediated suppression of the IgM response using a mouse B cell line as a model system.
MATERIAL AND METHODS
Chemicals and Reagents
TCDD in dimethyl sulfoxide (DMSO) (purity 99.1%) was purchased from AccuStandard Inc (New Haven, CT). DMSO and LPS (Salmonella typhosa, Catalog No. L4391-1MG) were purchased from Sigma-Aldrich (St. Louis, MO). The AHR antibody was purchased from Biomol (Catalog No. SA210-0100, Plymouth Meeting, PA). The anti-mouse immunoglobulin capture antibody and the horseradish peroxidase anti-mouse IgM detection antibody were purchased from Boehringer Mannheim (Indianapolis, IN) and Sigma-Aldrich, respectively.
Cell line
The CH12.LX B-cell line, derived from the murine CH12 B-cell lymphoma, has been previously characterized by Bishop and Haughton (Bishop and Haughton, 1986) and was a generous gift from Dr. Geoffrey Haughton (University of North Carolina). CH12.LX cells were grown in Advanced RPMI medium 1640 (Invitrogen, Carlsbad, CA) supplemented with 10% heat-inactivated bovine calf serum (Invitrogen, Carlsbad, CA), 13.5 mM HEPES, 100 U/ml penicillin, 100 μg/ml streptomycin, 2 mM L-glutamine and 50 μM β-mercaptoethanol. Cells were maintained at 37°C in a 5% CO2 humidified incubator.
Chromatin Immunoprecipitation and Quantitative PCR (ChIP-qPCR)
CH12.LX cells (1×10⁵ cells/ml, 25 ml/150mm cell culture plate) were activated with LPS (10 μg/ml) and treated with either 10nM TCDD (4 plates) or 0.01% DMSO (4 plates). After treatment for 1 h, cells were fixed according to GENpathway cell fixation protocol (San Diego, CA). Cells were fixed with 1% formaldehyde for 15 min and quenched with 0.125 M glycine. Chromatin was isolated by adding lysis buffer followed by disruption with a Dounce homogenizer. Lysates were sonicated and the DNA sheared to an average length of 300–500 bp. Genomic DNA was prepared by treating aliquots of chromatin with RNase, proteinase K, and heat for decrosslinking, followed by ethanol precipitation. Pellets were resuspended and the resulting DNA was quantified on a Nanodrop ND-1000 spectrophotometer (Wilmington, DE). Extrapolation to the original chromatin volume allowed quantitation of the total chromatin yield.
An aliquot of chromatin (30 μg) was precleared with protein-agarose beads (Invitrogen, Carlsbad, CA). AHR-bound DNA sequences were isolated using an anti-AHR antibody (Biomol, Plymouth Meeting, PA). After incubation at 4°C overnight, protein-agarose beads were used to isolate the immune complexes. Complexes were washed, eluted from the beads with SDS buffer, and subjected to RNase and proteinase K treatment. Crosslinks were reversed by incubation overnight at 65°C, and ChIP DNA was purified by phenol-chloroform extraction and ethanol precipitation. qPCR reactions were carried out on specific genomic regions identified in previous studies using chromatin immunoprecipitation followed by Affymetrix whole genome tiling arrays (ChIP-on-chip) (De Abrew et al., 2010). Amplification was performed using the SYBR Green Supermix (Bio-Rad, Hercules, CA) and the following primers corresponding to Bach2 genomic region and an untranslated region (Untr6) as a negative control: Bach2 (chr14: 32478534-32478617), 5′-AACCCTGCTCGTACATGACA-3′ and 5′-TTCCAGGTAGCAAAGGCTAGA-3′; Untr6 (chr6: 120258582–120258798), 5′-TCAGGCATGAACCACCATAC-3′ and 5′-AACATCCACACGTCCAGTGA-3′. The average Ct values were converted into copy numbers of DNA using standard curves of genomic DNA with known copy numbers. The binding values for each region were normalized for primer efficiency by carrying out qPCR for each primer pair using input DNA. The results are presented as binding events per 1000 cells for each genomic region. An untranscribed region on chromosome 6 (Untr 6) was used as a negative control. For statistical analysis, an unpaired two-tailed Student’s t-test was performed between the TCDD-treated samples and the DMSO controls. The ChIP-qPCR experiments were performed in triplicate (n=3) with each replicate performed on cells cultured and fixed on separate days.
Quantitative Reverse Transcription PCR (qRT-PCR)
Naïve or LPS (10 μg/ml)-activated CH12.LX cells (2×10⁴ cells/ml in 10 ml of media per 100 mm2 petri dish) were treated with either 10 nM TCDD and/or vehicle (0.02% DMSO) for 0, 2, 4, 8 or 24 h for time course experiments or 0.1, 1.0 or 10 nM TCDD and/or vehicle (0.02% DMSO) for concentration-response experiments. Total RNA was isolated using the SV40 Total RNA Isolation System (Promega Corporation, Madison, WI) and RNA concentrations were quantified using a Nanodrop ND-1000 spectrophotometer (Wilmington, DE). Double stranded cDNA was synthesized using 500 ng of total RNA using the Applied Biosystems high capacity cDNA reverse transcription kit (Foster City, CA). qRT-PCR was performed according to manufacturer’s instructions using the Taqman Universal PCR Master Mix and Taqman gene expression assays for Bach2 (Mm00464379_m1) or Prdm1 (Mm00476128_m1). All qRT-PCR measurements were made on an ABI Prism 7900 Sequence Detection System (Applied Biosystems, Foster City, CA). The change in gene expression was calculated using the ΔΔCt method using 18S ribosomal RNA (4319413E) as an internal control. For statistical analysis, unpaired two-tailed Student’s t-tests were performed between treatments and their corresponding controls.
Electrophoretic Mobility Shift Assays (EMSA)
Nuclear proteins were isolated from naïve or LPS (10 μg/ml)-activated CH12.LX cells (2×10⁵ cells/ml in 10 ml of media per 100 mm2 petri dish) that were treated with 10 nM TCDD or vehicle (0.02% DMSO) for 0 and 4 h as previously described (Andrews and Faller, 1991). Cells were pelleted, washed in cold 1X PBS, resuspended in 400 μl cold buffer A (10 mM HEPES-KOH pH 7.9 at 4 °C, 1.5 mM MgCl2, 10 mM KCl, 0.5 mM dithiothreitol, and 0.2 mM PMSF), and allowed to swell on ice for 10 min. Samples were vortex mixed for 10 sec, centrifuged for 10 sec, and the supernatants discarded. The pellets were resuspended in 100 μl of cold buffer C (20 mM HEPES-KOH pH 7.9, 25% glycerol, 420 mM Nacl, 1.5 mM MgCl2, 0.2 mM EDTA, 0.5 mM dithiothreitol, and 0.2 mM PMSF) and incubated on ice for another 20 min for high salt extraction. Cellular debris was removed by centrifugation and the protein concentration of the supernatant was quantified using the BCA assay (Sigma-Aldrich, St. Louis, MO). The binding reaction was performed by adjusting the final NaCl concentration to 150 mM by the addition of Buffer C devoid of NaCl followed by incubation of 5 μg of nuclear protein with 0.5 μg of poly dI-dC (Roche, Indianapolis, IN) on ice for 10 min. Following incubation with dI-dC, the double stranded 32P-labeled probes (45,000 cpm of promoter MARE: 5′-ATAGTGGTGCTGACTCAGCATCG-3′ or 45,000 cpm of intron 5 MARE: 5′-ATCGAAAATGTGAGTCGGCATAATTAA-3′) were added to the reaction and incubated at room temperature for another 30 min. To assess the specificity of DNA binding activity, the nuclear extracts were incubated with 100-fold excess of unlabeled probe prior to addition of the radiolabeled probe. The resulting protein-DNA complexes were resolved on a 4% polyacrylamide gel in 0.5X TBE buffer (1X = 89 mM Tris, 89 mM borate, and 2 mM EDTA). The gel was then dried on 3 mm filter paper (Whattman, Hillsboro, OR) and autoradiographed. Autoradiograph bands were quantified by densitometry using the UN-SCAN IT software (Silk Scientific, Orem, UT). For the supershifts, the nuclear proteins were incubated with anti-Bach2 (L-17) antibody sc-14704X or normal goat IgG (sc-2028) (Santa Cruz Biotechnology, Inc. Santa Cruz, CA) for 30 min at RT prior to the addition of radiolabeled probes.
Nuclear proteins for the DRE3 and Bach2 intron1 EMSA were prepared from resting CH12.LX cells treated with 10nM TCDD or 0.02% DMSO as vehicle for 1 h as previously described (Probst et al., 1993; Williams et al., 1996) with modifications. The cells were harvested by centrifugation at 300 × g for 5 min followed by one wash with 1X HBSS and incubated in HB buffer (10 mM HEPES (pH:7.5), 1mM MgCl2) for 10 min. Nuclei were isolated by centrifugation at 1500 × g for 5 min and the pellet was washed twice with MDHK buffer (3 mM MgCl2, 1 mM DTT, 25 mM HEPES and 100 mM KCl) and resuspended in 100 μl of HEDK buffer (25 mM HEPES, 1 mM EDTA, 1 mM DTT, 400 mM KCl) and incubated on ice for 30 min for high-salt extraction. The samples were then centrifuged at 14,000 × g for 2 min after an equal volume of HEDG buffer (25 mM HEPES, 1 mM EDTA, 1 mM DTT, 10% glycerol) was added to the supernatants and the proteins were quantified using the BCA assay (Sigma-Aldrich). For the binding reaction, 10 μg of nuclear extract was first incubated with 0.6 μg of poly dI-dC on ice for 20 min. Following incubation, 32P-labeled double stranded probes [50,000 cpm of DRE3: 5′-GATCCGGAGTTGCGTGAGAAGAGC-3′ (Denison and Yao, 1991) or 50,000 cpm of Bach2 intron1: 5′-TAATAACACAGCGTGAGCCCTT-3′] were added for an additional 30 min at room temperature. The resulting protein-DNA complexes were resolved on a 4% polyacrylamide gel in 0.5X TAE buffer (1X = 6.7 mM Tris, 3.3 mM acetate, and 1 mM EDTA).
siRNA Knockdown of Bach2
An siRNA duplex for Bach2, the Silencer negative control 1 siRNA duplex, and an siRNA duplex targeting luciferase (another negative control siRNA not present in the mouse genome) were all purchased from Applied Biosystems (Foster City, CA). The sequences of the siRNA duplexes are provided as supplemental material (Supplemental Table 1). A total of 2×10⁶ CH12.LX cells were centrifuged at 300×g for 5 min, the supernatant discarded, and the pellet resuspended in 100 μl of Ingenio electroporation solution (Mirus Bio LLC, Madison, WI). The corresponding siRNA duplex (24 μl of a 50 μM stock) was added to the electroporation solution and the cells were electroporated using the K-005 program of the Amaxa Biosystems Nucleofector (Lonza, Walkerville, MD). The electroporated cells were diluted to 80,000 cells/ml with complete RPMI and plated at 1 ml/well of 24 well plate. The cells were allowed to recover for 2 h prior to activation with LPS (10 μg/ml) and treatment with TCDD (10 nM) or vehicle (0.02% DMSO). The cell culture media was removed after 48 h for IgM analysis. The siRNA experiments were performed in quadruplicate (n=4) with each replicate performed on cell cultures from separate days.
IgM Enzyme-Linked Immunosorbent Assay (ELISA)
The cell culture media from the siRNA transfected CH12.LX cells exposed to LPS and treated with either DMSO or TCDD was analyzed for IgM by sandwich ELISA. Viable cell counts were performed using the Countess automated cell counter (Invitrogen, Carlsbad, CA) following staining with 0.4% Trypan Blue (Invitrogen, Carlsbad, CA). A total of 100 μl of cell culture media from each treatment condition was added to the well of a 96-well microtiter plate coated with anti-mouse immunoglobulin capture antibody (Boehringer Mannheim, Indianapolis, IN). A standard curve containing purified mouse IgM (Sigma-Aldrich, St. Louis, MO) was included on each plate. The plate was incubated at 37°C for 1.5 h. After incubation, the plate was washed 3X with 200 μl/well of 0.05% Tween-20 phosphate-buffered saline followed by 3 washes with water (200 μl/well) using a BioTek Elx 405 plate washer (Winooski, VT). Horseradish peroxidase conjugated anti-mouse IgM detection antibody (Sigma-Aldrich, St. Louis, MO) was diluted to 1:2500 in 3% BSA/PBS and 100 μl was added to each well. The plate was incubated for an additional 1.5 h at 37°C. Unbound detection antibody was washed from the plate with 3 washes with 0.05% Tween 20 phosphate-buffered saline (200 μl/well) followed by 3 washes with water (200 μl/well) using a BioTek Elx 405 plate washer. Following the washes, 2,2′-azinobis (3-ethylbenz thiazoline-sulfonic acid) (ABTS) substrate (Boehringer Mannheim, Indianapolis, IN) was diluted per manufacturer’s instructions and 100 μl of substrate was added to each well. The plate was incubated for 1 h and absorbance was measured at a 405 nm wavelength using a Molecular Devices SpectraMax 340 plate reader (Sunnyvale, CA). The IgM concentration (ng/ml) in each sample was calculated based on the standard curve using the SoftMax Pro 4.7 program (Molecular Devices).
The concentration of IgM/106 cells was calculated by dividing the concentration (ng/ml) by the number of viable cells. Technical replicates were averaged for each biological replicate of the treatment group. The average TCDD value for each siRNA treatment was divided by the average DMSO value of the same siRNA treatment to obtain a ratio to DMSO. This value was subtracted from 1 to obtain the inhibition by TCDD as a fraction. Percent reversal of IgM suppression by TCDD was calculated using the following equation:
The percent reversal of IgM suppression was calculated for each of the four experimental replicates performed for the siRNA experiments. For statistical analysis, unpaired two-tailed Student’s t-tests were performed between treatments and their corresponding controls.
RESULTS
Confirmation of AHR Binding of Bach2 Target Region by ChIP-qPCR
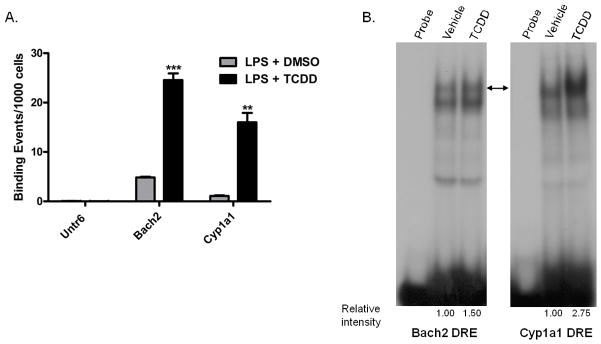
In a previous study, Bach2 was identified as a potential transcriptional target of the AHR in mouse B cells (De Abrew et al., 2010). ChIP-on-chip analysis was used to characterize AHR binding (De Abrew et al., 2010). To verify the ChIP-on-chip results, ChIP-qPCR was performed in B cells on same genomic region using independent samples. The region showing increased AHR binding mapped to nucleotides 32579443 – 32579633 on chromosome 4 (NCBI36/mm8 build). An untranscribed region on chromosome 6 was used as a negative control and Cyp1a1 was used as a positive control. The results showed an increased number of AHR binding events for the Bach2 region following treatment with TCDD as compared to the DMSO control (Fig. 1A). It is unknown as to why the intron of Bach2 has greater absolute AhR binding following treatment with TCDD than the Cyp1a1 positive control. However, the level of AhR binding in the Bach2 intron is also higher in the DMSO control such that the fold-change in AhR binding in the Bach2 intron (average fold-change 5.1) is less than Cyp1a1 (average fold-change 15.1). To further confirm AhR DNA binding to the DRE-like site within the Bach2 target region, electrophoretic mobility shift assays (EMSA) were performed using nuclear extracts from vehicle (0.01% DMSO) and TCDD (10 nM) treated CH12.LX cells. As a positive control for TCDD-inducible DNA binding activity, DRE3 from the mouse Cyp1a1 promoter was included. The nuclear extracts from TCDD treated cells exhibited increased DNA binding activity, compared to vehicle control, to both the Bach2 probe as well as to the DRE3 (Fig. 1B). In the case of the Bach2 probe, TCDD treatment increased DNA binding of two distinct complexes, one exhibit similar mobility to that observed with DRE3 and second smaller complex of presently unknown composition.
Figure 1.
Confirmation of AHR binding in the Bach2 target region. (A) Chromatin immunoprecipitation and quantitative PCR (ChIP-qPCR). B cells were activated with 10 μg/ml LPS and treated with 10 nM TCDD or 0.01% DMSO. After treatment for 1 h, cells were fixed and analyzed for AHR binding. The data are presented as binding events per 1000 cells and represent mean ± S.E. of triplicate measurements with each replicate performed on cells cultured and fixed on separate days. An untranscribed region (Untr6) was included as a negative control and the AHR binding region of Cyp1a1 was included as a positive control. **, p < 0.01; ***, p < 0.001. (B) Electrophoretic mobility shift assays were performed on nuclear extracts from naïve CH12.LX cells treated with 10 nM TCDD or 0.02% DMSO as vehicle for 1 h. The DRE3 region from the Cyp1a1 promoter was used as a control. Binding reactions were performed with 32P- labeled Bach2 and DRE3 probes. The arrow-head indicates the TCDD-inducible DNA binding activity. The results are representative of two independent experiments.
Time Course and Concentration Response of Bach2 Expression Following TCDD-treatment
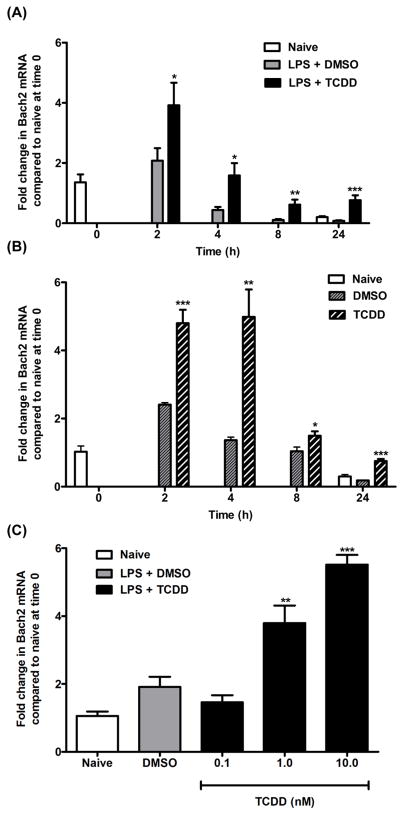
The temporal changes in Bach2 expression were evaluated in both LPS-activated and nonactivated B cells at 0, 2, 4, 8, and 24 h after TCDD treatment (Figs. 2A and B). In the absence of TCDD treatment, LPS activation of B cells resulted in a modest increase in Bach2 mRNA levels at 2 h. The LPS-induced increase in Bach2 expression decreased over the following 24 h period. In the presence of LPS and TCDD, Bach2 mRNA showed a significant increase in expression at each time point. A similar temporal profile in both vehicle control cells and TCDD-treated cells was observed for Bach2 mRNA in nonactivated B cells demonstrating that LPS activation is not required for the TCDD-induced expression.
Figure 2.
Time course and concentration-response changes in Bach2 mRNA levels following TCDD-treatment. (A) B cells were activated with 10 μg/ml LPS and treated with 10 nM TCDD or 0.02% DMSO and analyzed for Bach2 mRNA using qRT-PCR at the indicated times. Naïve cells were not activated with LPS nor treated with TCDD or DMSO and were analyzed at 0 and 24 h. (B) Resting B cells were treated with 10 nM TCDD or 0.02% DMSO and analyzed for Bach2 mRNA using qRT-PCR at the indicated times. Naive cells were not treated with TCDD or DMSO and were analyzed at 0 and 24 h. The data in these graphs (A and B) represent mean ± S.E. of quadruplicate measurements at each time point of three experimental replicates. (C) B cells were activated with LPS (10 μg/ml) and treated with 0.1, 1.0, 10 nM TCDD or 0.02% DMSO. Bach2 mRNA was analyzed at 2 h using qRT-PCR. The data in all graphs represent mean ± S.E. of quadruplicate measurements at each treatment group of two experimental replicates. Comparisons were made between the TCDD-treated group and DMSO-treated group at each time point (A, B) or between each TCDD-treated group and the DMSO group (C). *, p < 0.05; **, p < 0.01; ***, p < 0.0001.
Concentration-response changes were examined in LPS-activated B cells at the 2 h time point (Fig. 2C). Although no change in Bach2 mRNA was observed for the DMSO (vehicle) control compared to naive cells, Bach2 mRNA levels in the TCDD-treated samples exhibited a concentration-dependent increase in expression with a statistically significant increase at 1.0 nM TCDD.
Time Course Expression of Prdm1
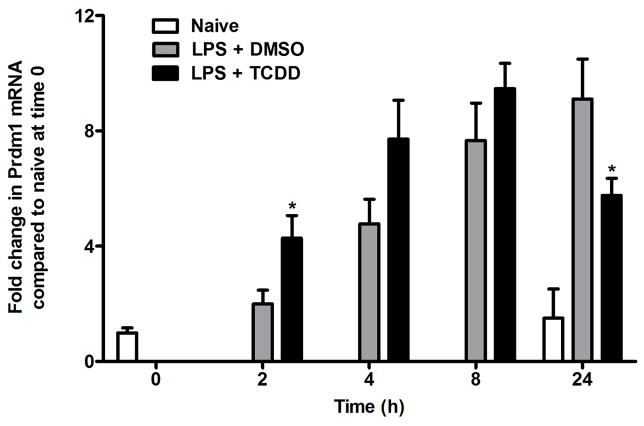
Given the transcriptional repression of Prdm1 by Bach2, differentiating B cells have shown reciprocal expression patterns for Bach2 and Prdm1 depending on the developmental stage of the cells (Ochiai et al., 2006). To assess whether this reciprocal expression pattern is observed after TCDD treatment, time course gene expression measurements of Prdm1 were also performed using qRT-PCR (Fig. 3). Although Prdm1 expression showed a significant TCDD-induced increase in expression at 2 h, a significant downregulation was observed at the 24 h.
Figure 3.
Time course changes in Prdm1 expression levels in LPS-activated B cells. B cells were activated with LPS (10 μg/ml) and treated with TCDD (10 nM) or DMSO (0.02%). Prdm1 mRNA was analyzed by qRT-PCR at the indicated time. The data represent mean ± S.E. of quadruplicate measurements at each time-point of three experimental repliates. Comparisons were made between the LPS + TCDD-treated group and LPS + DMSO-treated group at each time point. *, p < 0.05.
TCDD-inducible DNA Binding in Prdm1 Promoter and Intron 5 Maf Response Elements (MARE)
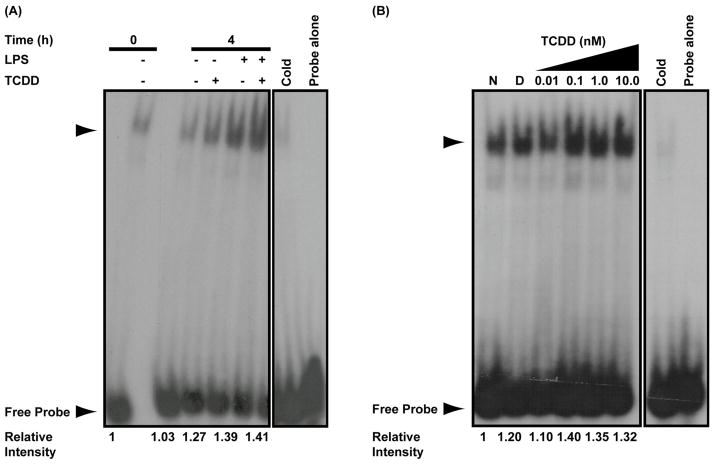
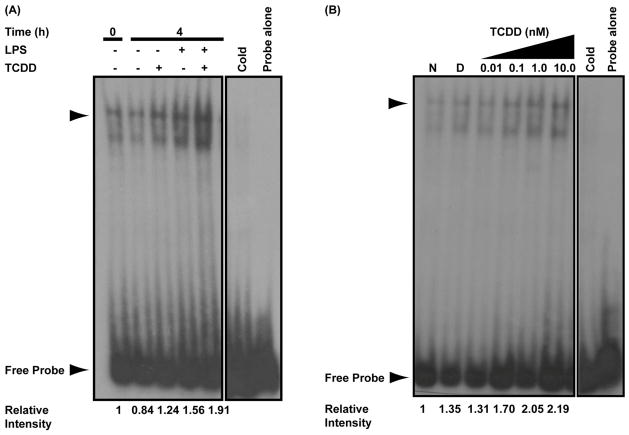
Bach2 has been shown to dimerize with MafK and bind to two separate Maf response elements (MARE) to repress transcription of Prdm1. One MARE is within the Prdm1 promoter (Ochiai et al., 2006) and a second is within intron 5 (Ochiai et al., 2008). To evaluate whether TCDD-induced Bach2 expression resulted in increased DNA binding at the two MAREs, electrophoretic mobility shift assays (EMSA) were performed on nuclear extracts from activated and resting B cells treated with TCDD and in LPS-activated B cells with increasing concentrations of TCDD. In the promoter MARE, only a small increase in DNA binding was observed when cells were treated with both LPS and TCDD for 4 h as compared to either treatment alone (Fig. 4A). Maximal DNA binding activity to the promoter MARE was observed at 0.1 nM TCDD (Fig. 4B). At higher concentrations of TCDD there was a decrease in DNA binding activity to the promoter MARE. In the intron 5 MARE, a more robust increase in DNA binding activity was observed in cells treated with both LPS and TCDD for 4 h compared to either treatment alone (Fig. 5A). In addition, the DNA binding activity in the intron 5 MARE showed a clear concentration-dependent response (Fig. 5B). No clear increase in DNA binding activity was observed with either MARE following TCDD-treatment at the 8 and 24 h time points (data not shown).
Figure 4.
TCDD-inducible and concentration-dependent DNA binding at Prdm1 promoter MARE. (A) Electrophoretic mobility shift assay performed on naive and LPS-activated (10 μg/ml) B cells treated with TCDD (10 nM) or DMSO (0.02%) for 0 or 4 h. The 0 h indicates background binding in untreated B cells. (B) Electrophoretic mobility shift assay performed on LPS-activated (10 μg/ml) B cells treated with the indicated concentrations of TCDD or 0.02% DMSO for 4 h. In both assays, binding reactions were set up with 32P-labeled promoter MARE probe as described in experimental methods. The arrow head indicates the TCDD-inducible DNA-protein complex. Results are representative of three separate experiments.
Figure 5.
TCDD-inducible and concentration-dependent DNA binding at Prdm1 intron 5 MARE. (A) Electrophoretic mobility shift assay performed on naive and LPS-activated (10 μg/ml) B cells treated with TCDD (10 nM) or DMSO (0.02%) for 0 or 4 h. The 0 h indicates background binding in untreated B cells. (B) Electrophoretic mobility shift assay performed on LPS-activated (10 μg/ml) B cells treated with the indicated concentrations of TCDD or 0.02% DMSO for 4 h. In both assays, binding reactions were set up with 32P-labeled intron 5 MARE probe as described in experimental methods. The arrow head indicates the TCDD-inducible DNA-protein complex. Results are representative of three separate experiments.
TCDD-inducible binding of Bach2 in the intron 5 MARE but not in promoter MARE
In order to assess whether Bach2 was present in the TCDD-inducible DNA-protein complexes at the Prdm1 MARE sites, an anti-Bach2 antibody was used to perform a supershift assay. Although none of the DNA binding complexes were supershifted by the anti-Bach2 antibody, the TCDD-inducible complexes bound to the intron 5 MARE were consistently impaired in presence of the anti-Bach2 antibody, but not by an nonspecific isotype control goat IgG (Fig. 6B). In addition, the TCDD-inducible DNA-protein complex bound to the promoter MARE showed little effect by either the anti-Bach2 antibody (Fig. 6A lanes 5 and 6) or the isotype control goat IgG (Fig. 6A lanes 7 and 8). Due to the loss of binding observed with the anti-Bach2 antibody rather than a supershift, the results suggest that the anti-Bach2 antibody interferes with Bach2 DNA binding as is often observed in supershift experiments. Taken together, these results demonstrate that Bach2 is present in the TCDD-inducible DNA binding complex of the Prdm1 intron5 MARE, but not the Prdm1 promoter MARE element.
Figure 6.
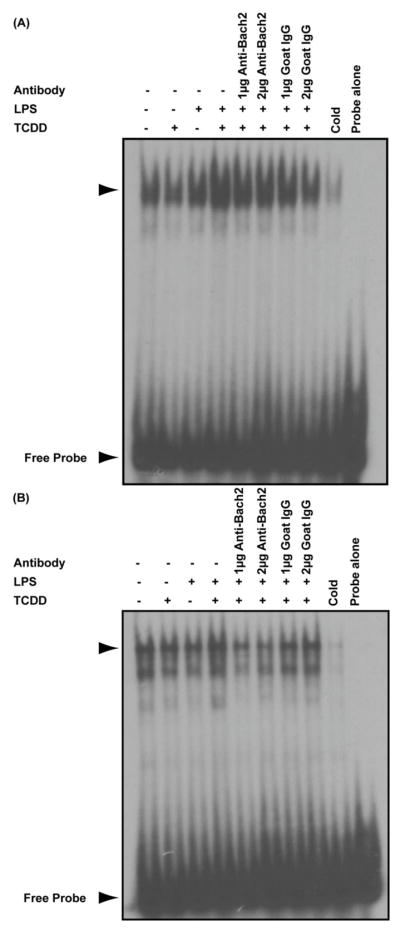
Supershift analysis of TCDD-inducible binding activity of Bach2 at Prdm1 promoter and intron 5 MARE. Electrophoretic mobility shift assays were performed on resting and LPS-activated (10 μg/ml) B cells treated for 4 h with TCDD (10 nM) or vehicle (0.02% DMSO). Binding reactions were set up with (A) 32P-labeled promoter MARE probe and (B) 32P-labeled intron 5 MARE probe. In both assays, anti-Bach2 antibody at 1 μg and 2 μg (lanes 5 and 6, respectively) and isotype control goat IgG at 1 μg and 2 μg (lanes 7 and 8, respectively) were used. The arrow head indicates the TCDD-inducible DNA-protein complex. Results are representative of two separate experiments.
Functional Validation of the Role of Bach2 in the TCDD-dependent Suppression of B-Cell Differentiation
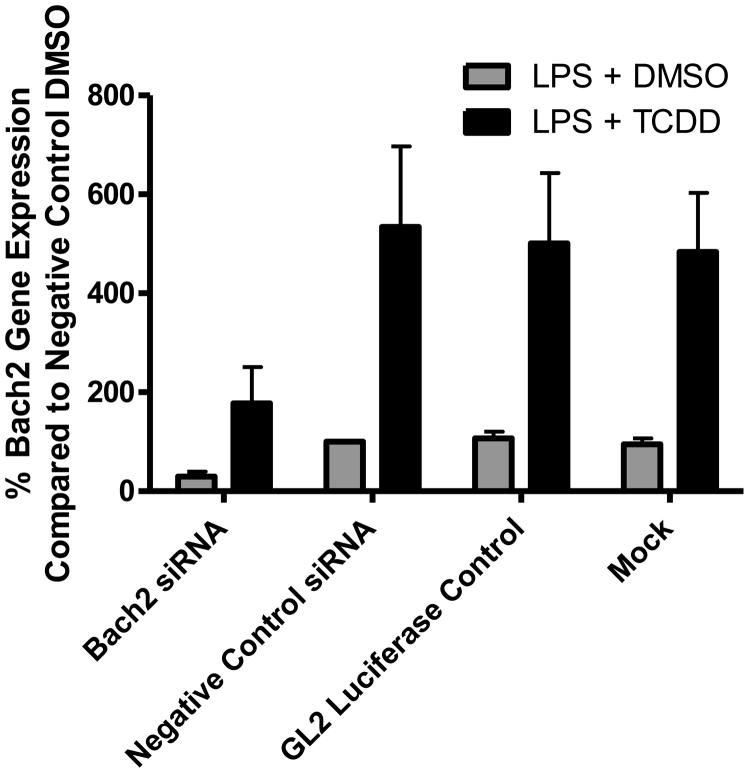
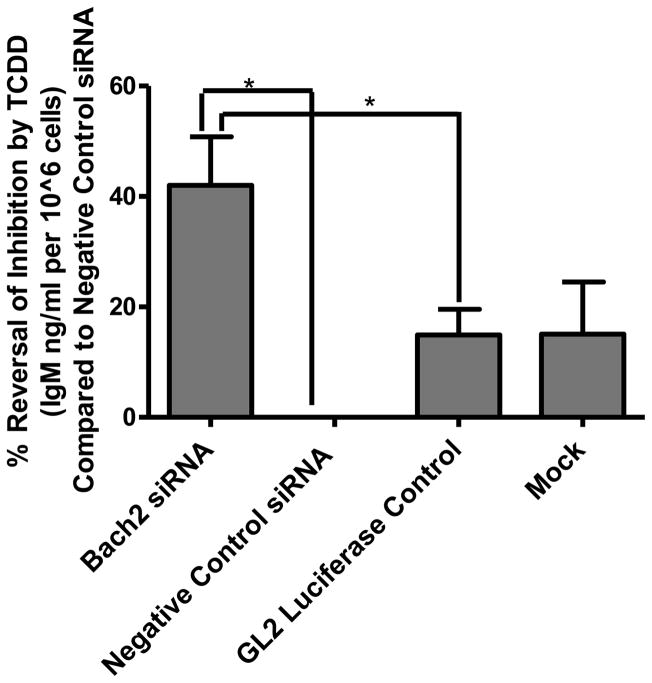
To functionally validate the role of Bach2 in the suppression of B-cell differentiation by TCDD, siRNA knockdown was used to reduce the transcriptional upregulation of Bach2 by the AHR. The Bach2 siRNA duplex exhibited 70% knockdown in vehicle control treated cells and 67% knockdown following treatment with TCDD (Fig. 7). The two separate negative siRNA controls (a nontargeting siRNA duplex and an siRNA duplex targeting luciferase) and mock transfected cells showed little effect on the increase in Bach2 expression following TCDD-treatment. Following verification of Bach2 knockdown, B cells were transfected with the siRNA duplexes, allowed to recover for 2 h, activated with LPS (10 μg/ml), and treated with TCDD (10 nM) or vehicle (0.02% DMSO). The culture media was analyzed for IgM concentration 48 h after treatment. The siRNA duplex targeting Bach2 exhibited a statistically significant reversal in the TCDD-induced suppression of IgM secretion compared to either the nontargeting siRNA duplex or the luciferase targeting siRNA duplex (Fig. 8). The reversal in TCDD-induced IgM suppression was approximately 40%.
Figure 7.
Knockdown of Bach2 mRNA in B cells using siRNA. B-cells were electroporated with an siRNA duplex targeting Bach2 (Bach2 siRNA), negative control siRNA duplexes (negative control siRNA and GL2 luciferase control), or mock electroporated (no siRNA duplexes). Following a 2 h recovery, cells were activated with LPS (10 μg/ml) and treated with either TCDD (10 nM) or DMSO (0.02%) for 48 h. Bach2 mRNA was measured using qRT-PCR. The data are presented as a percentage of the negative control siRNA duplex treated with LPS + DMSO. The bars are mean ± S.E. of triplicate experimental replicates.
Figure 8.
Functional validation of the role of Bach2 in the TCDD-dependent suppression of IgM secretion. B-cells were electroporated with a siRNA duplex targeting Bach2 (Bach2 siRNA), negative control siRNA duplexes (negative control siRNA and GL2 luciferase control), or mock electroporated (no siRNA duplexes). Following a 2 h recovery, cells were activated with LPS (10 μg/ml) and treated with either TCDD (10 nM) or DMSO (0.02%) for 48 h. IgM concentrations in the culture media were measured using ELISA. The data are presented as the % reversal of IgM suppression by TCDD compared to negative control siRNA. The bars are mean ± S.E. of quadruplicate experimental replicates. *, p < 0.05.
DISCUSSION
Following exposure to antigen, mature B cells go through a functional and phenotypic transformation resulting in antibody secreting plasma cells. The transformation results in key changes within the cell including loss of B-cell identity, induction of the secretory apparatus, and expression of antibody genes (Igarashi et al., 2007). The B-cell differentiation process is disrupted by exposure to AHR agonists such as TCDD. In a previous study, we identified Bach2 as a potential transcriptional target of the AHR in a mouse B cell line using an integrated genomic analysis involving ChIP-on-chip and time course microarray analysis (De Abrew et al., 2010). The AHR bound to a region within the first intron of the Bach2 gene and increased its expression at 8 and 12 h post treatment with TCDD. The AHR binding and changes in expression for Bach2 were confirmed in primary mouse B cells (De Abrew et al., 2010). The goal of the present study was to characterize and functionally validate the role of Bach2 in TCDD-dependent suppression of B-cell differentiation.
The binding of the AHR to the first intron in the Bach2 gene was verified using ChIP-qPCR. Informatic analysis identified a core dioxin response element (DRE) sequence, GCGTG (Swanson et al., 1995), within the binding region and TCDD-inducible binding to this site was confirmed by EMSA. The increase in Bach2 expression following TCDD exposure was also verified in both LPS-activated and nonactivated B cells using qRT-PCR. Time course studies showed TCDD-induced expression of Bach2 at all the time points examined from 2 – 24 h. Finally, concentration-response studies demonstrated that the increased expression of Bach2 by TCDD was concentration-dependent.
Bach2 is a direct repressor of Prdm1 transcription and the net balance of the two transcription factors is correlated with distinct stages of B-cell differentiation (Ochiai et al., 2006). Undifferentiated B cells exhibit low levels of Prdm1 and high levels of Bach2 while terminally differentiated plasma cells show high levels of Prdm1 and low levels of Bach2 (Ochiai et al., 2006). Given the reciprocal relationship between Bach2 and Prdm1 expression in B cell differentiation, time course measurements of Prdm1 mRNA were also performed to examine whether this reciprocal relationship was observed following exposure to TCDD. Although Prdm1 expression showed a significant TCDD-induced increase in expression at the 2 h time point, a significant downregulation was observed at the 24 h time point. Although the delay between increased Bach2 mRNA and Prdm1 downregulation is consistent with the time required for the translation and folding of Bach2 protein, the current data does not rule out additional mechanisms whereby the AhR could also influence Prdm1 expression. In fact, it is well established that Prdm1 upregulation in activated B cells is mediated, at least in part, by the activator protein 1 (AP-1) transcription factor complex through DNA binding to at least three characterized TPA response elements (TRE) within the Prdm1 promoter (Ohkubo et al., 2005). Recently we reported that TCDD-treatment strongly impaired AP-1 DNA binding activity to all three TRE sites, including TRE -267, TRE -1451 and TRE -2001 (Schneider et al., 2009). Collectively, the decrease in the positive regulation mediated by AP-1 binding in combination with an increase in negative regulation produced by Bach2 binding within the Prdm1 promoter may significantly contribute to the repression of Prdm1 observed in TCDD-treated B cells.
Although only partially characterized, the transcriptional repression of Prdm1 by Bach2 has been shown to occur through two separate MAREs, one within the Prdm1 promoter (Ochiai et al., 2006) and another within intron 5 (Ochiai et al., 2008). Examination of the effect of TCDD on DNA binding to each of these MAREs showed only a small increase in binding activity to the promoter MARE and a much larger increase in binding activity to the intron 5 MARE. The increase in DNA binding to the intron 5 MARE was dependent on the concentration of TCDD. Supershifts of the DNA binding complex at the intron 5 MARE suggested the presence of Bach2 as the intensity of binding decreased upon addition of the anti-Bach2 antibody but not in presence of a non-specific isotype control antibody. A supershift band of decreased mobility was not observed most likely due to interference of the anti-Bach2 antibody with the DNA-binding of Bach2 itself. Based on a previous study (Ochiai et al., 2006), it was somewhat surprising that Bach2 binding was not detected with the anti-Bach2 antibody to the Prdm1 promoter MARE and may be due in part to the kinetics of Bach2 binding to this element in CH12.LX cells. Alternatively, the differential binding activity of Bach2 to the two MAREs in the presence of TCDD in activated B cells indicates differential regulatory roles of Bach2 in controlling Prdm1.
To functionally assess whether the increase in Bach2 transcription was related to the TCDD-induced suppression of B-cell differentiation, RNAi was used to dampen changes in the Bach2 mRNA and the secretion of IgM was used as a marker of differentiation. The siRNA duplex targeting Bach2 exhibited a significant reversal in the TCDD-induced suppression of IgM secretion compared to controls. The reversal in TCDD-induced IgM suppression was not complete at approximately 40%. The results suggest that the transcriptional regulation of Bach2 by the AHR is one mechanism involved in the suppression of B-cell differentiation by TCDD.
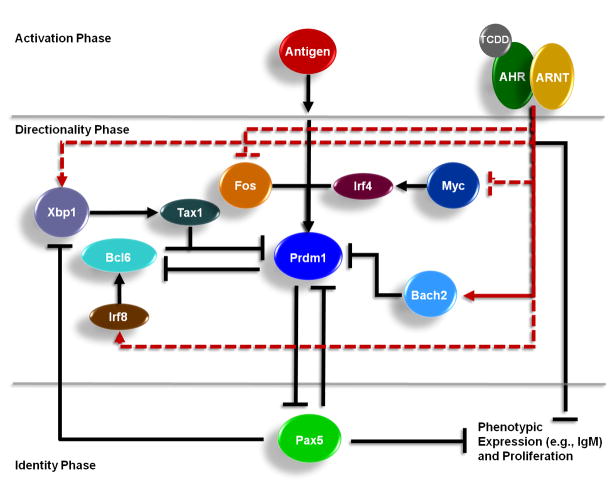
The role of the Bach2 in the suppression of B-cell differentiation by TCDD is consistent with the AHR acting on multiple points of the signaling network to regulate differentiation (Fig. 9). Previous studies have shown that TCDD suppresses immunoglobulin M (IgM) secretion through decreased expression of multiple, individual components of the macromolecule, including the μ heavy chain (IgH), the κ light chain (Igκ), and J chain (Yoo et al., 2004). The decreased transcription of at least one of the components, IgH, is mediated through a DRE in the 3′α enhancer (Sulentic et al., 2004a; Sulentic et al., 2004b). Other, less characterized, points of interaction by the AHR include Irf8, Xbp1, and Myc, which have been identified as potential direct transcriptional targets of the AHR in B cells using ChIP-on-chip and time course microarray analysis (De Abrew et al., 2010). Irf8 transcriptionally activates Bcl6 (Lee et al., 2006; Ku et al., 2008) and Xbp1 transcriptionally upregulates Tax1 (Ku et al., 2008) which, in turn, physically interacts with Bcl6 to enhance its repressive activity (Dean et al., 2009). Myc has been predicted to transcriptionally regulate Irf4 (Chen et al., 2007), which is a transcriptional activator of Prdm1 (Calame, 2008). In addition, the decrease in AP-1 binding within the Prdm1 promoter in response to TCDD, which occurs through mechanisms not yet characterized, further contributes to impairment of B cell to plasma cell differentiation (Schneider et al., 2009). As a whole, these studies provide a greater mechanistic understanding of the cellular signaling network involved in the suppression of B-cell differentiation and IgM production by AHR agonists.
Figure 9.
Conceptual model depicting the mechanism of TCDD-mediated suppression of B-cell differentiation into plasma cells. The proposed model depicts the role of the AHR acting at multiple nodes in the signaling network regulating B cell differentiation. At the core of the signaling network are three key transcription factors involved in B-cell differentiation (Prdm1, Bcl6, and Pax5) that exist in negative regulatory feedback loops. Lines ending in arrows represent positive regulatory interactions and lines ending in a “T” represent negative regulatory interactions. The black lines represent signaling links previously established in the literature and the red lines represent signaling interactions identified in a previous integrated genomic analysis (De Abrew et al., 2010). The dashed red lines represent putative interactions that have not been functionally validated. The solid red line represents the functionally validated interaction in this study.
Supplementary Material
Acknowledgments
This research was supported by a grant from the National Institutes of Environmental Health Sciences Superfund Basic Research Program (P42-ES004911) and a grant from the National Institutes of Environmental Health Sciences (R01 ES02520). We also thank Reetu Singh for her technical assistance and Dr. Barbara Wetmore for her editorial comments.
Footnotes
Supplemental Table 1. siRNA sequences using in the knockdown studies.
CONFLICT OF INTEREST STATEMENT
Russell S. Thomas acknowledges that he has received grant funding from The Dow Chemical Company for work in a different area.
Publisher's Disclaimer: This is a PDF file of an unedited manuscript that has been accepted for publication. As a service to our customers we are providing this early version of the manuscript. The manuscript will undergo copyediting, typesetting, and review of the resulting proof before it is published in its final citable form. Please note that during the production process errors may be discovered which could affect the content, and all legal disclaimers that apply to the journal pertain.
References
- Andrews NC, Faller DV. A rapid micropreparation technique for extraction of DNA-binding proteins from limiting numbers of mammalian cells. Nucleic Acids Res. 1991;19:2499. doi: 10.1093/nar/19.9.2499. [DOI] [PMC free article] [PubMed] [Google Scholar]
- Bishop GA, Haughton G. Induced differentiation of a transformed clone of Ly-1+ B cells by clonal T cells and antigen. Proc Natl Acad Sci U S A. 1986;83:7410–7414. doi: 10.1073/pnas.83.19.7410. [DOI] [PMC free article] [PubMed] [Google Scholar]
- Calame K. Activation-dependent induction of Blimp-1. Curr Opin Immunol. 2008;20:259–264. doi: 10.1016/j.coi.2008.04.010. [DOI] [PubMed] [Google Scholar]
- Chen Y, Blackwell TW, Chen J, Gao J, Lee AW, States DJ. Integration of genome and chromatin structure with gene expression profiles to predict c-MYC recognition site binding and function. PLoS Comput Biol. 2007;3:e63. doi: 10.1371/journal.pcbi.0030063. [DOI] [PMC free article] [PubMed] [Google Scholar]
- Chung JB, Silverman M, Monroe JG. Transitional B cells: step by step towards immune competence. Trends Immunol. 2003;24:343–349. doi: 10.1016/s1471-4906(03)00119-4. [DOI] [PubMed] [Google Scholar]
- De Abrew KN, Kaminski NE, Thomas RS. An Integrated Genomic Analysis of Aryl Hydrocarbon Receptor-Mediated Inhibition of B-Cell Differentiation. Toxicol Sci. 2010 doi: 10.1093/toxsci/kfq265. [DOI] [PMC free article] [PubMed] [Google Scholar]
- Dean J, Hashimoto K, Tsuji T, Gautier V, Hall WW, Sheehy N. Functional interaction of HTLV-1 tax protein with the POZ domain of the transcriptional repressor BCL6. Oncogene. 2009;28:3723–3734. doi: 10.1038/onc.2009.230. [DOI] [PubMed] [Google Scholar]
- Denison MS, Yao EF. Characterization of the interaction of transformed rat hepatic cytosolic Ah receptor with a dioxin responsive transcriptional enhancer. Arch Biochem Biophys. 1991;284:158–166. doi: 10.1016/0003-9861(91)90278-q. [DOI] [PubMed] [Google Scholar]
- Dooley RK, Holsapple MP. Elucidation of cellular targets responsible for tetrachlorodibenzo-p-dioxin (TCDD)-induced suppression of antibody responses: I. The role of the B lymphocyte. Immunopharmacology. 1988;16:167–180. doi: 10.1016/0162-3109(88)90005-7. [DOI] [PubMed] [Google Scholar]
- Gu YZ, Hogenesch JB, Bradfield CA. The PAS superfamily: sensors of environmental and developmental signals. Annu Rev Pharmacol Toxicol. 2000;40:519–561. doi: 10.1146/annurev.pharmtox.40.1.519. [DOI] [PubMed] [Google Scholar]
- Hardy RR, Hayakawa K. B cell development pathways. Annu Rev Immunol. 2001;19:595–621. doi: 10.1146/annurev.immunol.19.1.595. [DOI] [PubMed] [Google Scholar]
- Holsapple MP, Dooley RK, McNerney PJ, McCay JA. Direct suppression of antibody responses by chlorinated dibenzodioxins in cultured spleen cells from (C57BL/6 × C3H)F1 and DBA/2 mice. Immunopharmacology. 1986;12:175–186. doi: 10.1016/0162-3109(86)90001-9. [DOI] [PubMed] [Google Scholar]
- Igarashi K, Ochiai K, Muto A. Architecture and dynamics of the transcription factor network that regulates B-to-plasma cell differentiation. J Biochem. 2007;141:783–789. doi: 10.1093/jb/mvm106. [DOI] [PubMed] [Google Scholar]
- Ku SC, Lee J, Lau J, Gurumurthy M, Ng R, Lwa SH, Klase Z, Kashanchi F, Chao SH. XBP-1, a novel human T-lymphotropic virus type 1 (HTLV-1) tax binding protein, activates HTLV-1 basal and tax-activated transcription. J Virol. 2008;82:4343–4353. doi: 10.1128/JVI.02054-07. [DOI] [PMC free article] [PubMed] [Google Scholar]
- Lee CH, Melchers M, Wang H, Torrey TA, Slota R, Qi CF, Kim JY, Lugar P, Kong HJ, Farrington L, van der Zouwen B, Zhou JX, Lougaris V, Lipsky PE, Grammer AC, Morse HC., 3rd Regulation of the germinal center gene program by interferon (IFN) regulatory factor 8/IFN consensus sequence-binding protein. J Exp Med. 2006;203:63–72. doi: 10.1084/jem.20051450. [DOI] [PMC free article] [PubMed] [Google Scholar]
- Lin KI, Angelin-Duclos C, Kuo TC, Calame K. Blimp-1-dependent repression of Pax-5 is required for differentiation of B cells to immunoglobulin M-secreting plasma cells. Mol Cell Biol. 2002;22:4771–4780. doi: 10.1128/MCB.22.13.4771-4780.2002. [DOI] [PMC free article] [PubMed] [Google Scholar]
- Morris DL, Karras JG, Holsapple MP. Direct effects of 2,3,7,8-tetrachlorodibenzo-p-dioxin (TCDD) on responses to lipopolysaccharide (LPS) by isolated murine B-cells. Immunopharmacology. 1993;26:105–112. doi: 10.1016/0162-3109(93)90002-8. [DOI] [PubMed] [Google Scholar]
- Muto A, Hoshino H, Madisen L, Yanai N, Obinata M, Karasuyama H, Hayashi N, Nakauchi H, Yamamoto M, Groudine M, Igarashi K. Identification of Bach2 as a B-cell-specific partner for small maf proteins that negatively regulate the immunoglobulin heavy chain gene 3′ enhancer. EMBO J. 1998;17:5734–5743. doi: 10.1093/emboj/17.19.5734. [DOI] [PMC free article] [PubMed] [Google Scholar]
- Ochiai K, Katoh Y, Ikura T, Hoshikawa Y, Noda T, Karasuyama H, Tashiro S, Muto A, Igarashi K. Plasmacytic transcription factor Blimp-1 is repressed by Bach2 in B cells. J Biol Chem. 2006;281:38226–38234. doi: 10.1074/jbc.M607592200. [DOI] [PubMed] [Google Scholar]
- Ochiai K, Muto A, Tanaka H, Takahashi S, Igarashi K. Regulation of the plasma cell transcription factor Blimp-1 gene by Bach2 and Bcl6. Int Immunol. 2008;20:453–460. doi: 10.1093/intimm/dxn005. [DOI] [PubMed] [Google Scholar]
- Ohkubo Y, Arima M, Arguni E, Okada S, Yamashita K, Asari S, Obata S, Sakamoto A, Hatano M, JOW, Ebara M, Saisho H, Tokuhisa T. A role for c-fos/activator protein 1 in B lymphocyte terminal differentiation. J Immunol. 2005;174:7703–7710. doi: 10.4049/jimmunol.174.12.7703. [DOI] [PubMed] [Google Scholar]
- Petrulis JR, Perdew GH. The role of chaperone proteins in the aryl hydrocarbon receptor core complex. Chem Biol Interact. 2002;141:25–40. doi: 10.1016/s0009-2797(02)00064-9. [DOI] [PubMed] [Google Scholar]
- Probst MR, Reisz-Porszasz S, Agbunag RV, Ong MS, Hankinson O. Role of the aryl hydrocarbon receptor nuclear translocator protein in aryl hydrocarbon (dioxin) receptor action. Mol Pharmacol. 1993;44:511–518. [PubMed] [Google Scholar]
- Schneider D, Manzan MA, Yoo BS, Crawford RB, Kaminski N. Involvement of Blimp-1 and AP-1 dysregulation in the 2,3,7,8-Tetrachlorodibenzo-p-dioxin-mediated suppression of the IgM response by B cells. Toxicol Sci. 2009;108:377–388. doi: 10.1093/toxsci/kfp028. [DOI] [PMC free article] [PubMed] [Google Scholar]
- Shaffer AL, Lin KI, Kuo TC, Yu X, Hurt EM, Rosenwald A, Giltnane JM, Yang L, Zhao H, Calame K, Staudt LM. Blimp-1 orchestrates plasma cell differentiation by extinguishing the mature B cell gene expression program. Immunity. 2002;17:51–62. doi: 10.1016/s1074-7613(02)00335-7. [DOI] [PubMed] [Google Scholar]
- Shaffer AL, Yu X, He Y, Boldrick J, Chan EP, Staudt LM. BCL-6 represses genes that function in lymphocyte differentiation, inflammation, and cell cycle control. Immunity. 2000;13:199–212. doi: 10.1016/s1074-7613(00)00020-0. [DOI] [PubMed] [Google Scholar]
- Sulentic CE, Holsapple MP, Kaminski NE. Aryl hydrocarbon receptor-dependent suppression by 2,3,7, 8-tetrachlorodibenzo-p-dioxin of IgM secretion in activated B cells. Mol Pharmacol. 1998;53:623–629. [PubMed] [Google Scholar]
- Sulentic CE, Kang JS, Na YJ, Kaminski NE. Interactions at a dioxin responsive element (DRE) and an overlapping kappaB site within the hs4 domain of the 3′alpha immunoglobulin heavy chain enhancer. Toxicology. 2004a;200:235–246. doi: 10.1016/j.tox.2004.03.015. [DOI] [PubMed] [Google Scholar]
- Sulentic CE, Zhang W, Na YJ, Kaminski NE. 2,3,7,8-tetrachlorodibenzo-p-dioxin, an exogenous modulator of the 3′alpha immunoglobulin heavy chain enhancer in the CH12.LX mouse cell line. J Pharmacol Exp Ther. 2004b;309:71–78. doi: 10.1124/jpet.103.059493. [DOI] [PubMed] [Google Scholar]
- Swanson HI, Chan WK, Bradfield CA. DNA binding specificities and pairing rules of the Ah receptor, ARNT, and SIM proteins. J Biol Chem. 1995;270:26292–26302. doi: 10.1074/jbc.270.44.26292. [DOI] [PubMed] [Google Scholar]
- Williams CE, Crawford RB, Holsapple MP, Kaminski NE. Identification of functional aryl hydrocarbon receptor and aryl hydrocarbon receptor nuclear translocator in murine splenocytes. Biochem Pharmacol. 1996;52:771–780. doi: 10.1016/0006-2952(96)00360-7. [DOI] [PubMed] [Google Scholar]
- Yoo BS, Boverhof DR, Shnaider D, Crawford RB, Zacharewski TR, Kaminski NE. 2,3,7,8-Tetrachlorodibenzo-p-dioxin (TCDD) alters the regulation of Pax5 in lipopolysaccharide-activated B cells. Toxicol Sci. 2004;77:272–279. doi: 10.1093/toxsci/kfh013. [DOI] [PubMed] [Google Scholar]
Associated Data
This section collects any data citations, data availability statements, or supplementary materials included in this article.


