Abstract
Measures in autopsied brains from Alzheimer’s Disease (AD) patients reveal a decrease in the activity of α-ketoglutarate dehydrogenase complex (KGDHC) and an increase in malate dehydrogenase (MDH) activity. The present experiments tested whether both changes could be caused by the common oxidant H2O2 and to probe the mechanism underlying these changes. Since the response to H2O2 is modified by the level of the E2k subunit of KGDHC, the interaction of MDH and KGDHC was studied in cells with varying levels of E2k. In cells with only 23% of normal E2k protein levels, one hour treatment with H2O2 decreased KGDHC and increased MDH activity as well as the mRNA level for both cytosolic and mitochondrial MDH. The increase in MDH did not occur in cells with 100% or 46% of normal E2k. Longer treatments with H2O2 inhibited the activity of both enzymes. Glutathione is a major regulator of cellular redox state and can modify enzyme activities. H2O2 converts reduced glutathione (GSH) to oxidized glutathione (GSSG), which reacts with protein thiols. Treatment of purified KGDHC with GSSG leads to glutathionylation of all three KGDHC subunits. Thus, cellular glutathione level was manipulated by two means to determine the effect on KGDHC and MDH activities. Both buthionine sulfoximine (BSO), which inhibits glutathione synthesis without altering redox state, and H2O2 diminished glutathione to a similar level after 24 hrs. However, H2O2, but not BSO, reduced KGDHC and MDH activities, and the reduction was greater in the E2k-23 line. These findings suggest that the E2k may mediate diverse responses of KGDHC and MDH to oxidants. In addition, the differential response of activities to BSO and H2O2 together with the in vitro interaction of KGDHC with GSSG suggests that glutathionylation is one possible mechanism underlying oxidative stress-induced inhibition of the TCA cycle enzymes.
Keywords: α-ketoglutarate dehydrogenase complex, Alzheimer’s disease, glutathione, malate dehydrogenase, reactive oxygen species
Introduction
Diminished energy metabolism and enhanced oxidative stress [excess of reactive oxygen species (ROS) to antioxidants] are consistent features of Alzheimer’s disease (AD) [1,2,3,4,5] Recent studies on brains of patients that died with AD indicate a selective modification of the mitochondrial tricarboxylic acid (TCA) cycle, a major pathway of the oxidative metabolism. The TCA cycle consists of eight enzymes including the α-ketoglutarate dehydrogenase complex (KGDHC, EC 1.2.4.2, EC 2.3.1.61, EC 1.6.4.3) and malate dehydrogenase (MDH, EC 1.1.1.37). The activity of KGDHC declines in AD [6,7,8,9,10,11,12], while MDH activity is elevated [13]. The mechanism of the diverse response of the TCA cycle enzyme in AD is unknown. Our previous studies suggest that oxidants can mimic the diverse changes that accompany AD. For example, hydrogen peroxide (H2O2) mimics the increase in endoplasmic reticulum calcium stores and the decline in the activity of KGDHC [14].
KGDHC consists of three subunits [α-ketoglutarate dehydrogenase (E1k), dihydrolipoyl succinyltransferase (E2k) and dihydrolipoyl dehydrogenase (E3)] and is a key and arguably rate-limiting enzyme in the TCA cycle [10]. Multiple copies of E1k (12 dimers) and E3 (6 dimers) are arranged along the edges and faces, respectively, of an octahedral E2k core (24 subunits) to form a multienzyme complex with a molecular weight of around 5×10⁶ dalton [15]. Diminished KGDHC activity occurs in both normal and pathologically involved brain areas of patients with a number of neurodegenerative diseases including AD, Parkinson’s disease (PD), progressive supranuclear palsy and Wernicke-Korsakoff syndrome [6,10,11,12,16,17,18,19,20,21]. In AD patients the reduction in the activity of KGDHC is highly correlated to a clinical dementia rating (CDR) [13]. These results suggest that KGDHC may play a central role in the pathophysiology of the diseases. KGDHC is sensitive to a wide range of oxidants whether the oxidants are added to the purified enzyme or cell system [22,23,24], or generated internally in cells or mice [25,26,27]. H2O2 reduces KGDHC activity in fibroblasts, intact cardiac mitochondria, synaptosomes and N2a cells [22,23,28,29]. These results suggest that oxidative stress is one plausible link between diminished KGDHC activity and neurodegenerative diseases.
MDH, the final enzyme in the TCA cycle, catalyzes the interconversion of L-malate and oxaloacetate using nicotinamide adenine dinucleotide (NAD) as a cofactor (L-malate + NAD+ ⇄ oxaloacetate + NADH + H+) [30]. Mammalian cells contain two isozymes of MDH: mitochondrial (m-MDH) and soluble or cytoplasmic (c-MDH). The two isozymes consist of two very similar subunits of about 35,000 daltons with similar enzymatic activity but appear to be different proteins [31]. Elevated MDH activity occurs under a number of conditions. For example, mice on a caloric restricted diet show increased MDH activity compared to mice on a normal diet [32]. Total MDH activity is also higher in autopsy brains from AD patients compared with brains from normal individuals [13]. However, the regulation of MDH and its relation to diminished KGDHC activity in the disease are unknown.
Glutathione, a tripeptide composed of L-glutamate, L-cysteine and glycine, is considered to be the most important endogenous intracellular antioxidant in mammalian cells [33,34]. Reduced (GSH) and oxidized (GSSG) forms of glutathione are interconvertible by the action of two enzymes, GSH peroxidase and GSSG reductase [35,36]. Altered glutathione metabolism has been observed in multiple neurodegenerative diseases [37,38,39]. For example, GSH declines by 40% in substantia nigra of PD patients [38]. H2O2 induces accumulation of GSSG and GSSG can form mixed disulfides with cellular protein thiols or intraprotein disulfides which leads to altered enzyme functions [40]. Thus, altered glutathione redox state may mediate changes in the TCA cycle enzymes under oxidative stress through glutathionylation.
Glutathionylation of KGDHC is one possible mechanism underlying its inactivation by oxidative stress [41]. In addition to existence of multiple cysteine residues in the three subunits, a unique feature of KGDHC is that the E2k subunit has a bound lipoic acid that is cycled between thiol and disulfide forms during the catalysis. Our previous study demonstrates that the response of cells to H2O2 is modulated by the E2k and is independent of changes in activity of the complex [42]. Thus, the E2k subunit of KGDHC may have other novel functions in modulating oxidative stress-induced changes in the activities of the TCA cycle enzymes in AD.
Two HEK293 lines expressing E2k antisense RNA, in which E2k protein contents were reduced to 46% (E2k-46) and 23% (E2k-23) of a sense control line (E2k-100), were developed in our previous study [42]. The studies reveal that E2k modifies ROS production and cell death in response to H2O2. The present experiments used these cell lines to test whether concentrations of H2O2 that diminish KGDHC activity increase MDH activity and if the E2k of KGDHC modulates these changes. The experiments also tested whether GSSG directly interact with KGDHC in vitro, and whether manipulation of free glutathione level by buthionine sulfoximine (BSO, an inhibitor of glutathione synthesis) or H2O2 correlates with changes in KGDHC and MDH activities.
Experimental procedures
Cell cultures and treatments
The E2k-46 and E2k-23 cell lines with half and three-quarters diminished E2k protein along with the control line (E2k-100) were generated previously [42]. “100”, “46” and “23” represent the protein level of the E2k in the E2k-100, E2k-46 and E2k-23 line, respectively [42]. They were grown in Dulbecco’s Modified Eagle Medium (DMEM) (high glucose) supplemented with 10% (v/v) fetal bovine serum (FBS), penicillin (50 units/ml), streptomycin (50 μg/ml) and hygromycin (100 μg/ml), and incubated at 37°C in a humidified atmosphere of 5% CO2 in air.
Cells grown in 100-mm cell culture dishes (~ 90% confluent) were trypsinized, counted and seeded into six 6-well plates per cell line at a density of 5×10⁴ cells/well, and incubated at 37°C in a humidified atmosphere of 5% CO2 in air. When near 80- 90% confluent, the cells were washed twice with phosphate buffered saline (PBS) buffer and treated for one or 24 hours with the treatments indicated in the figure legends. At the end of the each treatment, cells including any floating cells in each well were collected and harvested by centrifugation at 290 g for 5 min at 4°C. The supernatants were discarded and cell pellets were washed once with PBS buffer and kept on ice or stored at −80°C for further use.
KGDHC activity assay
KGDHC catalyzes the following reaction: α-ketoglutarate + NAD+ + CoA → succinyl CoA + CO2 + NADH. The assay uses α-ketoglutarate to distinguish KGDHC produced NADH from NADH generated by other enzymes. Cell pellets were lysed with 250 μl of KGDHC lysis buffer, passed through a 1 ml syringe with a 27gange needle several times and KGDHC activities were assayed immediately as described previously [10].
MDH activity assay
MDH catalyzes the following reaction: L-malate+ NAD+ ⇄ oxaloacetate + NADH. The MDH activity was measured by an oxaloacetate-dependent NADH oxidation assay as described previously [13] with slight modifications. Briefly, cell pellets were lyzed in 250 μl of KGDHC lysis buffer [10] and passed through a 1 ml syringe with a 27 gauge needle several times. After incubation of the cell lysate at room temperature for 30 min, 20 μl of blank (lysis buffer), standards and samples were added to wells of a 96-well plate followed by addition of 140 μl of 100 mM potassium phosphate buffer (pH 7.2) and 20 μl of 20 mM oxaloacetic acid. The reaction was initiated by adding 20 μl of 10 mM NADH to the mixture. The plate was read at an excitation wavelength of 340 nm and an emission wavelength of 460 nm (cutoff 455 nm) at 25°C for 25 min using a SPECTRAmax GEMINI XS fluorescence micro-plate reader (Molecular Devices). The rate of NADH oxidation was corrected with NADH standard curve and normalized to protein contents as determined by a Bio-Rad protein assay based on the Bradford dye-binding method (Bio-Rad) using BSA as standard.
Real-time PCR
Total RNA was isolated from cells treated with H2O2 (0.1 and 1 mM) for one hr using a RNeasy Mini kit (Qiagen, Valencia, CA) according to the supplier’s instruction. This was followed by first strand cDNA synthesis using the First Strand cDNA synthesis kit for RT-PCR (AMV) (Roche Applied Science, Indianapolis, IN) with oligo-p(dT)15 as primer. Real-time PCR of cytoplasmic MDH (cMDH) and mitochondrial MDH (mMDH) was performed using an Applied Biosystems 7500 Real-Time PCR system with pre-designed Taqman® gene expression assays (Applied Biosystems, Foster City, CA). In brief, each amplification mixture (50 μl) contained 22.5 μl of cDNA template, 25 μl of TaqMan® Universal PCR Master Mix, 2.5 μl of a FAM™ dye labeled TaqMan® MGB probe and two PCR primers. Thermal cycler conditions were 95°C for 10 min, and 40 cycles of 95°C for 15 sec and 60°C for 1 min. All samples were normalized for beta-2-microglobulin (b2m) expression. A comparative Ct (the threshold cycle of PCR at which amplified product was first detected) method was used to compare the mRNA expression in samples treated with H2O2 to that of the untreated controls.
GSSG treatment, SDS-PAGE and Western blotting
KGDHC (Sigma) (200 μl) was loaded onto a 2% ABT Agarose column (Agarose Bead Technologies, Tampa, FL) to remove contaminating bovine serum albumin. Five of the fractions with the highest KGDHC activity from four column purifications were pooled and concentrated by Amicon Ultra-15 Centrifugal Filer Unit 100 (Millipore, Billerica, MA). Concentrated KGDHC was incubated with 0, 0.5 or 5 mM oxidized glutathione (GSSG) (Sigma, St. Louis, MO) in 100 mM phosphate buffer (PB) (pH 7.2) at 37°C for 30 min. At the end of incubation, 5X SDS-sample loading dye [50% glycerol, 250 mM Tris (pH 6.8), 10 mM EDTA, 10 % SDS and 0.04 % bromophenol blue] was added to the reaction mixture to achieve 1X final concentration. Electrophoresis was done with a 4-20% Tris-Glycine gel (Invitrogen; Carlsbad, CA) using 120 volts for 2.5 hr. Separated proteins were then electrotransferred to a nitrocellulose membrane (Amersham Biosciences; Piscataway, NJ) using 45 volts for 3 hr. Blots were blocked with Tris-buffered saline (TBS)/Ody Blocking buffer (LI-COR Biosciences, Lincoln, NE) (1:1 in volume) at 4°C overnight, and incubated with rabbit E1k, E2k or E3 antibody and anti-glutathione antibody (Virogen, Watertown, MA) (1:1,000 dilution) at room temperature for 3.5 hr. After washing thoroughly with TBS/0.1% Tween-20 at room temperature, the blots were incubated with Odyssey Goat anti-rabbit IRDye680 antibody and goat anti-mouse IRDye800CW antibody at room temperature for 1 hr (1:5,000; LI-COR Biosciences, Lincoln, NE). After extensive washing, the membranes were scanned by the Odyssey Infrared Imaging System (LI-COR Biosciences, Lincoln, NE).
Total free cellular glutathione measurement
Cell pellets were deproteinized by the addition of 150 μl of 5% ice-cold metaphosphoric acid (v/v). The samples were vortexed, incubated at 4°C for 25 min and revortexed. Samples were then centrifuged at 10,000 g for 10 min (4°C) to separate supernatants from the pellets. The supernatants were carefully transferred to new 1.5 ml tubes without disturbing the pellets and stored at −20°C for glutathione measurement. The pellets were solubilized with 1 N NaOH and the protein concentrations were measured using a Bio-Rad protein assay based on the Bradford dye-binding method (Bio-Rad) using bovine serum albumin (BSA) as standard.
The supernatants containing free thiols were diluted 6 fold with 0.3 M assay buffer (100 mM NaH2PO4 and 5 mM EDTA, pH 7.5). Total free glutathione was determined using a microplate method [43] based on the DTNB [5,5′-dithiobis-(2-nitrobenzoic acid)/enzymatic re-cycling procedure [44,45]. In brief, 50 μl of GSH standard or diluted sample extract was added to the wells of a 96-well plate followed by addition of 50 μl each of 1.26 mM DTNB and 2.5 u/ml of glutathione reductase (Sigma). After incubation at room temperature for 15 min, the reaction was started by the addition of 50 μl of 0.6 mg/ml of NADPH to each well. After addition of NADPH, the plate was immediately read in a SPECTRAmax microplate reader (Molecular Devices). The rate of change in absorbance at 410 nm was monitored for 3 min at 16-sec intervals. All standard and samples were run in duplicate in adjacent wells. Values were calculated with a GSH standard curve and normalized with protein contents measured by a Bio-Rad protein assay.
Results
Response of KGDHC and MDH activities to 1 hr of H2O2
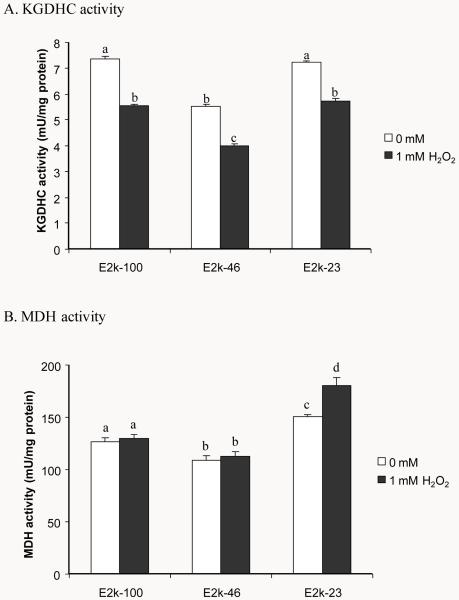
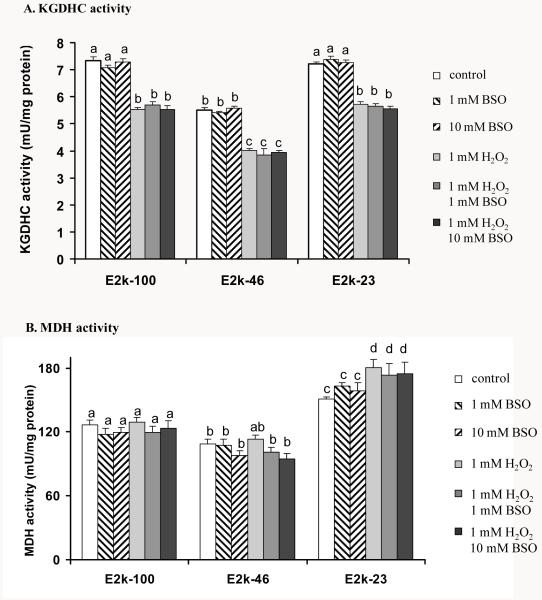
Whether H2O2 induces diverse changes of the KGDHC and MDH activities and whether E2k modulates these changes were tested in all three lines. H2O2 diminished the KGDHC activity by 24 % in all lines (Figure 1A). The MDH activity is elevated by 16% in the E2k-23 line under normal conditions (Figure 1B). Interestingly, one hr of H2O2 increased MDH activity by 15% but only in the E2k-23 line (Figure 1B).
Figure 1.
Response of KGDHC and MDH activities to one hr of H2O2. Values are means ± SEM of specific activity measured from at least three independent experiments in triplicate. Values with different letters differ significantly from each other (P<0.05) as determined by a one-way ANOVA followed by a Student-Newman-Keul’s test.
One hr of H2O2 elevated mRNA level of MDH
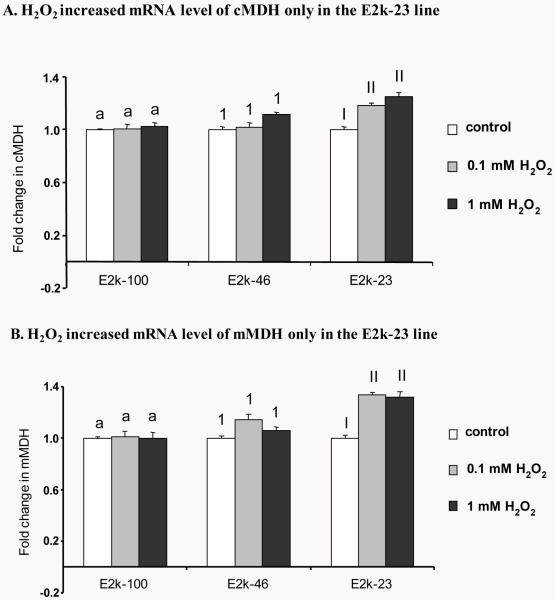
The MDH activity measures include both cytosolic and mitochondrial MDH activities. Although activity measures cannot distinguish between mitochondrial and cytosolic MDH, the two forms can be readily distinguished at the message level. Relative quantitative Real-time PCR was used to examine the changes in the levels of mRNA of cytosolic MDH (cMDH) and mitochondrial MDH (mMDH). H2O2 (1 hr) increased mRNA level of cMDH by 16% (0.1 mM H2O2) and 20% (1 mM H2O2) but only in the E2k-23 line (Figure 2A). Similarly, the mRNA level of mMDH was also elevated by 25% in response to one hr of H2O2 but only in the E2k-23 line (Figure 2B).
Figure 2.
Response of mRNA level of cMDH and mMDH to one hr of H2O2. Quantitative real-time PCR was employed to measure the mRNA levels of cytoplasmic MDH (cMDH) and mitochondrial MDH (mMDH) in the all three lines. Transcript quantitation was measured relative to β-2-microglobulin amplification from the same sample in parallel. Values in panels A and B are the mean ± SEM of fold changes above untreated controls from at least two independent experiments in triplicate. Different letters or numbers in each panel denotes values differ significantly from each other (P<0.05) as determined with a one-way ANOVA followed by a Student-Newman-Keul’s test.
Glutathionylation of KGDHC by GSSG
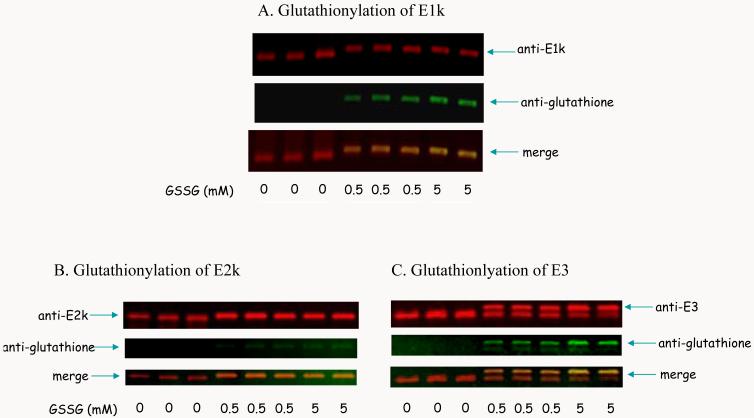
Glutathionylation of KGDHC is postulated from previous study [22]. Thus, whether purified KGDHC interacts with GSSG was tested by Western blotting. Western blot of E1k (red)/glutathione (green) showed that treatment of KGDHC with increased concentration of GSSG induced glutathionylation of E1k (Figure 3A). Western blot of E2k (red)/glutathione (green) showed that the immunoreactivity of glutathione increased with the increased concentration of GSSG (Figure 3B). GSSG decreased the immunoreactivity of E3 and increased and shifted the glutathionylated E3 in a dose dependent manner (Figure 3C).
Figure 3.
Glutathionylation of KGDHC by GSSG. Purified KGDHC was incubated with varying concentrations of GSSG followed by SDS-PAGE and Western blotting as described in the Experimental procedures. The blots were probed with antibodies to E1k (A), E2k (B) or E3 (C) (red) and to glutathione (green), respectively. The overlap is represented by yellow.
Response of total free cellular glutathione levels to one hour of BSO, H2O2 or H2O2/BSO
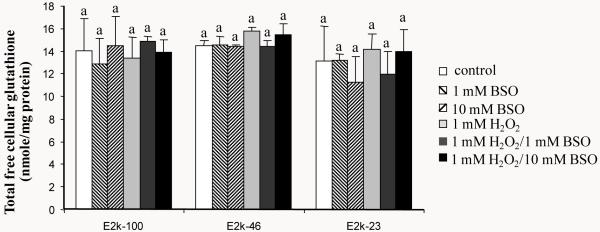
Cellular free glutathione level was manipulated by two means. BSO diminished glutathione by blocking its synthesis. H2O2 converts GSH to GSSG which binds to cellular proteins. One hour of BSO, H2O2 or H2O2/BSO did not alter the total free cellular glutathione levels (GSH and GSSG) in any of the three lines (Figure 4). Furthermore, the reduction of E2k had no effect on the total free cellular glutathione levels (Figure 4).
Figure 4.
Total free cellular glutathione levels in response to 1 hr of BSO, H2O2 or H2O2/BSO. Total free cellular glutathione was measured in the E2k-100, E2k-46 and E2k-23 lines treated with BSO, H2O2 or H2O2/BSO for one hr. Values represent the mean ± SEM of the total free cellular glutathione (nmole/mg protein) from at least three separate experiments in duplicate. Statistical significance was determined using a one-way ANOVA followed by a Student-Newman-Keul’s test. Values with same letters are not significantly different from each other (P>0.05).
Response of KGDHC and MDH activities to one hour of BSO, H2O2 or H2O2/BSO
The effect of BSO, H2O2 or H2O2/BSO on the KGDHC and MDH activities was tested. BSO did not alter either KGDHC or MDH activity in any line at any concentrations (Figure 5). Although no reduction in the total free cellular glutathione occurred at one hr treatment, H2O2 diminished the KGDHC activity by 24 % in all lines (Figure 1A and Figure 5A). Moreover, one hr of H2O2 increased MDH activity by 15% only in the E2k-23 line (Figure 1B and Figure 5B). Addition of BSO did not enhance the changes in the KGDHC or MDH activity induced by H2O2 (Figure 5).
Figure 5.
Response of KGDHC and MDH activities to one hr of BSO, H2O2 or H2O2/BSO. Values are the mean ± SEM of KGDHC (A) or MDH activity (B) (mU/mg protein) from at least three independent experiments in triplicate. Values with different letters are statistically different from each other (P<0.05) by a one-way ANOVA followed by a Student-Newman-Keul’s test.
Response of total free cellular glutathione levels to 24 hour of BSO, H2O2 or H2O2/BSO
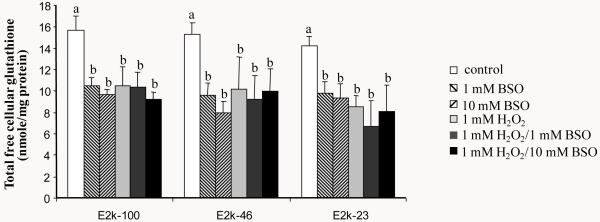
The total free cellular glutathione levels were measured in the three lines- E2k-100, E2k-46 and E2k-23 treated with BSO, H2O2 or H2O2/BSO for 24 hr. Twenty-four hour treatment depleted the total free cellular glutathione level by 30% to 48% in all three lines (Figure 6). The reductions in the total free cellular glutathione levels did not differ statistically among the three lines. Thus, the reduction in E2k did not alter BSO or H2O2-induced changes in the total free cellular glutathione.
Figure 6.
Total free cellular glutathione levels in response to 24 hr of BSO, H2O2 or H2O2/BSO. Total free cellular glutathione was measured in the E2k-100, E2k-46 and E2k-23 lines treated with BSO, H2O2 or H2O2/BSO for 24 hr. Values represent the mean ± SEM of the total free cellular glutathione (nmole/mg protein) from at least three separate experiments in duplicate. Statistical significance was determined using a one-way ANOVA followed by a Student-Newman-Keul’s test. Values with different letters are significantly different from each other (P<0.05).
Response of KGDHC and MDH activity to 24 hour of BSO, H2O2 or H2O2/BSO
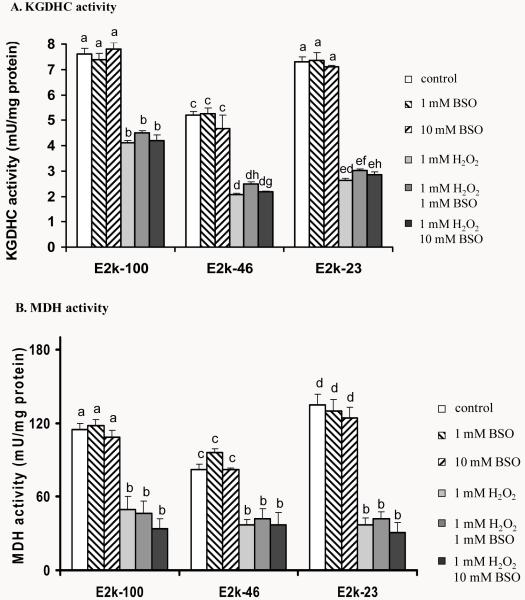
Although total free cellular glutathione declined significantly after 24 hr of exposure to 1 or 10 mM BSO, the activity of neither KGDHC (Figure 7A) nor MDH (Figure 7B) was altered in response to BSO. Twenty-four hour of H2O2 reduced the KGDHC activity greater in the E2k-46 (−60 %) and E2k-23 (−64 %) lines than in the E2k-100 control line (−45 %) (Figure 7A). Addition of BSO did not enhance the changes in the KGDHC activity induced by H2O2 (Figure 7A).
Figure 7.
The responses of KGDHC and MDH activities of the E2k-100, E2k-46 and E2k-23 lines to 24 hr of BSO, H2O2 or H2O2/BSO. Values are the mean ± SEM of KGDHC (A) or MDH activity (B) (mU/mg protein) from at least three independent experiments in triplicate. Values with different letters in each panel are significantly different from each other (P<0.05) as determined with a one-way ANOVA followed by a Student-Newman-Keul’s test.
Similarly, twenty-four hour of H2O2 reduced the MDH activity greater in the E2k-23 line (−73%) than in the E2k-100 (−56%) or the E2k-46 (−55%) lines (Figure 7B). BSO did not enhance the changes in MDH activity induced by H2O2 (Figure 7B).
Discussion
Diverse changes in the KGDHC and MDH activities occur in AD brain [13]. The underlying mechanism of these changes in AD is unknown. Our data shows that a short exposure of cells to H2O2 diminished KGDHC activity and increased MDH activity. While the decrease in KGDHC was independent of E2k, the increased MDH occurred only in the E2k-23 line in which the E2k is reduced by more than 75%. Thus, one common oxidant, H2O2, can mimic the diminished KGDHC and increased MDH that occur in AD brain. Further, the effectiveness of H2O2 on MDH is modified by the levels of E2k protein. H2O2 also exaggerates the endoplasmic reticulum calcium content, another characteristic of cells from AD patient [14]. Thus, the data supports the possibility that multiple changes in AD maybe induced by specific oxidants.
The H2O2-induced increase in MDH is at least partly due to alterations in transcription. Increased MDH activity by H2O2 (1 hr) in the E2k-23 line is associated with the elevated mRNA levels of both cytosolic and mitochondrial MDH. H2O2 increases DCF-detectable reactive oxygen species (ROS) generation more in the E2k-23 line than in either the E2k-100 or E2k-46 line [42]. Oxidative stress up-regulates redox sensitive transcription factors such as activator protein 1 (AP-1) [46]. The potential binding site of AP-1 is predicted in the MDH promoter region. Thus, it is possible that the greater increase in ROS in the E2k-23 line may act on transcription of MDH which may lead to the increase in the MDH activity. Further studies on transcriptional regulation of MDH are necessary to explore the mechanism of elevated MDH activity in response to diminished E2k at early stages of oxidative stress.
Glutathione, a major free radical scavenger, is diminished in a number of neuro-degenerative diseases [47,48,49]. Depletion of glutathione has been associated with inhibition of mitochondrial complex I, II, III and IV activities in neuronal cells [50], and is hypothesized to be an initial factor in oxidative stress-mediated neurodegeneration [51]. The oxidative stress that is associated with neurodegenerative diseases including AD may initiate an interaction of glutathione with metabolically important mitochondrial enzymes. For example, mitochondrial NADP+-dependent isocitrate dehydrogenase (IDPm) activity is inactivated through glutathionylation [52]. The activity of this enzyme is also diminished in brains from AD patients [13]. The present study on the interaction of purified KGDHC with GSSG demonstrated that glutathionylation can occur in all three subunits of KGDHC. This suggests that the stimulation of GSSG formation by oxidative stress may modulate KGDHC and modify its normal function.
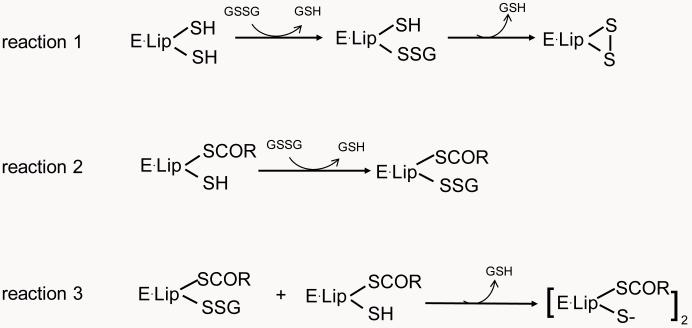
To test the possible regulation of KGDHC by glutathionylation in cells, the level of free glutathione was manipulated by treating cells with either BSO or H2O2 and the consequences on KGDHC and MDH activities were tested. Total free cellular glutathione was not diminished by one hour treatment with either BSO or H2O2. Nevertheless, the possible interaction of KGDHC with glutathione following H2O2 cannot be excluded. Isolated KGDHC is inhibited only by high concentrations of H2O2 (10 mM) [22]. Lower concentrations of H2O2 do not affect the isolated enzyme or detergent-solubilized mitochondria, but do inhibit KGDHC in intact mitochondria [41] and in mammalian cells [23]. These data suggest that inactivation of KGDHC activity is not due to the direct interaction of peroxide with the enzyme, but is through redox-sensitive mechanism(s). Redox-regulated glutathionylation or deglutathionylation is one possible mechanism to account for the inactivation of KGDHC by H2O2 [41]. H2O2, but not BSO, diminished KGDHC activity. H2O2 causes accumulation of oxidized glutathione (GSSG) that can further form mixed disulfide with cellular protein thiols or intraprotein disulfides [53,54,55,56]. Formation of an intraprotein disulfide is more common when there are adjacent protein thiols [57,58]. The unique feature of E2k is its bound lipoic acid with adjacent sulfhydryl groups that is cycled between thiol and disulfide bond during catalysis. Thus, it is likely that initial glutathionylation of KGDHC occurs at the E2k subunit and is only transient as its adjacent thiol displaces the GS− to form an intraprotein disulfide (reaction 1, Figure 8). In addition, another E2k intermediate [E2k•Lip(SCoR)(SH)] can react with GSSG and form E2k•Lip(SCoR)(S-SG) (reaction 2, Figure 8) which can further react with [E2k•Lip(SCoR)(SH)] (reaction 3, Figure 8). Therefore, at early stages of oxidative stress, interaction of GSSG with the E2k of KGDHC would be expected to limit NADH production and reduce KGDHC activity without alteration of glutathione level.
Figure 8.
Possible interaction of E2k of KGDHC with glutathione. The KGDH complex catalyzes decarboxylation of α-ketoglutarate, reductive acylation of the lipoyl moiety and reoxidation of the dihydrolipoyl moiety, and generates succinyl-CoA and NADH. E2k contains a lipoyl moiety which is swung between the other two subunits (E1k and E3) during catalysis. The thiol and disulfide of lipoyl moiety cycles during the catalysis. E·Lip(SH)(SH), E·Lip(SCOR)(SH) and E·Lip(S)2 are intermediates of E2k subunit during catalysis. Glutathionylation of E2k is only transient as its adjacent thiol displaces the GS− to form an intraprotein disulfide (reaction 1). In addition, another E2k intermediate [E2k•Lip(SCoR)(SH)] can react with GSSG and form E2k•Lip(SCoR)(S-SG) (reaction 2) which can further react with [E2k•Lip(SCoR)(SH)] to form a disulfide product [E2k•Lip(SCoR)(S−)]2 (reaction 3).
Although the 24-hour treatment with BSO or H2O2 reduced the total free cellular glutathione level similarly in all lines, H2O2, but not BSO, diminished both KGDHC and MDH activities significantly. In addition, H2O2 reduced both KGDHC and MDH activities most dramatically in the E2k-23 line compared to the other two lines. It is known that the GSH/GSSG ratio can be buffered by reaction of GSSG with cellular proteins to liberate one (reaction I) or two GSH (reaction II).
| reaction I |
| reaction II |
The E1k, E2k or E3 subunit of KGDHC contain 21, 6 or 10 cysteine residues, respectively. Similar reduction of the total free cellular glutathione in all lines induced by 24 hr of H2O2 could be a result of glutathionylation of proteins including the three subunits of KGDHC. This reaction with E2k would be in addition to its transient interaction with the E2k of KGDHC. The level of E2k would then become a limiting factor upon its formation of intraprotein disulfide mediated by GSSG. Therefore, greater reduction of the KGDHC activity in the E2k diminished cells may occur as observed in the E2k-46 and E2k-23 lines. Moreover, immunoblotting studies on the interaction of purified KGDHC with GSSG provided another piece of evidence that glutathionylation can occur in all three subunits of the complex. Taken together, our findings indicate that glutathione interacts with KGDHC under H2O2-induced oxidative stress and that this may account for the decline in activity. Furthermore, other mechanisms are also likely to contribute to the inhibition. For example, under pathological conditions in which cytosolic Ca2+ is greatly elevated, mitochondrial Ca2+ may reach levels that will inactivate KGDHC [14,59].
Oxidative stress-induced glutathionylation of MDH may contribute to the diminished activity in cells treated with H2O2 (24 hr). MDH has been shown to be glutathionylated during oxidative stress [60], and it is inactivated by GSSG (our unpublished data). Inhibition of KGDHC by H2O2 limits the amount of reducing equivalents NADH [61]. NADPH is an essential reducing equivalent for both regeneration of GSH by glutathione reductase and NADPH-dependent Trx system which are two important antioxidant defense systems. NADPH can be generated through NADP linked malic enzyme, NADP linked isocitrate dehydrogenase or nicotinamide nucleotide transhydrogenase. Latter converts NADH to NADPH when an increased demand is imposed by H2O2 [61,62]. Thus, less amount of NADH available in the E2k-23 line induced by H2O2 would further exaggerate oxidative stress and give rise to more profound loss of the MDH activity (−73%).
In summary, concentrations of H2O2 that diminished KGDHC activity increased MDH activity. The results mimic the changes found in AD. The response of KGDHC and MDH activities to H2O2 was altered by the E2k levels. These findings suggest that the E2k component of KGDHC may mediate diverse responses of KGDHC and other TCA cycle enzymes to oxidants. In addition, the differential response of activities to BSO and H2O2 together with the in vitro interaction of KGDHC with GSSG suggests that glutathionylation is one possible mechanism underlying inhibition of the TCA cycle enzymes under oxidative stress.
Acknowledgments
This work was supported by NIH grants AG14600, AG11921 and AG14930.
References
- [1].Rapoport SI, Horwitz B, Grady CL, Haxby JV, DeCarli C, Schapiro MB. Abnormal brain glucose metabolism in Alzheimer’s disease, as measured by position emission tomography. Adv Exp Med Biol. 1991;291:231–48. doi: 10.1007/978-1-4684-5931-9_18. [DOI] [PubMed] [Google Scholar]
- [2].Benson DF, Kuhl DE, Hawkins RA, Phelps ME, Cummings JL, Tsai SY. The fluorodeoxyglucose 18F scan in Alzheimer’s disease and multi-infarct dementia. Arch Neurol. 1983;40:711–4. doi: 10.1001/archneur.1983.04050110029003. [DOI] [PubMed] [Google Scholar]
- [3].Markesbery WR, Carney JM. Oxidative alterations in Alzheimer’s disease. Brain Pathol. 1999;9:133–46. doi: 10.1111/j.1750-3639.1999.tb00215.x. [DOI] [PMC free article] [PubMed] [Google Scholar]
- [4].Smith GS, de Leon MJ, George AE, Kluger A, Volkow ND, McRae T, Golomb J, Ferris SH, Reisberg B, Ciaravino J, et al. Topography of cross-sectional and longitudinal glucose metabolic deficits in Alzheimer’s disease. Pathophysiologic implications. Arch Neurol. 1992;49:1142–50. doi: 10.1001/archneur.1992.00530350056020. [DOI] [PubMed] [Google Scholar]
- [5].Smith MA, Rottkamp CA, Nunomura A, Raina AK, Perry G. Oxidative stress in Alzheimer’s disease. Biochim Biophys Acta. 2000;1502:139–44. doi: 10.1016/s0925-4439(00)00040-5. [DOI] [PubMed] [Google Scholar]
- [6].Butterworth RF, Besnard AM. Thiamine-dependent enzyme changes in temporal cortex of patients with Alzheimer’s disease. Metab Brain Dis. 1990;5:179–84. doi: 10.1007/BF00997071. [DOI] [PubMed] [Google Scholar]
- [7].Krugel U, Bigl V, Eschrich K, Bigl M. Deafferentation of the septo-hippocampal pathway in rats as a model of the metabolic events in Alzheimer’s disease. Int J Dev Neurosci. 2001;19:263–77. doi: 10.1016/s0736-5748(01)00010-7. [DOI] [PubMed] [Google Scholar]
- [8].Perry EK, Perry RH, Tomlinson BE, Blessed G, Gibson PH. Coenzyme A-acetylating enzymes in Alzheimer’s disease: possible cholinergic ‘compartment’ of pyruvate dehydrogenase. Neurosci Lett. 1980;18:105–10. doi: 10.1016/0304-3940(80)90220-7. [DOI] [PubMed] [Google Scholar]
- [9].Sorbi S, Bird ED, Blass JP. Decreased pyruvate dehydrogenase complex activity in Huntington and Alzheimer brain. Ann Neurol. 1983;13:72–8. doi: 10.1002/ana.410130116. [DOI] [PubMed] [Google Scholar]
- [10].Gibson GE, Sheu KF, Blass JP, Baker A, Carlson KC, Harding B, Perrino P. Reduced activities of thiamine-dependent enzymes in the brains and peripheral tissues of patients with Alzheimer’s disease. Arch Neurol. 1988;45:836–40. doi: 10.1001/archneur.1988.00520320022009. [DOI] [PubMed] [Google Scholar]
- [11].Mastrogiacomo F, Bergeron C, Kish SJ. Brain alpha-ketoglutarate dehydrogenase complex activity in Alzheimer’s disease. J Neurochem. 1993;61:2007–14. doi: 10.1111/j.1471-4159.1993.tb07436.x. [DOI] [PubMed] [Google Scholar]
- [12].Terwel D, Bothmer J, Wolf E, Meng F, Jolles J. Affected enzyme activities in Alzheimer’s disease are sensitive to antemortem hypoxia. J Neurol Sci. 1998;161:47–56. doi: 10.1016/s0022-510x(98)00240-8. [DOI] [PubMed] [Google Scholar]
- [13].Bubber P, Haroutunian V, Fisch G, Blass JP, Gibson GE. Mitochondrial abnormalities in Alzheimer brain: mechanistic implications. Ann Neurol. 2005;57:695–703. doi: 10.1002/ana.20474. [DOI] [PubMed] [Google Scholar]
- [14].Gibson GE, Zhang H, Xu H, Park LC, Jeitner TM. Oxidative stress increases internal calcium stores and reduces a key mitochondrial enzyme. Biochim Biophys Acta. 2002;1586:177–89. doi: 10.1016/s0925-4439(01)00091-6. [DOI] [PubMed] [Google Scholar]
- [15].Pettit FH, Hamilton L, Munk P, Namihira G, Eley MH, Willms CR, Reed LJ. Alpha-keto acid dehydrogenase complexes. XIX. Subunit structure of the Escherichia coli alpha-ketoglutarate dehydrogenase complex. J Biol Chem. 1973;248:5282–90. [PubMed] [Google Scholar]
- [16].Gibson GE, Kingsbury AE, Xu H, Lindsay JG, Daniel S, Foster OJ, Lees AJ, Blass JP. Deficits in a tricarboxylic acid cycle enzyme in brains from patients with Parkinson’s disease. Neurochem Int. 2003;43:129–35. doi: 10.1016/s0197-0186(02)00225-5. [DOI] [PubMed] [Google Scholar]
- [17].Jimenez-Jimenez FJ, Molina JA, Hernanz A, Fernandez-Vivancos E, de Bustos F, Barcenilla B, Gomez-Escalonilla C, Zurdo M, Berbel A, Villanueva C. Cerebrospinal fluid levels of thiamine in patients with Parkinson’s disease. Neurosci Lett. 1999;271:33–6. doi: 10.1016/s0304-3940(99)00515-7. [DOI] [PubMed] [Google Scholar]
- [18].Mizuno Y, Matuda S, Yoshino H, Mori H, Hattori N, Ikebe S. An immunohistochemical study on alpha-ketoglutarate dehydrogenase complex in Parkinson’s disease. Ann Neurol. 1994;35:204–10. doi: 10.1002/ana.410350212. [DOI] [PubMed] [Google Scholar]
- [19].Park LC, Albers DS, Xu H, Lindsay JG, Beal MF, Gibson GE. Mitochondrial impairment in the cerebellum of the patients with progressive supranuclear palsy. J Neurosci Res. 2001;66:1028–34. doi: 10.1002/jnr.10062. [DOI] [PubMed] [Google Scholar]
- [20].Albers DS, Augood SJ, Park LC, Browne SE, Martin DM, Adamson J, Hutton M, Standaert DG, Vonsattel JP, Gibson GE, Beal MF. Frontal lobe dysfunction in progressive supranuclear palsy: evidence for oxidative stress and mitochondrial impairment. J Neurochem. 2000;74:878–81. doi: 10.1046/j.1471-4159.2000.740878.x. [DOI] [PubMed] [Google Scholar]
- [21].Butterworth RF, Kril JJ, Harper CG. Thiamine-dependent enzyme changes in the brains of alcoholics: relationship to the Wernicke-Korsakoff syndrome. Alcohol Clin Exp Res. 1993;17:1084–8. doi: 10.1111/j.1530-0277.1993.tb05668.x. [DOI] [PubMed] [Google Scholar]
- [22].Jeitner TM, Xu H, Gibson GE. Inhibition of the alpha-ketoglutarate dehydrogenase complex by the myeloperoxidase products, hypochlorous acid and mono-N-chloramine. J Neurochem. 2005;92:302–10. doi: 10.1111/j.1471-4159.2004.02868.x. [DOI] [PubMed] [Google Scholar]
- [23].Gibson GE. Interactions of oxidative stress with cellular calcium dynamics and glucose metabolism in Alzheimer’s disease. Free Radic Biol Med. 2002;32:1061–70. doi: 10.1016/s0891-5849(02)00802-x. [DOI] [PubMed] [Google Scholar]
- [24].Humphries KM, Szweda LI. Selective inactivation of alpha-ketoglutarate dehydrogenase and pyruvate dehydrogenase: reaction of lipoic acid with 4-hydroxy-2-nonenal. Biochemistry. 1998;37:15835–41. doi: 10.1021/bi981512h. [DOI] [PubMed] [Google Scholar]
- [25].Park LC, Zhang H, Sheu KF, Calingasan NY, Kristal BS, Lindsay JG, Gibson GE. Metabolic impairment induces oxidative stress, compromises inflammatory responses, and inactivates a key mitochondrial enzyme in microglia. J Neurochem. 1999;72:1948–58. doi: 10.1046/j.1471-4159.1999.0721948.x. [DOI] [PubMed] [Google Scholar]
- [26].Sheu KF, Calingasan NY, Lindsay JG, Gibson GE. Immunochemical characterization of the deficiency of the alpha-ketoglutarate dehydrogenase complex in thiamine-deficient rat brain. J Neurochem. 1998;70:1143–50. doi: 10.1046/j.1471-4159.1998.70031143.x. [DOI] [PubMed] [Google Scholar]
- [27].Butterworth RF, Giguere JF, Besnard AM. Activities of thiamine-dependent enzymes in two experimental models of thiamine-deficiency encephalopathy. 2. alpha-Ketoglutarate dehydrogenase. Neurochem Res. 1986;11:567–77. doi: 10.1007/BF00965326. [DOI] [PubMed] [Google Scholar]
- [28].Nulton-Persson AC, Szweda LI. Modulation of mitochondrial function by hydrogen peroxide. J Biol Chem. 2001;276:23357–61. doi: 10.1074/jbc.M100320200. [DOI] [PubMed] [Google Scholar]
- [29].Chinopoulos C, Tretter L, Adam-Vizi V. Depolarization of in situ mitochondria due to hydrogen peroxide-induced oxidative stress in nerve terminals: inhibition of alpha-ketoglutarate dehydrogenase. J Neurochem. 1999;73:220–8. doi: 10.1046/j.1471-4159.1999.0730220.x. [DOI] [PubMed] [Google Scholar]
- [30].Dupourque D, Kun E. Malate dehydrogenases of ox kidney. 2. Two substrate kinetic and inhibition analyses. Eur J Biochem. 1969;7:247–52. doi: 10.1111/j.1432-1033.1969.tb19599.x. [DOI] [PubMed] [Google Scholar]
- [31].Bleile DM, Foster M, Brady JW, Harrison JH. Identification of essential arginyl residues in cytoplasmic malate dehydrogenase with butanedione. J Biol Chem. 1975;250:6222–7. [PubMed] [Google Scholar]
- [32].Hagopian K, Ramsey JJ, Weindruch R. Krebs cycle enzymes from livers of old mice are differentially regulated by caloric restriction. Exp Gerontol. 2004;39:1145–54. doi: 10.1016/j.exger.2004.04.009. [DOI] [PubMed] [Google Scholar]
- [33].Dringen R. Metabolism and functions of glutathione in brain. Prog Neurobiol. 2000;62:649–71. doi: 10.1016/s0301-0082(99)00060-x. [DOI] [PubMed] [Google Scholar]
- [34].Meister A. Glutathione metabolism and its selective modification. J Biol Chem. 1988;263:17205–8. [PubMed] [Google Scholar]
- [35].Toborek M, Hennig B. Fatty acid-mediated effects on the glutathione redox cycle in cultured endothelial cells. Am J Clin Nutr. 1994;59:60–5. doi: 10.1093/ajcn/59.1.60. [DOI] [PubMed] [Google Scholar]
- [36].Deneke SM, Fanburg BL. Regulation of cellular glutathione. Am J Physiol. 1989;257:L163–73. doi: 10.1152/ajplung.1989.257.4.L163. [DOI] [PubMed] [Google Scholar]
- [37].Aksenov MY, Markesbery WR. Changes in thiol content and expression of glutathione redox system genes in the hippocampus and cerebellum in Alzheimer’s disease. Neurosci Lett. 2001;302:141–5. doi: 10.1016/s0304-3940(01)01636-6. [DOI] [PubMed] [Google Scholar]
- [38].Jenner P, Dexter DT, Sian J, Schapira AH, Marsden CD, The Royal Kings and Queens Parkinson’s Disease Research Group Oxidative stress as a cause of nigral cell death in Parkinson’s disease and incidental Lewy body disease. Ann Neurol. 1992;32(Suppl):S82–7. doi: 10.1002/ana.410320714. [DOI] [PubMed] [Google Scholar]
- [39].Schulz JB, Lindenau J, Seyfried J, Dichgans J. Glutathione, oxidative stress and neurodegeneration. Eur J Biochem. 2000;267:4904–11. doi: 10.1046/j.1432-1327.2000.01595.x. [DOI] [PubMed] [Google Scholar]
- [40].Hurd TR, Costa NJ, Dahm CC, Beer SM, Brown SE, Filipovska A, Murphy MP. Glutathionylation of mitochondrial proteins. Antioxid Redox Signal. 2005;7:999–1010. doi: 10.1089/ars.2005.7.999. [DOI] [PubMed] [Google Scholar]
- [41].Nulton-Persson AC, Starke DW, Mieyal JJ, Szweda LI. Reversible inactivation of alpha-ketoglutarate dehydrogenase in response to alterations in the mitochondrial glutathione status. Biochemistry. 2003;42:4235–42. doi: 10.1021/bi027370f. [DOI] [PubMed] [Google Scholar]
- [42].Shi Q, Chen HL, Xu H, Gibson GE. Reduction in the E2k subunit of the alpha-ketoglutarate dehydrogenase complex has effects independent of complex activity. J Biol Chem. 2005;280:10888–96. doi: 10.1074/jbc.M409064200. [DOI] [PubMed] [Google Scholar]
- [43].Kleinman WA, Komninou D, Leutzinger Y, Colosimo S, Cox J, Lang CA, Richie JP., Jr. Protein glutathiolation in human blood. Biochem Pharmacol. 2003;65:741–6. doi: 10.1016/s0006-2952(02)01560-5. [DOI] [PubMed] [Google Scholar]
- [44].Tietze F. Enzymic method for quantitative determination of nanogram amounts of total and oxidized glutathione: applications to mammalian blood and other tissues. Anal Biochem. 1969;27:502–22. doi: 10.1016/0003-2697(69)90064-5. [DOI] [PubMed] [Google Scholar]
- [45].Owens CW, Belcher RV. A colorimetric micro-method for the determination of glutathione. Biochem J. 1965;94:705–11. doi: 10.1042/bj0940705. [DOI] [PMC free article] [PubMed] [Google Scholar]
- [46].Meyer M, Schreck R, Baeuerle PA. H2O2 and antioxidants have opposite effects on activation of NF-kappa B and AP-1 in intact cells: AP-1 as secondary antioxidant-responsive factor. EMBO J. 1993;12:2005–15. doi: 10.1002/j.1460-2075.1993.tb05850.x. [DOI] [PMC free article] [PubMed] [Google Scholar]
- [47].Aksenov MY, Markesbery WR. Changes in thiol content and expression of glutathione redox system genes in the hippocampus and cerebellum in Alzheimer’s disease. Neurosci Lett. 2001;302:141–5. doi: 10.1016/s0304-3940(01)01636-6. [DOI] [PubMed] [Google Scholar]
- [48].Jenner P, Dexter DT, Sian J, Schapira AH, Marsden CD, The Royal Kings and Queens Parkinson’s Disease Research Group Oxidative stress as a cause of nigral cell death in Parkinson’s disease and incidental Lewy body disease. Ann Neurol. 1992;32(Suppl):S82–7. doi: 10.1002/ana.410320714. [DOI] [PubMed] [Google Scholar]
- [49].Schulz JB, Lindenau J, Seyfried J, Dichgans J. Glutathione, oxidative stress and neurodegeneration. Eur J Biochem. 2000;267:4904–11. doi: 10.1046/j.1432-1327.2000.01595.x. [DOI] [PubMed] [Google Scholar]
- [50].Bolanos JP, Heales SJ, Peuchen S, Barker JE, Land JM, Clark JB. Nitric oxide-mediated mitochondrial damage: a potential neuroprotective role for glutathione. Free Radic Biol Med. 1996;21:995–1001. doi: 10.1016/s0891-5849(96)00240-7. [DOI] [PubMed] [Google Scholar]
- [51].Bains JS, Shaw CA. Neurodegenerative disorders in humans: the role of glutathione in oxidative stress-mediated neuronal death. Brain Res Brain Res Rev. 1997;25:335–58. doi: 10.1016/s0165-0173(97)00045-3. [DOI] [PubMed] [Google Scholar]
- [52].Kil IS, Park JW. Regulation of mitochondrial NADP+-dependent isocitrate dehydrogenase activity by glutathionylation. J Biol Chem. 2005;280:10846–54. doi: 10.1074/jbc.M411306200. [DOI] [PubMed] [Google Scholar]
- [53].De Wit R, Makkinje M, Boonstra J, Verkleij AJ, Post JA. Hydrogen peroxide reversibly inhibits epidermal growth factor (EGF) receptor internalization and coincident ubiquitination of the EGF receptor and Eps15. FASEB J. 2001;15:306–8. doi: 10.1096/fj.00-0454fje. [DOI] [PubMed] [Google Scholar]
- [54].Liddell JR, Hoepken HH, Crack PJ, Robinson SR, Dringen R. Glutathione peroxidase 1 and glutathione are required to protect mouse astrocytes from iron-mediated hydrogen peroxide toxicity. J Neurosci Res. 2006;84:578–86. doi: 10.1002/jnr.20957. [DOI] [PubMed] [Google Scholar]
- [55].Devine PJ, Sipes IG, Hoyer PB. Effect of 4-vinylcyclohexene diepoxide dosing in rats on GSH levels in liver and ovaries. Toxicol Sci. 2001;62:315–20. doi: 10.1093/toxsci/62.2.315. [DOI] [PubMed] [Google Scholar]
- [56].Noda T, Iwakiri R, Fujimoto K, Aw TY. Induction of mild intracellular redox imbalance inhibits proliferation of CaCo-2 cells. FASEB J. 2001;15:2131–9. doi: 10.1096/fj.01-0131com. [DOI] [PubMed] [Google Scholar]
- [57].Beer SM, Taylor ER, Brown SE, Dahm CC, Costa NJ, Runswick MJ, Murphy MP. Glutaredoxin 2 catalyzes the reversible oxidation and glutathionylation of mitochondrial membrane thiol proteins: implications for mitochondrial redox regulation and antioxidant DEFENSE. J Biol Chem. 2004;279:47939–51. doi: 10.1074/jbc.M408011200. [DOI] [PubMed] [Google Scholar]
- [58].Gilbert HF. Redox control of enzyme activities by thiol/disulfide exchange. Methods Enzymol. 1984;107:330–51. doi: 10.1016/0076-6879(84)07022-1. [DOI] [PubMed] [Google Scholar]
- [59].Gibson GE, Park LC, Sheu KF, Blass JP, Calingasan NY. The alpha-ketoglutarate dehydrogenase complex in neurodegeneration. Neurochem Int. 2000;36:97–112. doi: 10.1016/s0197-0186(99)00114-x. [DOI] [PubMed] [Google Scholar]
- [60].Eaton P, Shattock MJ. Purification of proteins susceptible to oxidation at cysteine residues: identification of malate dehydrogenase as a target for S-glutathiolation. Ann N Y Acad Sci. 2002;973:529–32. doi: 10.1111/j.1749-6632.2002.tb04694.x. [DOI] [PubMed] [Google Scholar]
- [61].Tretter L, Adam-Vizi V. Inhibition of Krebs cycle enzymes by hydrogen peroxide: A key role of alpha-ketoglutarate dehydrogenase in limiting NADH production under oxidative stress. J Neurosci. 2000;20:8972–9. doi: 10.1523/JNEUROSCI.20-24-08972.2000. [DOI] [PMC free article] [PubMed] [Google Scholar]
- [62].Hoek JB, Rydstrom J. Physiological roles of nicotinamide nucleotide transhydrogenase. Biochem J. 1988;254:1–10. doi: 10.1042/bj2540001. [DOI] [PMC free article] [PubMed] [Google Scholar]


