Abstract
Human genomes are now being rapidly sequenced, but not all forms of genetic variation are routinely characterized. In this study, we focus on Alu retrotransposition events and seek to characterize differences in the pattern of mobile insertion between individuals based on the analysis of eight human genomes sequenced using next-generation sequencing. Applying a rapid read-pair analysis algorithm, we discover 4342 Alu insertions not found in the human reference genome and show that 98% of a selected subset (63/64) experimentally validate. Of these new insertions, 89% correspond to AluY elements, suggesting that they arose by retrotransposition. Eighty percent of the Alu insertions have not been previously reported and more novel events were detected in Africans when compared with non-African samples (76% vs. 69%). Using these data, we develop an experimental and computational screen to identify ancestry informative Alu retrotransposition events among different human populations.
The discovery of the Alu elements more than 30 years ago (Schmid and Deininger 1975; Houck et al. 1979) as ∼300 basepairs (bp) interspersed repeat sequences commonly found within the introns of genes (Deininger et al. 1981) prompted an active area of research to address the role of mobile elements in genome evolution and human disease (Batzer and Deininger 2002). More than one million Alu retrotransposons comprise over 10% of the human genome sequence (International Human Genome Sequencing Consortium 2001, 2004; Batzer and Deininger 2002). They are partitioned into numerous subfamilies, which have been active at different time points during primate evolution (Price et al. 2004; Liu et al. 2009). Currently, ∼30 distinct categories of Alu subfamilies are recognized (Mills et al. 2007) with AluYa5 and AluYb8 being most active in the human lineage (Carroll et al. 2001). Alu retrotranspositions have numerous consequences leading to insertional mutations, gene conversion, recombination, alterations in gene expression, pseudogenization, structural variation, and formation of segmental duplications (Batzer and Deininger 2002; Bailey et al. 2003; Jurka et al. 2004; Xing et al. 2009).
Traditional methods to detect Alu insertion polymorphisms involve polymerase chain reaction (PCR) where putative polymorphic loci are genotyped one by one (Bamshad et al. 2003; Salem et al. 2003; Cordaux et al. 2007). Recently, PCR-based capture and high-throughput sequencing methods have been applied to quickly screen thousands of mobile element transposition events (Ewing and Kazazian 2010; Witherspoon et al. 2010). Although promising, these methods also require the design of appropriate PCR primers and are susceptible to cloning failures. Other methods to detect retrotransposons include paired-end and full fosmid sequencing (Kidd et al. 2008, 2010; Beck et al. 2010), transposon insertion profiling by microarray (Huang et al. 2010), and restriction enzyme profiling followed by Sanger and 454 Life Sciences (Roche) sequencing (Iskow et al. 2010). Whole-genome shotgun sequencing (WGS) of different individuals (Levy et al. 2007; Bentley et al. 2008; Wang et al. 2008; Wheeler et al. 2008; McKernan et al. 2009) provides a resource to discover Alu element insertions at a much higher scale and throughput. However, such findings are limited by the read length of the sequencing platform (Xing et al. 2009), and few studies have attempted to systematically discover these events at the individual genome level.
We recently described a computational method to discover mobile element insertions in genomes sequenced by paired-end next-generation sequencing (NGS) platforms (Hormozdiari et al. 2010). Based on our structural variation detection algorithm, VariationHunter (Hormozdiari et al. 2009), our method follows the “repeat anchored mapping” approach (Kidd et al. 2008; Marques-Bonet et al. 2009) to effectively cluster paired-end reads where one end maps to an annotated repeat element and its mate maps to a position within the genome. We previously demonstrated the sensitivity and specificity of our algorithm by simulation, proving its detection power (Hormozdiari et al. 2010). Here, we apply this algorithm to construct Alu retrotransposition maps from the genomes of eight human individuals sequenced with the Illumina platform. In addition, we also analyze one Yoruban trio from Ibadan, Nigeria, and describe the properties of parent-to-child Alu transmission.
Results
Discovery and validation
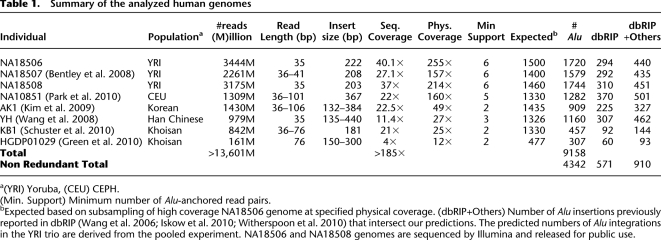
We downloaded WGS data (http://www.ncbi.nlm.nih.gov/Traces/sra/sra.cgi) from the genomes of eight human individuals generated using the Illumina paired-end sequencing technology (Table 1). We considered individuals from different populations, including three Yoruban individuals from Ibadan, Nigeria (YRI: NA18506, NA18507, and NA18508) (Bentley et al. 2008), one Center d'Etude du Polymorphisme Humain (CEPH) individual of European origin (Utah resident with ancestry from northwestern Europe, CEU: NA10851) (Park et al. 2010), two Khoisan individuals from southern Africa [KB1 (Schuster et al. 2010) and HGDP01029 (Green et al. 2010)], one Han Chinese (YH) (Wang et al. 2008), and one Altaic Korean (AK1) (Kim et al. 2009). The three Yoruban genomes constitute a parent–child trio, providing us the opportunity to study transmission of Alu insertions (Table 1).
Table 1.
Summary of the analyzed human genomes
a(YRI) Yoruba, (CEU) CEPH.
(Min. Support) Minimum number of Alu-anchored read pairs.
bExpected based on subsampling of high coverage NA18506 genome at specified physical coverage. (dbRIP+Others) Number of Alu insertions previously reported in dbRIP (Wang et al. 2006; Iskow et al. 2010; Witherspoon et al. 2010) that intersect our predictions. The predicted numbers of Alu integrations in the YRI trio are derived from the pooled experiment. NA18506 and NA18508 genomes are sequenced by Illumina and released for public use.
We computationally predicted novel Alu insertion loci using an algorithm that analyzes short paired-end sequence data (Hormozdiari et al. 2010). Briefly, we mapped the WGS data using mrFAST (Alkan et al. 2009) to the reference genome (National Center for Biotechnology Information [NCBI] Build 36) and identified all discordant read pairs. We then realigned such reads to both the reference genome and a database of Alu consensus sequences using a modified version of mrsFAST (Hach et al. 2010). We applied VariationHunter-2 (Hormozdiari et al. 2010) to predict Alu insertions in the sequenced samples, dynamically adjusting the minimum read support as a function of sequence and physical coverage of each analyzed genome (Table 1). We adjusted the number of paired-end reads supporting each Alu insertion using the genome sequenced at the deepest coverage (NA18506) and down-sampling to the observed coverage, thereby defining the minimum support for each genome sequence (Table 1). We achieved this by first identifying the clusters of paired reads supporting Alu insertion sites in the NA18506 genome and then calculating the expected number of Alu clusters for a given minimum support with different depth-of-coverage resampling. We used these values to estimate the expected number of Alu insertions in other genomes by adjusting for different read depths and minimum paired-end read support cut-off values.
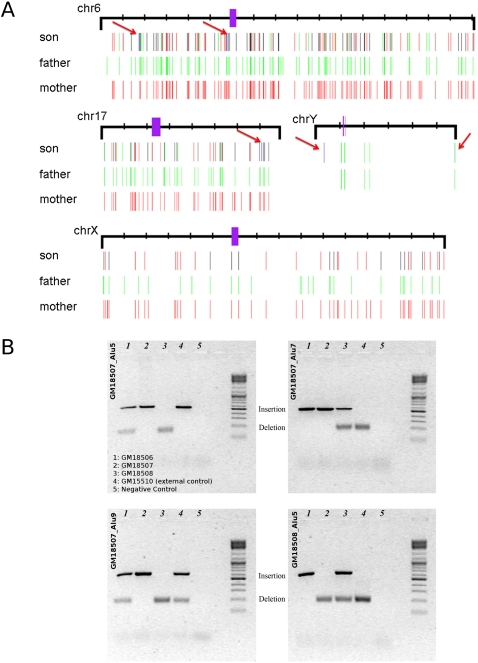
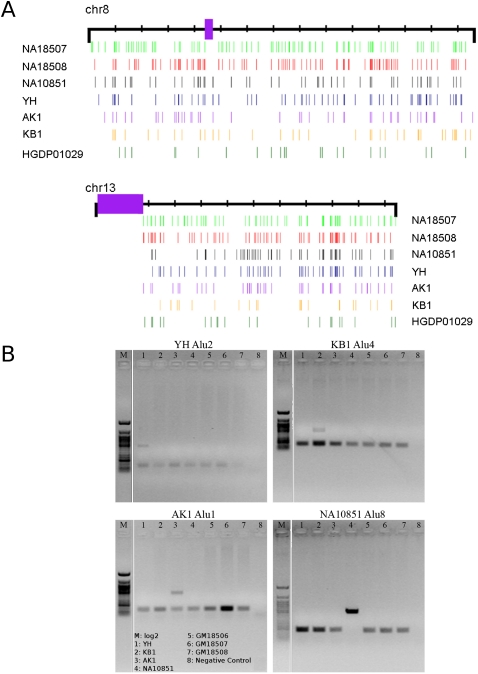
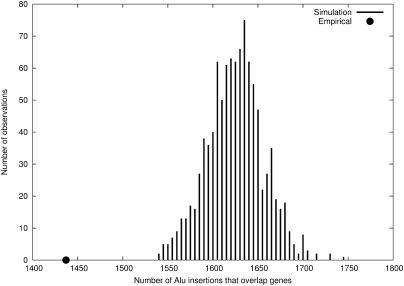
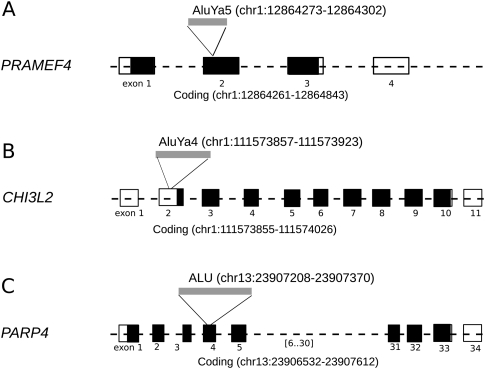
In total, we predicted 2451 novel Alu insertions not present in the human reference genome for the YRI trio sequence data (Supplemental Fig. S1) and a total of 4342 Alu insertions in the entire set (Supplemental Fig. S2; Supplemental Table S1). The chromosomal distribution patterns are shown in the context of parent–child trio (Fig. 1) and for individual genomes (Fig. 2). We find that only 13.2% (571/4342) of these loci have been previously reported in the database of retrotransposon insertion polymorphism (dbRIP) (Wang et al. 2006). If we include two additional recently published surveys (Iskow et al. 2010; Witherspoon et al. 2010), we find that 79.0% (3432/4342) of our calls are novel. Of the Alu integration sites, 33.1% (1437/4342) mapped within genes as opposed to the expected 37.3% of the genome based on the most current (RefSeq) gene definition (downloaded from University of California, Santa Cruz [UCSC] Genome Browser on May 20, 2010). This represents a significant (P < 0.001) depletion based on simulation, confirming potential selection and preferential integration within gene-poor regions of the human genome (Fig. 3). We identified 31 Alu elements that retrotransposed within an exon, of which three are predicted to disrupt a coding sequence (Fig. 4; Supplemental Tables S2, S3).
Figure 1.
Alu insertions predicted in the Yoruban parent–child trio. (A) Novel Alu integration sites for four chromosomes are shown. Alu sequences transmitted from the father (green) are compared with those transmitted from the mother (red). Purple bars represent centromeres and black bars denote Alu insertions shared by both parents and transmitted to the offspring. In these chromosomes, five de novo insertions were predicted in the child (blue), and further marked with a red arrow. Note that the predicted de novo Alu insertion in distal location in chromosome Y is very close to a transmitted integration, and it is difficult to see at this resolution. (B) PCR validation results for three individuals for four different loci (GM18507_Alu5, GM18507_Alu7, GM18507_Alu9 and GM18508_Alu5).
Figure 2.
Chromosomal distribution of Alu insertion polymorphisms. (A) Alu integration sites are depicted for chromosomes 8 and 13 in the genomes of NA18507, NA18508, NA10851, YH, AK1, KB1, and HGDP01029. Purple bars represent the centromeres. (B) PCR genotyping assays are shown for four different loci (YH Alu2, KB Alu4, AK1 Alu1, and NA10851 Alu8) in the genomes of seven individuals.
Figure 3.
Gene overlap analysis. 1437/4342 (33.1%) of predicted Alu insertions map within a human gene as defined by RefSeq (black dot). The histogram shows the expected distribution of gene overlap based on 1000 permutations.
Figure 4.
Gene disruptions. The locations of three novel insertions within the coding exons of PRAMEF4 (chr1:12,864,273–12,864,302), CHI3L2 (chr1:111,573,857–111,573,923), and PARP4 (chr13:23,907,208–23,807,370) are shown. Unfilled black rectangles represent the exons (and parts of exons) in the untranslated region (UTR), where filled rectangles show protein-coding exons. (A,C) The two predicted Alu insertions mapped within a coding region; (B) an example of one Alu insertion in the UTR.
We experimentally validated a set of Alu insertion predictions from seven of the eight genomes using PCR. We selected 29 sites from the YRI trio, where integrations had occurred in relatively unique genomic regions, facilitating PCR primer design. All 29 sites and the transmission genotypes within the trio were validated by PCR (Table 2; Fig. 1B). We then tested rare Alu insertions that were predicted to be specific to an individual targeting the genomes of NA10851, AK1, KB1, and YH. We performed PCR on 10 selected sites from each of these four genomes. We removed five of the 40 PCR assays from consideration due to amplification failure, and only 25 of the remaining 35 sites confirmed the predicted Alu insertion event in the original target genome. We re-examined the 10 sites that did not initially validate by designing a second PCR assay. For the second assay, we selected oligonucleotides that map further from the predicted integration site and validated nine out of 10 of these sites (Table 2; Fig. 2B). Our combined results suggest excellent sensitivity (63/64) but also suggest caution in interpreting the map location precision based strictly on in silico mapping (detailed results of the PCR experiments can be seen in Supplemental Tables S4, S5).
Table 2.
PCR validation results
False negatives are calculated as the number of loci that were predicted to be specific to another individual, yet PCR showed Alu insertion in the specified genome.
Since the novel Alu insertions we detected could, in principle, represent Alu deletions from the reference genome as opposed to newly retrotransposed events, we attempted to assign each Alu insertion to a particular subfamily based on the presence of diagnostic sequence variants. If the events detected were predominantly new retrotranspositions, we would predict that the AluY subfamily would predominate—the only known active Alu subfamily (Batzer et al. 1995). To perform this classification, we compared Alu-anchored sequence reads at each site to consensus sequences corresponding to each of the 31 defined Alu subfamilies (Repbase) (Jurka et al. 2005) and used the minimum genetic distance to assign the Alu to a particular subfamily. In some cases where we could not distinguish between two subfamilies (i.e., they were equally divergent with respect to a consensus), both were reported (e.g., an insertion reported as AluYa5/AluYa8 indicates that we were not able to distinguish between these two subfamilies for that particular insertion). In addition, we were not able to confidently assign 106 Alu insertions to subfamilies, and we report such insertions as ALU (Supplemental Table S1).
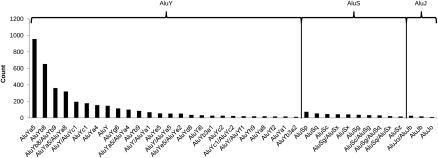
Out of the 4236 Alu insertions that we could classify, 3785 (89.4%) belonged to the AluY subfamily with the two most active members (Ya5 and Yb8), ranked at the top. We classified 397 Alu insertions as AluS (9.4%) and 54 as AluJ (1.3%). These may represent potential deletions in the reference genome or integrations that arose by endonuclease-independent pathways as opposed to new retrotransposition events driven by target-site primed reverse transcription (see Fig. 5 for the distribution of different Alu insertion subfamilies).
Figure 5.
Alu frequency distribution among subfamilies. We show the number of predicted Alu integrations in the eight genomes separated by the inferred Alu subfamilies. As expected, AluY class had the highest frequency, where AluJ was the rarest. The Alu classes (AluY, AluS, AluJ) are sorted from youngest to the oldest.
Familial transmission and genotyping
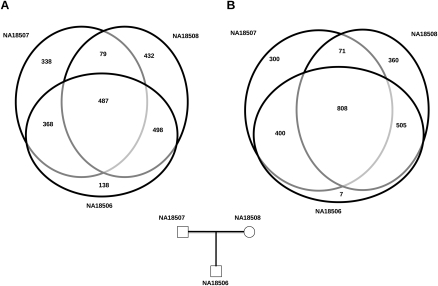
We focused on the parent–child trio (NA18506, NA18507, and NA18058) to assess the transmission characteristics of the novel Alu insertions. We performed two sets of experiments. First, we treated each genome individually and then compared the genomes for unique and shared Alu retrotransposons. We found no significant difference between nontransmitted and transmitted Alu elements from either parent, although slightly more transmissions were predicted from the mother due to increased sequence coverage and X chromosome transmissions from the mother to the proband (NA18506) (Fig. 6A). In the second experiment, we pooled all sequence data from the trio providing ∼50-fold sequence coverage for each haplotype (Table 1). As expected, the analysis led to an increased sensitivity for transmitted Alu insertions, significantly reducing the number of potential de novo candidates. In this analysis, we identified only seven (0.4%) potential de novo insertions out of 1720 total insertions predicted in the proband (Fig. 6B).
Figure 6.
Improved specificity in detecting de novo insertions. A three-way comparison of novel Alu insertion polymorphisms in the YRI trio: when they are predicted separately (A), and when the reads from three individuals are pooled together (B). Pooled coverage reduces the number of false-positive de novo events for further consideration.
We attempted to validate the seven potential de novo insertions, but this proved difficult due to the repetitive nature of sequence flanking the insertion. Despite multiple attempts, we could not design a successful assay for two of the seven predicted events (Supplemental Table S6, gray rows). We tested the remaining five sites using PCR; two mapped to relatively unique sequence, and in both cases the insertions were not only validated in the child but also in one of the parents, and thus were not true de novo events. For the remaining three putative Alu insertions, which were embedded within repetitive DNA, we developed two independent PCR assays: one where primers were selected in unique regions to create a larger PCR amplicon (for predictions in chromosomes 17 and Y) and the second with one oligonucleotide mapping within the predicted Alu integrant (chromosome 1; Supplemental Table S6) and the other oligonucleotide mapping within repetitive flanking DNA. We applied both assay designs to test the insertions in chromosomes 17 and Y, while the second was applicable only to the Alu insertion prediction on chromosome 1. For the chromosome 17 insertion, both the father (NA18507) and child (NA18506) showed the presence of the Alu insertion, while for the prediction in chromosome 1 all three (NA18507, NA18508, and NA18506) showed the presence of an Alu insertion. The PCR assay for the Y chromosome insertion generated multiple amplification bands due to the presence of both common repeats and duplicated sequence, so we could not draw any conclusions for this locus. In summary, of the seven initial de novo predictions, four were confirmed as Alu insertions in the child, but found to be transmitted from one of the parents, and the remaining three could not be tested or interpreted.
We have also studied the parent–child trio for homozygous versus heterozygous insertions. Based on our analysis of the parent–child trio, we categorized all NA18506 Alu insertions as homozygous or heterozygous. To extract this information we developed a simple classifier for genotyping Alu insertions that considers two features: (1) the number of concordant paired-end mappings that span the loci of the predicted insertion (y-axis), and (2) the number of discordant paired-end reads that support an Alu insertion (x-axis). Our analysis shows that heterozygous and homozygous genotypes are accurately classified using this simple classifier (see Methods). We experimentally tested the genotyping results of 29 previously validated Alu insertions in the YRI trio using PCR, where 28 of the 29 insertion polymorphisms were correctly genotyped (Supplemental Fig. S3). The only locus incorrectly genotyped in NA18506 (chr13: 78,169,592–78,169,605) was also the only locus incorrectly genotyped in the NA18508 and NA18507 genomes (Supplemental Fig. S3). One possible explanation may be that the region is enriched for long terminal repeat (LTR) elements and long interspersed nuclear elements (LINEs) in the flanking region, confounding detection and validation.
Genome comparisons and population stratification
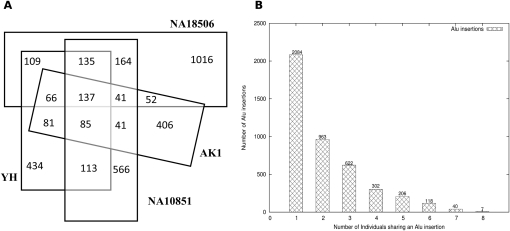
We compared the extent of shared Alu insertion polymorphisms among the analyzed genomes in this study (Fig. 7). Based on our limited sample size of eight genomes, we found that ∼50% of these novel Alu insertions were observed in two or more individuals, suggesting an allele frequency >10% (Fig. 7B). Due to the nonuniformity in sequence coverage, this is likely an underestimate as a result of false negatives. Therefore, we repeated this analysis, limiting it to four unrelated genomes, each representative of a different human population, namely YH (Han Chinese), NA18506 (YRI), AK1 (Korean), and NA10851 (CEU). Of the Alu insertions, 4% (137/3446) were shared among all four genomes but were not present in the reference genome (NCBI Build 36). Considering the diversity of the sampled genomes, we conclude that these 137 loci are common to most humans, and the reference genome likely represents a rare polymorphism (Fig. 7A). We have also reported the number of shared Alu insertions among pairwise comparisons of the eight genomes (Supplemental Table S7). Note that although we find less-common Alu insertions between AK1 and YH than we find between YH and NA10851, we believe this is only an artefact of lower sequence coverage in the AK1 genome compared with the other two genomes. As expected, the YRI genome shows greater genetic diversity. Approximately 59% (1016/1720) of the Alu insertions predicted in NA18506 are unique when compared with the other genomes, where the proportions of unique Alu integration loci in other genomes range between 37% and 45%. We identify 10%–15% more Alu integrations in the YRI samples, even after controlling for differences in sequence coverage (Table 1). In addition, fewer YRI insertions were previously reported in dbRIP (∼16% [388/2451] of YRI insertions vs. ∼20% [488/2430] of non-African insertions). When we also compare with other recently published sets of novel Alu insertions (Iskow et al. 2010; Witherspoon et al. 2010) in addition to dbRIP, we find ∼24% (589/2451) of YRI insertions and ∼31% (744/2430) of non-African insertions were previously reported.
Figure 7.
Shared Alu polymorphisms. (A) A Venn diagram of shared novel Alu insertions among four genomes. The African (NA18507) genome shows the greatest number of individual-specific Alu integration polymorphisms when compared with the Asian (AK1 and YH) and European (NA10851) genomes. This effect holds even after correcting for differences in genome coverage. (B) The histogram shows the number of Alu insertions that are unique and shared among two or more genomes.
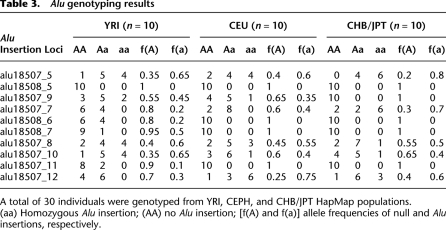
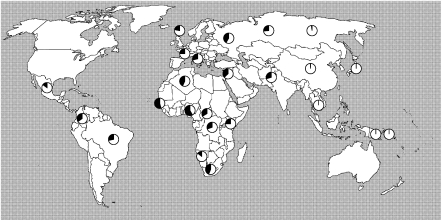
To assess the allele frequency distribution of the YRI Alu insertions, we selected 10 of the original 29 validated sites for which we had PCR genotyping assays and examined their allele frequency distribution more broadly among a panel of 30 individuals (10 Europeans, 10 Asians, and 10 Africans). These insertions showed considerable allele frequency variation among the three populations but, as expected due to their discovery in YRI individuals, showed higher allele frequency among African samples (Table 3; Supplemental Table S8). Three sites (alu18507_9, alu18508_6, and alu18507_11) showed the greatest enrichment among the YRI and were further tested on a larger set of human DNA samples. We genotyped 1058 individuals from 52 populations included in the Human Genome Diversity Panel (HGDP) (Supplemental Table S9). Two loci (alu18507_11; Supplemental Fig. S4A and alu18508_6; Supplemental Fig. S4B) were largely specific to sub-Saharan populations, with alu18508_6 being relatively specific to individuals of Western and Southern African descent (22%–25% allele frequency among the Bantu, Biaka, and Yoruba). In contrast, analysis of alu18507_9 showed a wider and somewhat unusual population distribution outside of Africa (Fig. 8). This allele is common among African populations (average allele frequency 37%), becoming the major allele among the Yorubans from Nigeria and Mandenka from Senegal (54% and 58% allele frequencies). However, it is almost nonexistent among Asian populations (0.03% allele frequency), but it is common in both European and Amerindian populations (37% allele frequency). The Sardinians, Mayans, and Adygei of the Russian Caucasus show the highest non-African allele frequencies of 42%, 44%, and 48%, respectively. Based on the worldwide distribution, we conclude that this insertion is ancient, predating human migrations, but has been essentially eliminated from eastern Asian populations, possibly as a result of founder effect and genetic drift.
Table 3.
Alu genotyping results
A total of 30 individuals were genotyped from YRI, CEPH, and CHB/JPT HapMap populations.
(aa) Homozygous Alu insertion; (AA) no Alu insertion; [f(A) and f(a)] allele frequencies of null and Alu insertions, respectively.
Figure 8.
Global genome-wide distribution of alu18507_9 polymorphisms. Allele frequency as determined by PCR of 1054 samples from 52 HGDP populations. Insertion polymorphism frequency (black portion of the pie chart) for alu18507_9 is depicted.
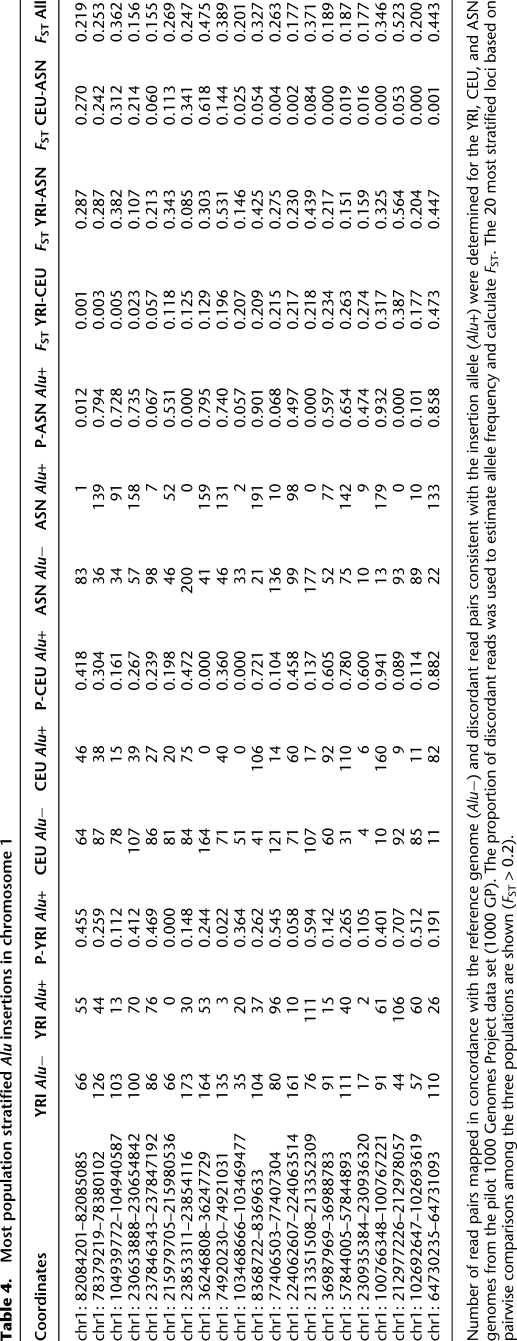
We estimated the allele frequency and extent of stratification among a subset of the newly discovered Alu integrations by examining sequence data from the 1000 Genomes Project Pilot 1 (1000 Genomes Project Consortium 2010) (1000GP 2010) (n = 179 individuals). We only used those genomes sequenced with paired-end Illumina technology; thus, we computationally genotyped a total of 129 human genomes. We selected from 201 Alu insertions mapping to unambiguous locations on chromosome 1 based on our analysis of the initial eight genomes in this study. Next, we assayed these 201 loci within the 1000 Genomes Project Consortium (2010) (1000GP) sequence data by measuring the proportion of discordant (supportive of insertion) and concordant (supportive of null event) read data for each Alu integration locus as a surrogate for allele frequency. For this experiment, we pooled all paired-end genomic sequence data within each 1000GP population (43 YRI, 36 CEU, and 50 Asian [ASN] genomes) and mapped reads to regions flanking the predicted insertion breakpoint. Paired-end sequence reads with one end mapping to an Alu consensus sequence and another mapping to the flanking sequence delineated the Alu insertion allele, while concordant paired-end sequences spanning the integration site and consistent with the reference genome defined the null allele. From these data, we estimated the median allele frequency for these Alu loci at 45%, suggesting that these insertions are common in the general population (Supplemental Table S10). We predict that 10.4% (21/201) of the insertion polymorphisms on chromosome 1 are significantly stratified (FST > 0.2), with the majority (18/21) showing increased allele frequency in the YRI when compared with either the ASN or CEU populations (Table 4).
Table 4.
Most population stratified Alu insertions in chromosome 1
Number of read pairs mapped in concordance with the reference genome (Alu−) and discordant read pairs consistent with the insertion allele (Alu+) were determined for the YRI, CEU, and ASN genomes from the pilot 1000 Genomes Project data set (1000 GP). The proportion of discordant reads was used to estimate allele frequency and calculate FST. The 20 most stratified loci based on pairwise comparisons among the three populations are shown (FST > 0.2).
Discussion
The methods we developed provide a sensitive and systematic approach to discover and genotype Alu retrotransposon genetic variation in the human species using next-generation paired-end sequencing data. We have identified 4342 novel Alu insertions, of which 79% are novel when compared with dbRIP (Wang et al. 2006), and other recent discovery efforts (Iskow et al. 2010; Witherspoon et al. 2010). Of the new insertions, 89% belong to the active AluY subfamily, suggesting that the majority arose as a result of retrotransposition as opposed to deletion or other template-directed repair processes (Batzer et al. 1995). Our analysis of eight genomes of diverse ethnicity has essentially doubled the number of Alu polymorphisms currently within dbRIP, providing a rich resource for future characterization.
Many aspects of the population genetics of Alu insertion polymorphism are reminiscent of single nucleotide polymorphisms (SNPs). We observe greater diversity among Africans when compared with non-Africans with 10%–15% more new insertions being predicted among the former. Concomitantly, a slightly larger fraction of African Alu insertions are novel. While distributed throughout the genome, Alu integrations are significantly depleted within the exons and introns of genes (P < 0.001), suggesting purifying selection and/or integration bias. Alu insertions have been shown to play an important role in creating disease alleles (Deininger and Batzer 1999). Construction of a catalog of Alu repeat insertions of various allele frequencies among “unaffected” individuals is an important first step in the future discovery of pathogenic variants among patient genomes.
Our analysis of a parent–child trio shows that de novo Alu insertion events are rare and exceedingly difficult to detect and confirm. Even with high-sequence coverage, we failed to find any validated de novo Alu insertions; all of the candidates represented false negatives transmitted from one of the two parents. A much larger number of trio genomes will need to be assayed before an accurate estimate of the germ-line mutation rate for Alu retrotransposition can be claimed.
The reduced level of overlap between the Han and Korean sample is influenced by differences in sequence coverage and data quality as opposed to genetic relatedness. For example, the total number of Alu insertions predicted for the European is significantly greater than the Korean (1282 vs. 909). Similarly, both the quality and physical coverage of the Korean sample was significantly less (see Table 1, 160× physical coverage for CEU NA10851 vs. 49× coverage for Korean AK1).
Finally, we present a rapid method for the discovery of population-differentiated Alu insertion polymorphisms. We estimate that ∼10% of the Alu insertions we report are stratified (FST > 0.2) between human populations. This is similar to what has been observed for SNPs discovered in the same samples (1000GP 2010). The discovery of ancestry informative Alu insertion polymorphisms, however, offers several advantages over traditional microsatellite and SNP markers for exploring population history. Alu insertions are by-and-large considered to be stable markers, unlikely to revert through precise deletion and, therefore, are homoplasy-free character states (Batzer et al. 1995). As a result, the Alu insertion represents the derived allele, and all individuals carrying a particular insertion share identity by descent (IBD) for that locus. Genetic typing of ∼100 Alu polymorphisms has proven useful for the unambiguous determination of the continental origin of DNA samples stripped of information (Bamshad et al. 2003). The discovery of modest numbers of geographic-restricted Alu polymorphisms will facilitate further genetic analysis, such as subgroup affiliation within population groups, and have immediate application to forensics (Ray et al. 2005). Thousands of such markers that can be easily tested by PCR should be available in the very near future, as human genomes become routinely sequenced.
Methods
We predicted the Alu insertion polymorphisms using VariationHunter (Hormozdiari et al. 2010). VariationHunter discovers the mobile element insertions based on a maximum parsimony structural variation discovery algorithm (Hormozdiari et al. 2009). In the first step, the algorithm clusters the discordant paired-end reads that support the insertion of an Alu element. Next, VariationHunter selects the minimum number of such clusters (mobile element insertions) that cover all paired-end reads (Hormozdiari et al. 2010). For the YRI trio, we first pooled all discordant reads and then applied the VariationHunter algorithm on the combined set of read mappings. This pooling strategy takes advantage of a priori information that the variation between individuals within a trio should be limited.
Genotyping classifier
We use a simple linear separator classifier based on two features to genotype the Alu insertions predicted in the donor genome. The first feature is the total number of discordant paired-end reads that support the Alu insertion, and the second feature is the total number of concordant paired-end read mappings that span the insertion locus (if the concordant paired-end read has multiple mappings, a mapping location with the least edit distance is considered). Note, if we assume no paired-end read is mapped incorrectly, we expect that for a heterozygous Alu insertion the total number of paired-end reads spanning the insertion locus will be almost half of the total paired-end reads that support the Alu insertion. On the other hand, if we assume the insertion is homozygous, we then expect that the total number of concordant paired-end mappings that span the locus to be almost zero. We use a two-dimensional space to represent these insertions, where the x-axis is the number of discordant paired-end reads supporting the Alu insertion and the y-axis is the number of concordant paired-end reads that span the locus. In this two-dimensional space, the heterozygous insertions should fall close to the line y = 1/2x and the homozygous insertions should be close to y = 0. Thus, we can easily classify insertions based on their distance to these two lines. This is equivalent to using the line y = 1/4x as the separator between these two classes.
PCR
We designed PCR primers ∼75 bp proximal and distal to the predicted Alu insertion breakpoint. In this way, if there are no Alu insertions at the tested site, we expected to see an amplification product of roughly 150 bp. In the case where we observed a ∼450-bp fragment (150 bp + 300 bp for the Alu element), we considered the prediction as validated. We only tested the loci that were not spanned by other repetitive elements and did not intersect with segmental duplications to facilitate reliable primer design (Supplemental Tables S4 and S5).
Acknowledgments
We thank Farhad Hormozdiari for improvements in the mrFAST aligner and T. Brown for manuscript preparation assistance. This work was supported, in part, by Natural Sciences and Engineering Research Council of Canada (NSERC), Genome BC grants to S.C.S., NIH grants HG004120 and HG005209 to E.E.E., and NSERC Alexander Graham Bell Canada Graduate Scholarships (CSG-D) to F.H. and I.H. E.E.E. is an Investigator of the Howard Hughes Medical Institute and is on the scientific advisory board for Pacific Biosciences.
Footnotes
Article published online before print. Article, supplemental material, and publication date are at http://www.genome.org/cgi/doi/10.1101/gr.115956.110.
[Supplemental material is available for this article.]
References
- The 1000 Genomes Project Consortium 2010. A map of human genome variation from population-scale sequencing. Nature 467: 1061–1073 [DOI] [PMC free article] [PubMed] [Google Scholar]
- Alkan C, Kidd JM, Marques-Bonet T, Aksay G, Antonacci F, Hormozdiari F, Kitzman JO, Baker C, Malig M, Mutlu O, et al. 2009. Personalized copy number and segmental duplication maps using next-generation sequencing. Nat Genet 41: 1061–1067 [DOI] [PMC free article] [PubMed] [Google Scholar]
- Bailey JA, Giu L, Eichler EE 2003. An Alu transposition model for the origin and expansion of human segmental duplications. Am J Hum Genet 73: 823–834 [DOI] [PMC free article] [PubMed] [Google Scholar]
- Bamshad MJ, Wooding S, Watkins WS, Ostler CT, Batzer MA, Jorde LB 2003. Human population genetic structure and inference of group membership. Am J Hum Genet 72: 578–589 [DOI] [PMC free article] [PubMed] [Google Scholar]
- Batzer MA, Deininger PL 2002. Alu repeats and human genomic diversity. Natl Rev 3: 370–379 [DOI] [PubMed] [Google Scholar]
- Batzer MA, Rubin CM, Hellmann-Blumberg U, Alegria-Hartman M, Leeflang EP, Stern JD, Bazan HA, Shaikh TH, Deininger PL, Schmid CW 1995. Dispersion and insertion polymorphism in two small subfamilies of recently amplified human Alu repeats. J Mol Biol 247: 418–427 [DOI] [PubMed] [Google Scholar]
- Beck CR, Collier P, Macfarlane C, Malig M, Kidd JM, Eichler EE, Badge RM, Moran JV 2010. LINE-1 retrotransposition activity in human genomes. Cell 141: 1159–1170 [DOI] [PMC free article] [PubMed] [Google Scholar]
- Bentley DR, Balasubramanian S, Swerdlow HP, Smith GP, Milton J, Brown CG, Hall KP, Evers DJ, Barnes CL, Bignell HR, et al. 2008. Accurate whole human genome sequencing using reversible terminator chemistry. Nature 456: 53–59 [DOI] [PMC free article] [PubMed] [Google Scholar]
- Carroll ML, Roy-Engel AM, Nguyen SV, Salem AH, Vogel E, Vincent B, Myers J, Ahmad Z, Nguyen L, Sammarco M, et al. 2001. Large-scale analysis of the Alu Ya5 and Yb8 subfamilies and their contribution to human genomic diversity. J Mol Biol 311: 17–40 [DOI] [PubMed] [Google Scholar]
- Cordaux R, Srikanta D, Lee J, Stoneking M, Batzer MA 2007. In search of polymorphic Alu insertions with restricted geographic distributions. Genomics 90: 154–158 [DOI] [PMC free article] [PubMed] [Google Scholar]
- Deininger PL, Batzer MA 1999. Alu repeats and human disease. Mol Genet Metab 67: 183–193 [DOI] [PubMed] [Google Scholar]
- Deininger PL, Jolly DJ, Rubin CM, Friedmann T, Schmid CW 1981. Base sequence studies of 300 nucleotide renatured repeated human DNA clones. J Mol Biol 151: 17–33 [DOI] [PubMed] [Google Scholar]
- Ewing AD, Kazazian HH Jr 2010. High-throughput sequencing reveals extensive variation in human-specific L1 content in individual human genomes. Genome Res 20: 1262–1270 [DOI] [PMC free article] [PubMed] [Google Scholar]
- Green RE, Krause J, Briggs AW, Maricic T, Stenzel U, Kircher M, Patterson N, Li H, Zhai W, Fritz MH et al. 2010. A draft sequence of the Neandertal genome. Science 328: 710–722 [DOI] [PMC free article] [PubMed] [Google Scholar]
- Hach F, Hormozdiari F, Alkan C, Hormozdiari F, Birol I, Eichler EE, Sahinalp SC 2010. mrsFAST: A cache-oblivious algorithm for short-read mapping. Nat Methods 7: 576–577 [DOI] [PMC free article] [PubMed] [Google Scholar]
- Hormozdiari F, Alkan C, Eichler EE, Sahinalp SC 2009. Combinatorial algorithms for structural variation detection in high-throughput sequenced genomes. Genome Res 19: 1270–1278 [DOI] [PMC free article] [PubMed] [Google Scholar]
- Hormozdiari F, Hajirasouliha I, Dao P, Hach F, Yorukoglu D, Alkan C, Eichler EE, Sahinalp SC 2010. Next-generation VariationHunter: Combinatorial algorithms for transposon insertion discovery. Bioinformatics 26: i350–i357 [DOI] [PMC free article] [PubMed] [Google Scholar]
- Houck CM, Rinehart FP, Schmid CW 1979. A ubiquitous family of repeated DNA sequences in the human genome. J Mol Biol 132: 289–306 [DOI] [PubMed] [Google Scholar]
- Huang CR, Schneider AM, Lu Y, Niranjan T, Shen P, Robinson MA, Steranka JP, Valle D, Civin CI, Wang T, et al. 2010. Mobile interspersed repeats are major structural variants in the human genome. Cell 141: 1171–1182 [DOI] [PMC free article] [PubMed] [Google Scholar]
- International Human Genome Sequencing Consortium 2001. Initial sequencing and analysis of the human genome. Nature 409: 860–921 [DOI] [PubMed] [Google Scholar]
- International Human Genome Sequencing Consortium 2004. Finishing the euchromatic sequence of the human genome. Nature 431: 931–945 [DOI] [PubMed] [Google Scholar]
- Iskow RC, McCabe MT, Mills RE, Torene S, Pittard WS, Neuwald AF, Van Meir EG, Vertino PM, Devine SE 2010. Natural mutagenesis of human genomes by endogenous retrotransposons. Cell 141: 1253–1261 [DOI] [PMC free article] [PubMed] [Google Scholar]
- Jurka J, Kohany O, Pavlicek A, Kapitonov VV, Jurka MV 2004. Duplication, coclustering, and selection of human Alu retrotransposons. Proc Natl Acad Sci 101: 1268–1272 [DOI] [PMC free article] [PubMed] [Google Scholar]
- Jurka J, Kapitonov VV, Pavlicek A, Klonowski P, Kohany O, Walichiewicz J 2005. Repbase Update, a database of eukaryotic repetitive elements. Cytogenet Genome Res 110: 462–467 [DOI] [PubMed] [Google Scholar]
- Kidd JM, Cooper GM, Donahue WF, Hayden HS, Sampas N, Graves T, Hansen N, Teague B, Alkan C, Antonacci F, et al. 2008. Mapping and sequencing of structural variation from eight human genomes. Nature 453: 56–64 [DOI] [PMC free article] [PubMed] [Google Scholar]
- Kidd JM, Graves T, Newman TL, Fulton R, Hayden HS, Malig M, Kallicki J, Kaul R, Wilson RK, Eichler EE 2010. A human genome structural variation sequencing resource reveals insights into mutational mechanisms. Cell 143: 837–847 [DOI] [PMC free article] [PubMed] [Google Scholar]
- Kim JI, Ju YS, Park H, Kim S, Lee S, Yi JH, Mudge J, Miller NA, Hong D, Bell CJ, et al. 2009. A highly annotated whole-genome sequence of a Korean individual. Nature 460: 1011–1015 [DOI] [PMC free article] [PubMed] [Google Scholar]
- Levy S, Sutton G, Ng PC, Feuk L, Halpern AL, Walenz BP, Axelrod N, Huang J, Kirkness EF, Denisov G, et al. 2007. The diploid genome sequence of an individual human. PLoS Biol 5: e254 doi: 10.1371/journal.pbio.0050254 [DOI] [PMC free article] [PubMed] [Google Scholar]
- Liu GE, Alkan C, Jiang L, Zhao S, Eichler EE 2009. Comparative analysis of Alu repeats in primate genomes. Genome Res 19: 876–885 [DOI] [PMC free article] [PubMed] [Google Scholar]
- Marques-Bonet T, Kidd JM, Ventura M, Graves TA, Cheng Z, Hillier LW, Jiang Z, Baker C, Malfavon-Borja R, Fulton LA, et al. 2009. A burst of segmental duplications in the genome of the African great ape ancestor. Nature 457: 877–881 [DOI] [PMC free article] [PubMed] [Google Scholar]
- McKernan KJ, Peckham HE, Costa GL, McLaughlin SF, Fu Y, Tsung EF, Clouser CR, Duncan C, Ichikawa JK, Lee CC, et al. 2009. Sequence and structural variation in a human genome uncovered by short-read, massively parallel ligation sequencing using two-base encoding. Genome Res 19: 1527–1541 [DOI] [PMC free article] [PubMed] [Google Scholar]
- Mills RE, Bennett EA, Iskow RC, Devine SE 2007. Which transposable elements are active in the human genome? Trends Genet 23: 183–191 [DOI] [PubMed] [Google Scholar]
- Park H, Kim JI, Ju YS, Gokcumen O, Mills RE, Kim S, Lee S, Suh D, Hong D, Kang HP, et al. 2010. Discovery of common Asian copy number variants using integrated high-resolution array CGH and massively parallel DNA sequencing. Nat Genet 42: 400–405 [DOI] [PMC free article] [PubMed] [Google Scholar]
- Price AL, Eskin E, Pevzner PA 2004. Whole-genome analysis of Alu repeat elements reveals complex evolutionary history. Genome Res 14: 2245–2252 [DOI] [PMC free article] [PubMed] [Google Scholar]
- Ray DA, Walker JA, Hall A, Llewellyn B, Ballantyne J, Christian AT, Turteltaub K, Batzer MA 2005. Inference of human geographic origins using Alu insertion polymorphisms. Forensic Sci Int 153: 117–124 [DOI] [PubMed] [Google Scholar]
- Salem AH, Kilroy GE, Watkins WS, Jorde LB, Batzer MA 2003. Recently integrated Alu elements and human genomic diversity. Mol Biol Evol 20: 1349–1361 [DOI] [PubMed] [Google Scholar]
- Schmid CW, Deininger PL 1975. Sequence organization of the human genome. Cell 6: 345–358 [DOI] [PubMed] [Google Scholar]
- Schuster SC, Miller W, Ratan A, Tomsho LP, Giardine B, Kasson LR, Harris RS, Petersen DC, Zhao F, Qi J, et al. 2010. Complete Khoisan and Bantu genomes from southern Africa. Nature 463: 943–947 [DOI] [PMC free article] [PubMed] [Google Scholar]
- Wang J, Song L, Grover D, Azrak S, Batzer MA, Liang P 2006. dbRIP: A highly integrated database of retrotransposon insertion polymorphisms in humans. Hum Mutat 27: 323–329 [DOI] [PMC free article] [PubMed] [Google Scholar]
- Wang J, Wang W, Li R, Li Y, Tian G, Goodman L, Fan W, Zhang J, Li J, Zhang J, et al. 2008. The diploid genome sequence of an Asian individual. Nature 456: 60–65 [DOI] [PMC free article] [PubMed] [Google Scholar]
- Wheeler DA, Srinivasan M, Egholm M, Shen Y, Chen L, McGuire A, He W, Chen YJ, Makhijani V, Roth GT, et al. 2008. The complete genome of an individual by massively parallel DNA sequencing. Nature 452: 872–876 [DOI] [PubMed] [Google Scholar]
- Witherspoon DJ, Xing J, Zhang Y, Watkins WS, Batzer MA, Jorde LB 2010. Mobile element scanning (ME-Scan) by targeted high-throughput sequencing. BMC Genomics 11: 410 doi: 10.1186/1471-2164-11-410 [DOI] [PMC free article] [PubMed] [Google Scholar]
- Xing J, Zhang Y, Han K, Salem AH, Sen SK, Huff CD, Zhou Q, Kirkness EF, Levy S, Batzer MA, et al. 2009. Mobile elements create structural variation: Analysis of a complete human genome. Genome Res 19: 1516–1526 [DOI] [PMC free article] [PubMed] [Google Scholar]


