Abstract
RNA-sequencing (RNA-seq) allows quantitative measurement of expression levels of genes and their transcripts. In this study, we sequenced complementary DNA fragments of cultured human B-cells and obtained 879 million 50-bp reads comprising 44 Gb of sequence. The results allowed us to study the gene expression profile of B-cells and to determine experimental parameters for sequencing-based expression studies. We identified 20,766 genes and 67,453 of their alternatively spliced transcripts. More than 90% of the genes with multiple exons are alternatively spliced; for most genes, one isoform is predominantly expressed. We found that while chromosomes differ in gene density, the percentage of transcribed genes in each chromosome is less variable. In addition, genes involved in related biological processes are expressed at more similar levels than genes with different functions. Besides characterizing gene expression, we also used the data to investigate the effect of sequencing depth on gene expression measurements. While 100 million reads are sufficient to detect most expressed genes and transcripts, about 500 million reads are needed to measure accurately their expression levels. We provide examples in which deep sequencing is needed to determine the relative abundance of genes and their isoforms. With data from 20 individuals and about 40 million sequence reads per sample, we uncovered only 21 alternatively spliced, multi-exon genes that are not in databases; this result suggests that at this sequence coverage, we can detect most of the known genes. Results from this project are available on the UCSC Genome Browser to allow readers to study the expression and structure of genes in human B-cells.
Gene expression is a key determinant of cellular phenotypes. A comprehensive catalog of gene transcripts, their structures, and abundance facilitates a better understanding of how gene expression influences phenotypic manifestations.
Microarrays (Fodor et al. 1993; DeRisi et al. 1996) have been the predominant method for gene expression studies because of their ability to probe thousands of transcripts simultaneously. Although hybridization-based approaches are high throughput, they are subject to biases and limitations such as the reliance on existing gene models and potential for cross-hybridization to probes with similar sequences. Genomic tiling arrays and other approaches such as serial analysis of gene expression (Velculescu et al. 1995) and massively parallel signature sequencing (Brenner et al. 2000) have been developed to overcome some of these limitations.
RNA-sequencing (RNA-seq) is a relatively new method for analyzing gene expression; it provides digital readouts for mapping and quantifying transcriptomes (Bentley et al. 2008; Lister et al. 2008; Mortazavi et al. 2008; Nagalakshmi et al. 2008; Wilhelm et al. 2008). It involves isolating a population of RNA, converting it to a library of cDNA fragments with adaptors attached, and sequencing the cDNA library to obtain short sequences typically 30 to 400 nt in length. The short reads are then mapped to a reference genome or assembled de novo. The expression level for a gene can subsequently be determined by counting the number of reads that aligned to its exons. RNA-seq studies of model organisms (Cloonan et al. 2008; Mortazavi et al. 2008) have revealed unknown aspects of transcriptomes through refinement of transcriptional start sites, discovery of 3′ UTR heterogeneity, and identification of novel upstream open reading frames. Global surveys of alternative splicing show that nearly 95% of all multi-exon genes in humans undergo alternative splicing events (Pan et al. 2008).
Motivated by the ability of RNA-seq technology to study gene expression, we sequenced the transcriptomes of human B-cells that are part of the HapMap and 1000 Genomes Projects. We generated 44 Gb of sequence to address several questions. First, we analyzed the gene expression landscape of human B-cells by identifying expressed transcripts and quantifying their expression levels. Second, we examined how sequencing depth affects the detection and quantification of genes and their isoforms. Lastly, we evaluated the potential of RNA-seq to uncover transcribed fragments that are not in existing gene annotation databases.
Results
Data set
We sequenced the mRNA population of cultured human B-cells from 20 unrelated individuals from the Center d'Etude du Polymorphisme Humain (CEPH) collection (Dausset et al. 1990). From each sample, we obtained 44 ± 8 million 50-bp reads (mean ± standard deviation) (see Methods). For most of our analysis, we pooled the sequences to create an 879-million-read data set comprising 44 Gb of sequence.
We mapped the sequence reads to the reference human genome sequence (NCBI 36.1 [hg18] assembly) using TopHat (Trapnell et al. 2009) and Bowtie (Langmead et al. 2009). Then, we assembled the alignments into gene transcripts and calculated their relative abundances using Cufflinks (Trapnell et al. 2010). We conducted two analyses: First, we provided Cufflinks with Gencode (version 3c NCBI36) (Harrow et al. 2006) gene annotations, and second, we did not use any gene annotations to find unknown gene models. We restricted our first analysis to levels 2 and 3 Gencode genes that are annotated as “protein coding” or “processed transcript”; in this study, we refer to this set of gene models as “Gencode.”
To investigate the effect of sequencing depth on various expression profiling measurements, we created smaller subsets of our pooled data set, analyzing depths of 1 to 9 million reads (in intervals of 1 million reads), 10 to 90 million reads (in intervals of 10 million reads), and 100 to 700 million reads (in intervals of 100 million reads).
Alignment results
In the 879-million-read data set, 80% of the reads aligned to the human genome, of which 84% aligned to unique locations in the genome (Supplemental Table 1). Fourteen percent of the mapped reads aligned to two to five locations in the genome, and <2% aligned to six or more locations. We excluded all reads mapping to six or more locations from our analyses. Although <3% of the human genome is composed of exons, 83% of our uniquely mapped reads overlap Gencode exons. These results confirm that our poly(A)+ RNA samples are highly enriched for exonic sequences. We also studied fractions of the 879-million-read data set and found that the percentage of total reads aligning to the human genome increases proportionally with sequencing depth for input sizes smaller than 200 million reads, after which the value remains constant. With 1 million reads, 75% of the reads aligned to the genome; in contrast, 80% of the reads aligned with 200 million reads (Supplemental Table 1). Lastly, we found that 84% of the aligned reads mapped to unique locations across all sequencing depths.
Expression analysis
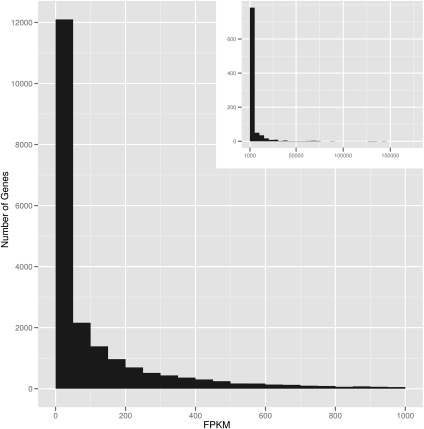
Using all of our sequence reads, we estimated the expression levels of genes in our B-cells. Expression levels are measured in “fragments per kilobase of exon model per million mapped reads” (FPKM) (Trapnell et al. 2010), and the expression level for a gene is the sum of the FPKM values of its isoforms. The distribution of gene expression values is right-skewed (Fig. 1); the median and mean FPKM values are 26 and 338, respectively. Although we do not wish to use an arbitrary FPKM threshold to determine whether a transcript is expressed, analysis of all transcripts with expression levels greater than zero will include FPKM values that are very close to zero (bottom fifth percentile of transcript FPKM values = 0.003). Thus, we set an FPKM value of 0.05 as the lower bound in our subsequent analyses. Using this criterion, we detected 20,776 genes and 67,453 alternatively spliced transcripts in our B-cells. For the majority (75%) of these transcripts, there are sequence reads that cover at least one-quarter of their exons. The expression of these transcripts is supported by RNA polymerase II binding and active chromatin marks such as H3K27ac or H3K4me3 (Supplemental Fig. 1; Rosenbloom et al. 2009).
Figure 1.
Distribution of FPKM values for Gencode genes. The distribution of gene expression values is skewed right; the median and mean FPKM values are 26 and 338, respectively. The main figure shows genes with FPKM values less than 1000. (Inset) Genes with FPKM values greater than 1000. For percentiles of FPKM values for genes and transcripts, see Supplemental Tables 2 and 3.
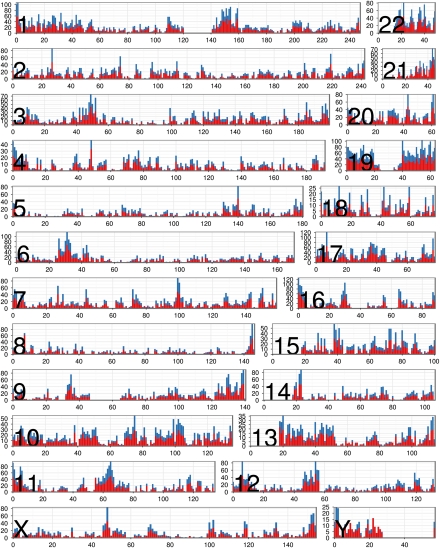
We surveyed the expression landscape across chromosomes by determining the fraction of genes that are expressed within 1-Mb intervals (Fig. 2), the gene density, and percentage of genes transcribed for each chromosome (Supplemental Fig. 2). The average gene density is 10 genes/Mb (standard deviation = 4.8), and the average percentage of genes transcribed for each chromosome is 71% (standard deviation = 12%). We found that while chromosomes varied greatly with respect to gene density, they varied much less in the proportion of genes that are expressed. For example, while chromosome 19 is six times more gene-dense than chromosome 18, 87% and 82% of genes on chromosome 19 and chromosome 18 are expressed.
Figure 2.
Distribution of expressed genes by chromosome. For each chromosome, we plotted the number (y-axis) of Gencode genes residing in 1-Mb intervals along the chromosome (x-axis depicts physical distance in megabases). (Red) The number of genes that are expressed (FPKM ≥0.05); (blue) the number that are not expressed.
We classified genes into groups based on their FPKM values: low expression (bottom 25th percentile; FPKM ≤ 2.3), medium expression (middle 50th percentile; 2.3 < FPKM ≤ 163), and high expression (top 25th percentile; FPKM > 163). Gene Ontology (GO) analysis (Ashburner et al. 2000) revealed that low-expressing genes are enriched for processes relating to cell adhesion (P = 2.9 × 10⁻²⁰) and ion transport (P = 1.1 × 10⁻¹⁵). For medium-expressing genes, genes involved in transcription (P = 2.4 × 10⁻³¹) were found to be over-represented. Lastly, we found high-expressing genes to be enriched in processes such as translation (P = 3.1 × 10−70), RNA processing (2.2 × 10−70), and RNA splicing (5.3 × 10−56). We did not find functional categories that were enriched in all three groups, suggesting that genes within a particular process are expressed at similar levels.
Alternatively spliced transcripts
We assessed the degree of alternative splicing activity in B-cells and found that 94% of multi-exon genes express two or more spliced forms. This number is consistent with the estimate by Burge and colleagues (Wang et al. 2008) that >90% of human genes across diverse tissue types express multiple isoforms. For genes with two or more expressed isoforms, we analyzed the relative abundance of each of the alternatively spliced transcripts. We considered the transcript with the highest FPKM value as the “major” isoform and all other transcripts as “minor” isoforms. For every minor isoform of a gene, we calculated the ratio of its FPKM value to that of the major isoform. We found the distribution of these ratios to be right-skewed with a mean of 0.26 (median = 0.17, standard deviation = 0.26) (Supplemental Fig. 3). These results indicate that while the majority of genes have several alternatively spliced transcripts, these isoforms are not expressed at equivalent levels. For most genes, one isoform is expressed more highly than others.
Comparison with microarrays
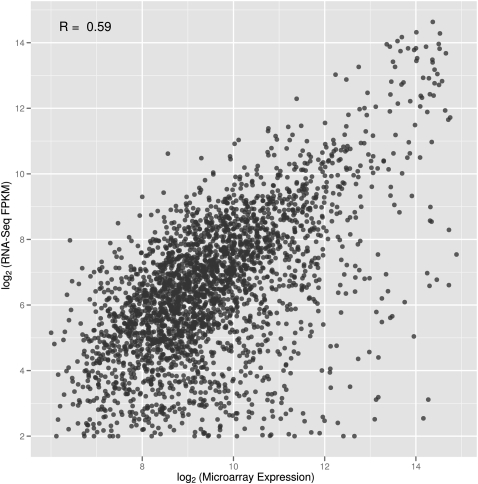
We compared our RNA-seq data to microarray measurements performed on the same 20 unrelated CEPH individuals. The gene expression levels measured by the two methods are similar (R = 0.59) (Fig. 3) and comparable to results by others (R = 0.69 and 0.80 in Mortazavi et al. 2008 and Montgomery et al. 2010, respectively).
Figure 3.
Expression values from RNA-seq and microarray. Comparison of FPKM values (log2-transformed) and microarray signals for the 2597 genes detected by both platforms in 20 unrelated individuals. For each gene, we plotted the average expression values across the 20 individuals.
To investigate whether the digital counts of transcript abundance produced by RNA-seq experiments offer greater dynamic range than the analog-style signals obtained from microarrays, we analyzed the expression levels for 2597 genes for which data were available for each of the 20 individuals. For each gene, we calculated the dynamic range and the coefficient of variation. We found the dynamic range to be greater in RNA-seq than microarray measurements: 1.78 ± 0.67 versus 1.25 ± 0.47 (mean ± standard deviation). Across the 20 individuals, the coefficient of variation values was also greater from RNA-seq data: 0.13 ± 0.09 versus 0.052 ± 0.03 (mean ± standard deviation). For the majority (90%) of the genes, the coefficient of variation is larger in the RNA-seq data set (see examples in Supplemental Fig. 4).
Sequencing depth
In designing an RNA-seq study, a parameter of interest is the sequencing depth needed to address various questions. To assess the relationship between sequencing depth and expression levels, we divided our 879 million 50-bp read data set into smaller sets and analyzed how the detection of a gene and the measurement of its expression level varies with increasing sequencing depth.
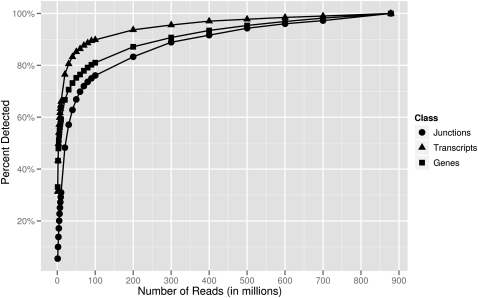
We first assumed that our 879-million-read data set gives a comprehensive catalog of transcribed genes and then assessed how many genes are detected in fractions of those reads. We found that with 100 million reads, 81% of genes (FPKM ≥ 0.05) and 90% of their transcripts were detected (Fig. 4). For each additional 100 million reads, we were able to detect on average 3% more genes and 1% more transcripts. As expected, the expression level of a gene affects how readily it is detected; for example, with 100 million reads, 80% of highly expressed genes (top 25th percentile; FPKM > 163) compared to 32% of the low expression genes (bottom 25th percentile; FPKM ≤ 2.3) were detected.
Figure 4.
Number of junctions, transcripts, and genes detected at different sequencing depths. The numbers of genes, transcripts, and junctions detected in our 879-million-read data set were assumed to be the “final” values. Then, the percentages of these “final” values detected at various sequencing depths were determined. For example, with 100 million reads, 76% of the junctions, 90% of transcripts, and 81% of genes were detected.
The detection of splice junctions is important as they are necessary for isoform assembly and quantification. Of the 269,155 Gencode junctions, 145,100 (54%) are detected in our 879-million-read data set. This result is consistent with those reported by others: Blencowe and colleagues (Pan et al. 2008) detected between 128,395 and 130,854 of known RefSeq junctions in diverse human tissues; Pritchard and colleagues (Pickrell et al. 2010) detected 170,293 junctions supported by spliced ESTs from GenBank in B-cells. With 100 million reads, 76% of the 145,100 junctions were detected, after which on average 4% more junctions were detected for each additional 100 million reads (Fig. 4).
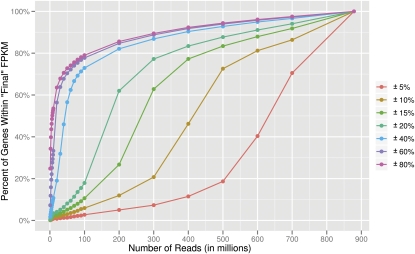
For most studies, information beyond whether a gene is expressed or not is important; accurate expression levels are needed. To study the robustness of expression levels at various input sizes, we first assumed the expression values in our 879-million-read data set to be the “best estimates” and then analyzed the sequencing depth necessary to achieve these “final” levels (Fig. 5). For the majority (72%) of genes with FPKM values greater than 0.05, 500 million reads are needed for their expression values to be within 10% of their final measurements. With 100 million reads, only 6% of genes have values that are within 10% of their “final” FPKM value. Furthermore, while 100 million reads is sufficient for detection of the majority of genes and transcripts, the expression levels of genes obtained at a depth of 100 million reads deviate on average from their final value by 41%. These results suggest that deep sequencing is necessary for accurate determination of the expression level of genes.
Figure 5.
Gene expression levels at different sequencing depths. The percentages of genes that reach values within different percentages of the “final” level obtained at a depth of 879 million reads were determined. With 100 million reads, only 6% of genes have FPKM measurements that are within 10% (gold line) of their “final” value compared to 72% at a depth of 500 million reads.
Next, we investigated the coverage needed to study the relative abundance of alternatively spliced forms of genes. Again, we found that deep sequencing depths are crucial. For example, PHB (Fig. 6A) is a gene with five isoforms: PHB-001 (ENST00000300408), PHB-002 (ENST00000419140), PHB-003 (ENST00000446735), PHB-004 (ENST00000393345), and PHB-201 (ENST00000434917) with FPKM values of 519, 96, 174, 5, and 679, respectively. For the least abundant isoform (PHB-004), with 60 million reads, its expression level was at 20% of the final FPKM. However, for the other four isoforms, 200 to 400 million reads were needed to obtain expression values within 20% of their final FPKM measurements. These results are surprising as one may expect deeper sequencing to allow for better quantification of transcripts that are expressed at lower levels; however, our data suggest that it is the highly expressed isoforms whose expression levels increase with larger sequencing depths. Furthermore, with less than 200 million reads, the 95% confidence intervals reported by Cufflinks for the two most highly expressed isoforms (PHB-001 and PHB-201) overlapped each other; however, with more than 200 million reads, the confidence intervals for the five isoforms no longer overlapped. Another example is CD74, which has three high-expressing variants: CD74-201 (ENST00000009530), CD74-202 (ENST00000353334), and CD74-203 (ENST00000377795) with FPKM values of 4690, 54,745, and 2252, respectively. While the expression level of the least-expressed isoform (CD74-203) was within 10% of its “final” FPKM with 20 million reads, the expression values of the other two isoforms did not reach this level until 400 million reads. Again, we see that the expression values of the highly expressed isoforms continued to increase with higher sequencing depths, whereas that for the isoform with the lowest level of expression was fairly constant.
Figure 6.
Expression levels versus sequencing depth. We plotted FPKM values for genes and their transcripts at various sequencing depths. (A) FPKM values of five spliced forms of PHB are shown; the least abundant isoform (blue line) of PHB reaches within 20% of its “final” FPKM value with only 60 million reads; however, the expression values of the other four isoforms continued to increase with more reads. (B) FPKM values of BRD4 are shown. With less than 100 million reads, the expression level of BRD4-201 (orange line) is overestimated, while that of BRD4-204 (purple line) is underestimated. (Error bars represent 95% confidence intervals.)
Sufficient sequence coverage is not only needed for accurate estimations of expression levels; they are also necessary to determine the relative abundance of isoforms. BRD4 is a gene with four isoforms: BRD4-201 (ENST00000263377), BRD4-202 (ENST00000360016), BRD4-203 (ENST00000371835), and BRD4-204 (ENST00000392878) with FPKM values of 200, 5, 65, and 139, respectively (Fig. 6B). At low sequencing depths, the expression level of BRD4-204 was overestimated, while that of BRD4-201 was underestimated; 60 million reads were needed to show that BRD4-201, not BRD4-204, is the most highly expressed isoform.
As a final example of the effect of sequencing depth on expression values, we studied relative gene expression by using two well-characterized genes—CDKN1A, a cyclin-dependent kinase inhibitor; and its regulator, TP53. The “final” FPKM values for CDKN1A and TP53 were 2400 and 676, respectively; the ratio of the expression values (CDKN1A/TP53) was 3.6. With less than 100 million reads, the ratio of the expression levels of the two genes ranged from 2.9 to 15; this ratio fluctuated by as much as 300% at read depths of less than 100 million. However, with more than 100 million reads, the expression ratio ranged from 3.6 to 3.7, and the largest deviation from the ratio obtained was 4%. Thus, deep sequencing is necessary to ensure the accurate quantification of relative gene expression.
Discovery of novel transcripts
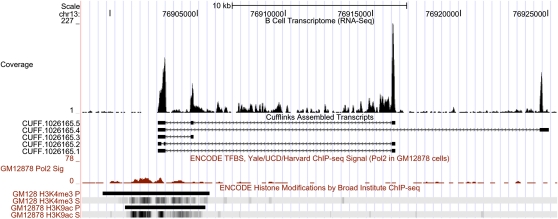
A feature of RNA-seq is its ability to detect unknown transcripts. To address this, we used Cufflinks without known gene models to annotate transcribed fragments and identified 230,006 genes. The majority (77%) of these have already been identified by gene annotation groups such as Aceview, CCDS, Gencode, Mammalian Gene Collection, RefSeq, UCSC, and Vega. Of the remaining 53,939 transcribed fragments, 6892 (13%) overlap RNA polymerase II binding sites (Rosenbloom et al. 2009). After filtering out known genes and fragments that overlap repetitive genomic regions (Self Chain and RepeatMasker tracks on the UCSC Genome Browser), we have 801 “unknown” genes. These genes have relative high expression (mean FPKM = 95), but they are quite short; the average length of these “unknown” genes is 0.9 kb compared to 1.8 kb for known genes. Furthermore, only 21 of these novel genes have alternatively spliced transcripts; we show as example a multi-isoform gene on chromosome 13:76902733–76925064 that has five alternatively spliced transcripts and an FPKM value of 1400 (Fig. 7). Support for the validity of this “unknown” gene includes an upstream 5′ RNA polymerase II peak and overlaps with histone H3K4Me3 and H3K9Ac marks. These findings suggest that with our data set of about 40 million reads per sample, we detected most of the known genes (polyadenylated mRNAs) in B-cells.
Figure 7.
Newly identified gene on chromosome 13. This gene has five alternatively spliced transcripts. The RNA polymerase II peak and H3K4Me3 and H3K9Ac marks are located at the 5′ ends of the gene.
Discussion
In this study, we obtained 879 million 50-bp RNA-seq reads derived from cultured B-cells of 20 CEPH individuals to characterize the human B-cell transcriptome and to determine the coverage needed for various RNA-seq studies. We mapped 80% of our sequence reads to the human reference genome, of which 84% aligned to unique locations. We found that with 100 million reads, the number of aligned reads increased with sequencing depth; however, with read depths greater than 100 million, the percentages remained constant. In contrast, the percentage of aligned reads that map unambiguously to the genome was constant at 84% for all sequencing depths.
We detected 20,776 Gencode genes and 67,453 of their alternatively spliced transcripts using an FPKM threshold of 0.05. More than 90% of multi-exon genes are alternatively spliced, but their isoforms are not expressed at similar levels. Rather, the majority of genes have one isoform that is expressed at higher levels than the other isoforms. In our expression analysis, we used an FPKM cutoff for expression because inclusion of all transcripts with FPKM values greater than zero will include some very small FPKM measurements. We accompany the use of this threshold with two caveats. First, this threshold is just a means of evaluation and should not be taken to define gene expression. There are transcripts with FPKM values less than 0.05 that are, indeed, expressed. Secondly, our results suggest that the distribution of FPKM values for genes and transcripts (Supplemental Fig. 5; Supplemental Tables 2, 3) varies with respect to sequencing depth; therefore, the threshold of 0.05 should be considered concurrently with the fact that it was determined using a sequencing depth of 879 million reads.
We assumed that our 879-million pooled data set provides a comprehensive collection of expressed genes and transcripts and their expression levels. We found that with 100 million reads, we detected the majority of genes (81%) and transcripts (90%), but their expression levels were not sufficiently accurate. At 100 million reads, only 6% of genes have FPKM measurements that are within 10% of their “final” values compared to 72% at 500 million reads. Thus deep sequence coverage is needed for gene expression studies. The coverage that we report here probably represents an upper bound of the required depth since the increasing length of sequence reads and the use of paired-end reads will allow more sequences to be mapped, thus reducing the numbers of reads needed to obtain robust expression values.
An enticing feature of RNA-seq lies in its power to detect transcripts independent of existing information. In this study, we uncovered 801 potential “unknown” genes. Most of these transcribed fragments are short and comprise single exons; only 21 of these genes are alternatively spliced. While these results do not necessarily undermine the ability to uncover unknown transcripts using RNA-seq, they suggest that with about 40 million reads per sample, we can detect most of the known genes in human B-cells.
In summary, recent advances in sequencing technologies have allowed us to obtain deep coverage of human B-cell transcriptomes at single-nucleotide resolution. Our results provide some guidelines for the design of gene expression studies. The B-cells in this study have been used in many other functional (Stern et al. 1990; Linsley et al. 1991; Peters et al. 1991) and genetic studies (Dolan et al. 2004; Morley et al. 2004; Dixon et al. 2007); detailed information on gene expression and structure will extend the previous analyses and facilitate future projects. Our data are available as the “B-Cell Transcriptome (RNA-seq)” track on the UCSC Genome Browser.
Methods
Samples
Immortalized B-cell lines for 20 European-derived individuals from the Utah pedigrees of the Center d'Étude du Polymorphisme Humain collection (CEPH) were obtained from Coriell Cell Repositories. No individuals were known to be blood relatives, and there is no known history of major medical illness. Specifically, the individuals (10 males and 10 females) are GM06985, GM07000, GM07034, GM07055, GM07056, GM07345, GM11832, GM11839, GM11992, GM11993, GM11994, GM12056, GM12145, GM12155, GM12716, GM12717, GM12750, GM12813, GM12872, and GM12891.
Cells were grown to a density of 5 × 10⁵ cells/mL in RPMI 1640 supplemented with 15% fetal bovine serum, 100 units/mL penicillin–streptomycin, and 2 mM L-glutamine. Cells were harvested 24 h after addition of fresh medium. Total RNA was extracted from cell pellets using the RNeasy Mini-Kit with DNase treatment (QIAGEN).
RNA-seq
RNA-seq was performed as recommended by the manufacturer (Illumina). Briefly, poly(A) mRNA was fragmented, and first-strand cDNA was prepared using random hexamers. Following second-strand cDNA synthesis, end repair, addition of a single A base, adaptor ligation, agarose gel isolation of ∼200-bp cDNA, and PCR amplification of the ∼200-bp cDNA, the samples were sequenced using the Illumina 1G Genome Analyzer.
Isoforms abundance estimation
Sequence reads were mapped using TopHat (v. 1.1.4) with default settings. Data sets larger than 300 million reads were randomly split into equal subsets ranging from two to four because of memory limitations. Cufflinks (v. 0.9.3) was then used to assemble reads into transcripts and estimate their abundances. Cufflinks was run (1) with a reference annotation (Gencode) to generate FPKM values for known gene models and (2) without an annotation file to create gene bundles representing potential novel transcribed fragments.
Sequence reads selection
Across the 20 samples, 43,819,745 ± 8,194,875 (mean ± standard deviation) reads were obtained. All reads from each sample were pooled to form a data set consisting of 878,668,290 million random reads. To investigate the effect of sequencing depth on RNA-seq data, we randomly selected reads from the pooled data set and created subsets varying from 1 to 9 million reads (in intervals of 1 million reads), 20 to 90 million reads (in intervals of 10 million reads), and 100 to 700 million reads (in intervals of 100 million reads).
To ensure that the particular reads selected for each sequencing depth are fairly representative, we randomly sampled 100 million reads from the pooled 879-million data set 10 times and analyzed the overall alignment statistics obtained across the 10 random samplings. The percentage of total reads aligning to the genome across the 10 randomizations was 80% ± 0.005% (mean ± standard deviation), of which 84% ± 0.005% (mean ± standard deviation) aligned to unique locations. Overall, the alignment statistics are similar across the 10 random samplings, indicating that the particular reads chosen in each of our sample sizes is representative. Furthermore, using Cufflinks, we carried out analyses to ensure that expression values are not affected by the samplings of reads. We found that across the 10 samplings, 17,967 genes and 69,672 transcripts were detected. Eighty-eight percent of the genes and transcripts were detected in all samplings. The coefficients of variation of the FPKM values for these genes across the 10 data sets were 0.10 ± 0.16 and 0.49 ± 0.53 (mean ± standard deviation). Thus, the expression levels of genes or transcripts in different samplings of 100 million reads are fairly stable.
RNA-seq and microarray analyses
For all analyses in which RNA-seq data were compared with microarray data previously generated (GSE12526), RNA-seq data were log2-normalized. Prior to log2 transformation, we added 2 to the FPKM values to avoid negative values after the log2 transformation.
Acknowledgments
We thank Drs. Alan Bruzel and Denis Smirnov for generating the RNA-seq data and comments on the manuscript, and Colleen McGarry for help with manuscript preparation. This work is supported by funds from the National Institutes of Health and the Howard Hughes Medical Institute.
Footnotes
[Supplemental material is available for this article. The sequence data from this study have been submitted to the NCBI Gene Expression Omnibus (http://www.ncbi.nlm.nih.gov/geo) under accession number GSE29158.]
Article published online before print. Article, supplemental material, and publication date are at http://www.genome.org/cgi/doi/10.1101/gr.116335.110.
References
- Ashburner M, Ball CA, Blake JA, Botstein D, Butler H, Cherry JM, Davis AP, Dolinski K, Dwight SS, Eppig JT, et al. 2000. Gene Ontology: tool for the unification of biology. The Gene Ontology Consortium. Nat Genet 25: 25–29 [DOI] [PMC free article] [PubMed] [Google Scholar]
- Bentley DR, Balasubramanian S, Swerdlow HP, Smith GP, Milton J, Brown CG, Hall KP, Evers DJ, Barnes CL, Bignell HR, et al. 2008. Accurate whole human genome sequencing using reversible terminator chemistry. Nature 456: 53–59 [DOI] [PMC free article] [PubMed] [Google Scholar]
- Brenner S, Johnson M, Bridgham J, Golda G, Lloyd DH, Johnson D, Luo S, McCurdy S, Foy M, Ewan M, et al. 2000. Gene expression analysis by massively parallel signature sequencing (MPSS) on microbead arrays. Nat Biotechnol 18: 630–634 [DOI] [PubMed] [Google Scholar]
- Cloonan N, Forrest AR, Kolle G, Gardiner BB, Faulkner GJ, Brown MK, Taylor DF, Steptoe AL, Wani S, Bethel G, et al. 2008. Stem cell transcriptome profiling via massive-scale mRNA sequencing. Nat Methods 5: 613–619 [DOI] [PubMed] [Google Scholar]
- Dausset J, Cann H, Cohen D, Lathrop M, Lalouel JM, White R 1990. Centre d'etude du polymorphisme humain (CEPH): Collaborative genetic mapping of the human genome. Genomics 6: 575–577 [DOI] [PubMed] [Google Scholar]
- DeRisi J, Penland L, Brown PO, Bittner ML, Meltzer PS, Ray M, Chen Y, Su YA, Trent JM 1996. Use of a cDNA microarray to analyse gene expression patterns in human cancer. Nat Genet 14: 457–460 [DOI] [PubMed] [Google Scholar]
- Dixon AL, Liang L, Moffatt MF, Chen W, Heath S, Wong KC, Taylor J, Burnett E, Gut I, Farrall M, et al. 2007. A genome-wide association study of global gene expression. Nat Genet 39: 1202–1207 [DOI] [PubMed] [Google Scholar]
- Dolan ME, Newbold KG, Nagasubramanian R, Wu X, Ratain MJ, Cook EH Jr, Badner JA 2004. Heritability and linkage analysis of sensitivity to cisplatin-induced cytotoxicity. Cancer Res 64: 4353–4356 [DOI] [PubMed] [Google Scholar]
- Fodor SP, Rava RP, Huang XC, Pease AC, Holmes CP, Adams CL 1993. Multiplexed biochemical assays with biological chips. Nature 364: 555–556 [DOI] [PubMed] [Google Scholar]
- Harrow J, Denoeud F, Frankish A, Reymond A, Chen C, Chrast J, Lagarde J, Gilbert J, Storey R, Swarbreck D et al. 2006. GENCODE: producing a reference annotation for ENCODE. Genome Biol (Suppl 1) 7: S4.1–S4.9 [DOI] [PMC free article] [PubMed] [Google Scholar]
- Langmead B, Trapnell C, Pop M, Salzberg SL 2009. Ultrafast and memory-efficient alignment of short DNA sequences to the human genome. Genome Biol 10: R25 doi: 10.1186/gb-2009-10-3-r25 [DOI] [PMC free article] [PubMed] [Google Scholar]
- Linsley PS, Brady W, Urnes M, Grosmaire LS, Damle NK, Ledbetter JA 1991. Ctla-4 is a 2nd receptor for the B-cell activation antigen-B7. J Exp Med 174: 561–569 [DOI] [PMC free article] [PubMed] [Google Scholar]
- Lister R, O'Malley RC, Tonti-Filippini J, Gregory BD, Berry CC, Millar AH, Ecker JR 2008. Highly integrated single-base resolution maps of the epigenome in Arabidopsis. Cell 133: 523–536 [DOI] [PMC free article] [PubMed] [Google Scholar]
- Montgomery SB, Sammeth M, Gutierrez-Arcelus M, Lach RP, Ingle C, Nisbett J, Guigo R, Dermitzakis ET 2010. Transcriptome genetics using second generation sequencing in a Caucasian population. Nature 464: 773–777 [DOI] [PMC free article] [PubMed] [Google Scholar]
- Morley M, Molony CM, Weber TM, Devlin JL, Ewens KG, Spielman RS, Cheung VG 2004. Genetic analysis of genome-wide variation in human gene expression. Nature 430: 743–747 [DOI] [PMC free article] [PubMed] [Google Scholar]
- Mortazavi A, Williams BA, McCue K, Schaeffer L, Wold B 2008. Mapping and quantifying mammalian transcriptomes by RNA-Seq. Nat Methods 5: 621–628 [DOI] [PubMed] [Google Scholar]
- Nagalakshmi U, Wang Z, Waern K, Shou C, Raha D, Gerstein M, Snyder M 2008. The transcriptional landscape of the yeast genome defined by RNA sequencing. Science 320: 1344–1349 [DOI] [PMC free article] [PubMed] [Google Scholar]
- Pan Q, Shai O, Lee LJ, Frey BJ, Blencowe BJ 2008. Deep surveying of alternative splicing complexity in the human transcriptome by high-throughput sequencing. Nat Genet 40: 1413–1415 [DOI] [PubMed] [Google Scholar]
- Peters PJ, Neefjes JJ, Oorschot V, Ploegh HL, Geuze HJ 1991. Segregation of Mhc Class-Ii molecules from Mhc Class-I molecules in the Golgi-complex for transport to lysosomal compartments. Nature 349: 669–676 [DOI] [PubMed] [Google Scholar]
- Pickrell J, Pai A, Gilad Y, Pritchard J 2010. Noisy splicing drives mRNA isoform diversity in human cells. PLoS Genet 6: e1001236 doi: 10.1371/journal.pgen.1001236 [DOI] [PMC free article] [PubMed] [Google Scholar]
- Rosenbloom KR, Dreszer TR, Pheasant M, Barber GP, Meyer LR, Pohl A, Raney BJ, Wang T, Hinrichs AS, Zweig AS, et al. 2009. ENCODE whole-genome data in the UCSC Genome Browser. Nucleic Acids Res 38: D620–D625 [DOI] [PMC free article] [PubMed] [Google Scholar]
- Stern AS, Podlaski FJ, Hulmes JD, Pan YCE, Quinn PM, Wolitzky AG, Familletti PC, Stremlo DL, Truitt T, Chizzonite R, et al. 1990. Purification to homogeneity and partial characterization of cytotoxic lymphocyte maturation factor from human B-lymphoblastoid cells. Proc Natl Acad Sci 87: 6808–6812 [DOI] [PMC free article] [PubMed] [Google Scholar]
- Trapnell C, Pachter L, Salzberg SL 2009. TopHat: discovering splice junctions with RNA-Seq. Bioinformatics 25: 1105–1111 [DOI] [PMC free article] [PubMed] [Google Scholar]
- Trapnell C, Williams BA, Pertea G, Mortazavi A, Kwan G, van Baren MJ, Salzberg SL, Wold BJ, Pachter L 2010. Transcript assembly and quantification by RNA-Seq reveals unannotated transcripts and isoform switching during cell differentiation. Nat Biotechnol 28: 511–515 [DOI] [PMC free article] [PubMed] [Google Scholar]
- Velculescu VE, Zhang L, Vogelstein B, Kinzler KW 1995. Serial analysis of gene expression. Science 270: 484–487 [DOI] [PubMed] [Google Scholar]
- Wang E, Sandberg R, Luo S, Khrebtukova I, Zhang L, Mayr C, Kingsmore S, Schroth G, Burge C 2008. Alternative isoform regulation in human tissue transcriptomes. Nature 456: 470–476 [DOI] [PMC free article] [PubMed] [Google Scholar]
- Wilhelm BT, Marguerat S, Watt S, Schubert F, Wood V, Goodhead I, Penkett CJ, Rogers J, Bahler J 2008. Dynamic repertoire of a eukaryotic transcriptome surveyed at single-nucleotide resolution. Nature 453: 1239–1243 [DOI] [PubMed] [Google Scholar]


