

Abstract
Several human syndromes are associated with haploinsufficiency of chromosomal regions secondary to microdeletions. Isolated lissencephaly sequence (ILS), a human developmental disease characterized by a smooth cerebral surface (classical lissencephaly) and microscopic evidence of incomplete neuronal migration, is often associated with small deletions or translocations at chromosome 17p13.3. Miller–Dieker syndrome (MDS) is associated with larger deletions of 17p13.3 and consists of classical lissencephaly with additional phenotypes including facial abnormalities. We have isolated the murine homologs of three genes located inside and outside the MDS region: Lis1, Mnt/Rox, and 14-3-3ε. These genes are all located on mouse chromosome 11B2, as determined by metaphase FISH, and the relative order and approximate gene distance was determined by interphase FISH analysis. The transcriptional orientation and intergenic distance of Lis1 and Mnt/Rox were ascertained by fragmentation analysis of a mouse yeast artificial chromosome containing both genes. To determine the distance and orientation of 14-3-3ε with respect to Lis1 and Mnt/Rox, we introduced a super-rare cutter site (VDE) that is unique in the mouse genome into 14-3-3ε by gene targeting. Using the introduced VDE site, the orientation of this gene was determined by pulsed field gel electrophoresis and Southern blot analysis. Our results demonstrate that the MDS region is conserved between human and mouse. This conservation of linkage suggests that the mouse can be used to model microdeletions that occur in ILS and MDS.
Contiguous gene syndromes are complex human genetic diseases caused by the deletion of physically contiguous but functionally unrelated genes (Ledbetter and Ballabio 1995). These syndromes are the consequence of de novo deletions of characteristic chromosomal regions, resulting in hemizygosity and haploinsufficiency of genes contained within the deleted regions. Deletions of 17p13.3 result in two well-characterized disorders: isolated lissencephaly sequence (ILS) and Miller–Dieker syndrome (MDS). ILS is a brain malformation disorder characterized by smoothness of the cerebral surface with disordered organization of the cortical layers (classical lissencephaly), the result of defective neuronal migration at 9–13 weeks of embryonic development (Dobyns 1987). This disease is associated with de novo translocations or submicroscopic deletions within chromosome 17p13.3 in almost 40% of patients (Dobyns et al. 1993). MDS consists of classical lissencephaly, characteristic facial abnormalities, and occasionally other birth defects (Dobyns et al. 1992). In MDS, either visible cytogenetic or submicroscopic deletions are detected in >90% of patients. By mapping the extent of deletions in patients with ILS and MDS, critical regions responsible for each of these disorders have been described (Chong et al. 1997). The deleted regions in patients with these disorders have considerable overlap, although the MDS region extends more telomeric on 17p13.3. These results suggest that clinical severity correlates with the extent of deletion of the critical region, resulting in haploinsufficiency.
Recently, a candidate gene for lissencephaly, LIS1, was isolated in 17p13.3 (Reiner et al. 1993). LIS1 was later identified as the human homolog of the 45-kD brain isoform of a subunit of platelet-activating factor acetylhydrolase (Hattori et al. 1994). Point mutations and rearrangements of LIS1 have been found in several patients with ILS (Chong et al. 1997; LoNigro et al. 1997). Exons of other genes have also been identified within the chromosome region of MDS (S.S. Chong and D.H. Ledbetter, unpubl.). However, the relationships between gene function and haploinsufficiency in ILS and MDS remain to be elucidated. To address these issues, it will be valuable to analyze mice with gene disruptions and defined deletions within the MDS critical region.
As a first step toward creating a mouse model for lissencephaly and MDS, we isolated murine homologs of three genes, Lis1, Mnt/Rox, and 14-3-3ε, located within the critical regions for MDS and ILS. We have found that the location and order of these genes is evolutionarily conserved between human and mouse, suggesting that it will be possible to model MDS deletions in the mouse.
RESULTS
Isolation of Mouse Genomic Clone of Lis1, Mnt/Rox, and 14-3-3ε
A 129Sv λ phage genomic library was screened using human LIS1, MNT/ROX, and 14-3-3ε cDNA. We isolated 11, 2 and 2 positive phage clones for Lis1, Mnt/Rox, and 14-3-3ε, respectively. To screen for overlap of these genomic clones, we compared restriction fragment patterns of each clone (fingerprinting analysis) using EcoRI and PstI. The two independent clones isolated for Mnt/Rox showed similar fingerprinting patterns, indicating that the two clones were overlapping or identical (data not shown). Similarly, the two clones of 14-3-3ε displayed identical fingerprinting patterns (data not shown). The fingerprinting profiles revealed that the 11 Lis1 clones were comprised of three different overlapping groups of clones (data not shown), consistent with the presence of at least three Lis family members in the mouse (Reiner et al. 1995).
The mouse cDNA sequences of Lis1 (Peterfy et al. 1994) and 14-3-3ε (McConnell et al. 1995) have been reported previously, and Mnt/Rox was sequenced recently for both human and mouse (Hurlin et al. 1997; Meroni et al. 1997). To identify exons located within phage clones of all three genes, we subcloned phage inserts into pBluescript after digestion with AluI or Sau3AI. These subclone libraries were screened using cDNA probes for each gene. Clones containing exons of each gene were sequenced to identify exons and exon–intron junctions. The alignment of genomic sequences with each mouse cDNA sequence indicated that they represent genomic clones for Lis1, Mnt/Rox and 14-3-3ε (data not shown).
FISH Analysis of Lis1, Mnt/Rox, and 14-3-3ε Phage Clones
Multicolor fluorescence in situ hybridization (FISH) analysis of the phage clones for Lis1, Mnt/Rox, and 14-3-3ε on metaphase and interphase chromosomes was performed to determine the chromosome location and establish the order of these three genes. With metaphase FISH, all three genes were located within the same region of mouse chromosome 11B2 when examined individually (Fig. 1A–C) or simultaneously (Fig. 1D). Chromosome 11 was identified using Brca1 as a marker (Schröck et al. 1996). The other two groups of the genomic clones that were isolated by LIS1 cDNA were mapped to different chromosomes by metaphase FISH (data not shown). Interphase FISH was performed with the three phage clones to determine relative gene order. As in the human, the gene order was Lis1, Mnt/Rox, and 14-3-3ε (Fig. 1E). In addition, the relative distance between these genes was estimated by comparing the separation between hybridization signals in several nuclei using FISH on halo preparations (Haaf and Ward 1994a,b) from interphase nuclei (fiberFISH). The distance between Lis1 and Mnt/Rox was about one-third of the distance between Mnt/Rox and 14-3-3ε (Fig. 1F). Thus, these three genes colocalized to the same region of the mouse chromosome syntenic to human 17p13.3, and gene order and relative distance were conserved between mouse and human.
Figure 1.

FISH on normal mouse metaphase chromosomes, interphase nuclei, and extended chromatin. Brca1 (FITC, green fluorescence) was used as a marker for chromosome 11, and colocalized on metaphase spreads to chromosome 11 with: (A) Lis1; (B) Mnt/Rox; (C) 14-3-4ε; (D) Lis1, Mnt/Rox, and 14-3-3ε (rhodamine, red fluorescence). (E) Gene order was established by three–color FISH on mouse interphase nuclei: Lis1 (red); Mnt/Rox (green); 14-3-3ε (orange, mix of biotin- and digoxigenin-labeled DNA, 1:1 ratio). (F) FiberFISH was used for evaluation of relative distances between Lis1 (orange), Mnt/Rox (green), and 14-3-3ε (red).
Determination of the Transcriptional Orientation of Lis1 and Mnt/Rox by YAC Fragmentation
To determine the relative transcriptional directions of Lis1 and Mnt/Rox, yeast fragmentation (Pavan et al. 1990) of a yeast artificial chromosome (YAC) clone containing Lis1 and Mnt/Rox was performed. The Princeton mouse YAC library was screened as pools, and one positive YAC clone was isolated that contained both genes. The YAC containing Lis1 and Mnt/Rox and the fragmentation strategy are represented in Figure 2A. Fragmentation vectors for each gene were created by inserting genomic clones of Lis1 and Mnt/Rox into the yeast fragmentation vector pB1R (Lewis et al. 1992) in both orientations. Homologous recombination between the YAC and the fragmentation vector will result in deletion of all sequences distal to the integration site, including TRP1, and integration of a new auxotrophic marker LYS2. The viability of the recombinant yeast depends on the ability of the fragmentation to result in a functional YAC, which in turn is dependent upon the orientation of the DNA fragment inserted into the yeast fragmentation vector. If the gene is inserted in the correct orientation in the fragmentation vector, recombination with the YAC will result in a deleted YAC with a centromere and LYS2. In contrast, after recombination with the fragmentation vector containing the gene in the opposite orientation, the deleted YAC will contain LYS2, but will lose the centromere. This will cause loss of the deleted YAC during mitosis, and result in inefficient growth on plates lacking lysine. Gene orientation can be inferred by comparison of the frequency of the fragmentation vectors in both directions, and confirmed by Southern analysis of the resulting deleted YACs.
Figure 2.

Lis1-Mnt/Rox YAC fragmentation for transcriptional orientation. (A) Schematic representation of YAC fragmentation. (Top) The Lis1-Mnt/Rox YAC clone is shown, with the location of the two genes, URA3 and TRP1 selectable markers, and the position of the centromere and telomeres. (Middle) The fragmentation vectors with LYS as the selectable marker near the telomere, and the Mnt/Rox (left) or Lis1 (right) cloned in both orientations relative to the telomere. Underneath the fragmentation vectors, the number of colonies per microgram of vector are indicated. (Bottom) The gene orientation on the YAC relative to centromere was inferred by comparison of the recombinant frequency of each fragmentation vector. The arrows indicate the 5′ → 3′ direction of each gene. (B) Southern analysis of the fragmented YAC. (Top) The original YAC is shown on the first line, followed by the organization of the Lis1- and Mnt/Rox-deleted YACs. The locations and transcriptional directions of the two genes, as determined by colony number, and the locations of three hybridization probes are shown. The arrows indicate the 5′ → 3′ direction of each gene. (Bottom) DNA from two LYS+ transformants from the Lis1 fragmentation, and two from the Mnt/Rox fragmentation, were digested with EcoRI, transferred to nylon membranes, and probed with three different probes: a Mnt/Rox 3′ probe, a Mnt/Rox 5′ probe, and a Lis1 5′ probe.
Four fragmentation vectors were constructed that contained Lis1 or Mnt/Rox in both orientations. Vectors were linearized, transformed singly with each YAC, and selected for LYS prototropy. For the Lis1 vectors, there were 7.8-fold more stable LYS+ transformants produced with the R fragmentation vector than with the L vector. For Mnt/Rox, 2.1-fold more clones were produced with the L vector than with the R vector (Fig. 2A). These results suggest that Lis1 and Mnt/Rox are transcribed divergently. The sizes of the fragmented YAC clones were compared with the original YAC, which was 600 kb (data not shown), by pulsed field gel electrophoresis (PFGE) and Southern analysis using pBR322 as probe. The fragmented YACs with Lis1 and Mnt/Rox were 400 kb and 200 kb, respectively, indicating that the distance between these genes is ∼200 kb (data not shown) and demonstrating that fragmentation had occurred. To further support this relative gene orientation, YAC DNAs were isolated from fragmented clones recovered from Lis1 or Mnt/Rox vectors, digested with EcoRI, and probed with three independent probes: a Mnt/Rox 3′ probe, a Mnt/Rox 5′ probe, and a Lis1 5′ probe (Fig. 2B). Yeast DNA of LYS+ clones from the Lis1 fragmentation hybridized to all three probes, whereas DNA of clones from the Mnt/Rox fragmentation hybridized only with the Mnt/Rox 3′ probe, as expected (Fig. 2B). Thus, the orientation estimated by the recombination frequency was completely consistent with the Southern hybridization data, demonstrating that Lis1 and Mnt/Rox are transcribed divergently.
Insertion of Super-Rare Cutter VDE at 14-3-3ε Locus by Homologous Recombination
A single YAC clone containing both Mnt/Rox and 14-3-3ε could not be isolated by repeated screening. Therefore, we could not use YAC fragmentation to determine gene distance and transcriptional orientation. Because the physical distance between Lis1 and Mnt/Rox is ∼200 kb (see above), using relative distances in fiberFISH (Fig. 1F), the distance between Mnt/Rox and 14-3-3ε was estimated to be 600 kb (Fig. 1F), consistent with the human physical map. To determine the relative gene orientation spanning this long distance, we inserted the super-rare cutter site VDE at the 14-3-3ε locus by homologous recombination in embryonic stem (ES) cells. VDE is a DNA endonuclease derived from the VMA1 gene product of Saccharomyces cerevisiae (Gimble and Thorner 1992) and is related to other nucleases involved in rearrangement (Bremer et al. 1992). Considering its long recognition sequence (34 bp), it seemed reasonable to assume that this inserted site would be unique or rare within the mouse genome. To confirm this, mouse genomic DNA was embedded into agarose blocks and digested with VDE, followed by PFGE analysis. The ethidium bromide staining profile displayed no significant difference with or without VDE digestion (data not shown).
Therefore, we used gene targeting to insert a VDE site, along with a pMC1hyg gene, into the 14-3-3ε locus using a replacement-type targeting construct (Fig. 3A). Correct targeting should also result in the disruption of this gene. ES cells were transfected and screened for the presence of targeted events at the 14-3-3ε locus. DNA from each clone was digested with BamHI followed by agarose gel electrophoresis. After Southern blotting and hybridization with an external probe, one positive clone out of 121 was identified (Fig. 3B), as demonstrated by the presence of a 7-kb polymorphic targeted band. Southern analysis with several restriction enzymes and probes confirmed that this clone was correctly targeted at the 14-3-3ε locus (data not shown).
Figure 3.
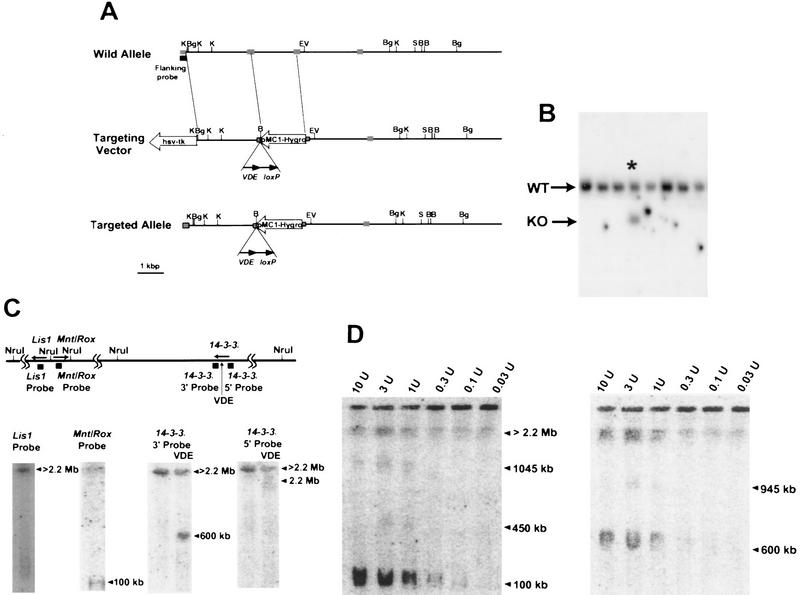
14-3-3ε targeting of VDE site for determination of transcriptional orientation. (A) The restriction map and the targeting vector are shown. pMC1hyg and PGK–tk indicate the genes used for positive and negative selection with hygromycin and FIAU; arrow directions indicate transcriptional orientation. VDE and loxP sites are indicated. The dotted boxes indicate 14-3-3ε exons. Restriction sites are as follows: (B) BamHI; (Bg) BglII; (EV) EcoRV; (H) HindIII; (K) KpnI; (S) SalI; (VDE) the super-rare cutter. (B) The result of the screening of the transfected ES cell by Southern hybridization using a flanking probe and BamHI digestion. (Asterisk) The positive clone; (WT) wild-type allele; (KO) knock-out allele. (C, top) The NruI restriction map of the MDS region in the mouse, with the location of the three genes (the direction of transcription indicated by arrows), and the location of probes used for hybridization. (Bottom) PFGE and Southern hybridization of DNA from the targeted ES clone with a VDE site inserted into the 14-3-3ε locus. DNA was digested with NruI alone (nothing above the lane), or NruI and VDE (indicated by VDE above the lane), and hybridized with the indicated probes. The arrows indicate the sizes of the bands detected with each probe. (D) PFGE Southern hybridization for complete VDE digestion and complete or partial NruI digestion. The enzyme concentration per microliter is above each lane. The arrowheads indicated the band detected by the 14-3-3ε 3′ probe.
Determination of the Transcription Orientation of 14-3-3ε
The 14-3-3ε targeted ES clone, with insertion of the VDE site, was used to determine the gene orientation and the distance between Mnt/Rox and 14-3-3ε. Using wild-type DNA, PFGE and Southern analysis demonstrated that Mnt/Rox is located within a 100-kb NruI fragment (Fig. 3C). On the other hand, both Lis1 and 14-3-3ε are located within very large (>2.2 Mb) NruI fragments (Fig. 3C). To determine the relative orientation and distance of 14-3-3ε from Mnt/Rox, DNA from the 14-3-3ε-targeted ES clone was digested with NruI and VDE, followed by PFGE, Southern analysis, and hybridization with 5′ or 3′ probes of 14-3-3ε on either side of the VDE site (Fig. 3D). The size of the bands detected by 5′ and 3′ probes were used to determine the transcriptional orientation of 14-3-3ε relative to Mnt/Rox. The physical map of the human and the mouse interphase and fiberFISH data estimated that Mnt/Rox and 14-3-3ε are located within 600 kb (see above). The 14-3-3ε 5′ probe detected a very large fragment (>2.2 Mb), and the 14-3-3ε 3′ probe detected a 600-kb fragment. These results suggest that 14-3-3ε is transcribed in a direction toward Mnt/Rox, because this is the only orientation compatible with the detection of these sized bands. This interpretation was supported by partial digestion of DNA from the targeted clone with NruI (Fig. 3D). The targeted 14-3-3ε ES cell DNA was digested completely with VDE, followed by partial digestion with NruI using various enzyme concentrations. After PFGE and Southern analysis with a 3′ probe of 14-3-3ε, 945- and 600-kb fragments were detected, whereas a Mnt/Rox probe on the same filter detected bands of 100, 450, and 1045 kb (Fig. 3D). Because 14-3-3ε and Mnt/Rox are located within 600 kb by fiberFISH, and Lis1 and 14-3-3ε are located on large (>2.2-Mb fragments), the Southern data is consistent only with the interpretation that 14-3-3ε is transcribed toward Mnt/Rox. The gene distance and orientation estimated from the NruI restriction map was also supported by partial NotI digestion and Southern analysis (data not shown).
The gene organization of the human MDS/ILS region and murine syntenic region is summarized in Fig. 4. The organization of three genes in this region is similar between the mouse and human. In the mouse, Lis1 and Mnt/Rox are transcribed divergently, and are located 170 kb apart. 14-3-3ε is transcribed toward Mnt/Rox, and these genes are located within 1 Mb of each other.
Figure 4.

Comparison of human and mouse genomic organization in the MDS/ILS critical region. (A) Gene organization in the human MDS/ILS region on human 17p13.3 (after Chong et al. 1997). The broken line indicates the extent of deletion in each patient. The locations of genes and polymorphic markers are indicated at the bottom. (B) Murine syntenic region of 11B2.
DISCUSSION
Several human syndromes are associated with the hemizygous deletion of a specific chromosomal region (Ledbetter and Ballabio 1995). A subset of these appear to be classical contiguous gene syndromes, in which the inactivation of several unrelated genes is involved in a complex phenotype, and the severity of the phenotype is determined by the genes that are deleted. MDS appears to be a typical example of a contiguous gene syndrome. Certain deletions in this region result in ILS, whereas overlapping and larger deletions result in MDS. The relationships between gene function and phenotype in human contiguous gene syndromes are difficult to study in patients, so the creation of a mouse model would be a valuable tool to examine these relationships. A detailed determination of genomic organization of the MDS critical region is a prerequisite to the creation of a mouse model of ILS/MDS.
In this paper, we describe the genomic organization of the MDS critical region in the mouse. The mouse homologs of three human genes present in the MDS region were cloned and sequenced. Comparison of this sequence with the cDNA sequence of murine Lis1 (Peterfy et al. 1994) and 14-3-3ε (McConnell et al. 1995) and human and murine Mnt/Rox (Hurlin et al. 1997; Meroni et al. 1997) allowed us to identify exons and exon–intron junctions of these three genomic clones. All three genes were mapped to the region of mouse chromosome 11 that is syntenic to the MDS region on human 17p13.3 by FISH. Using interphase FISH, we were able to determine relative gene orientation and distance of these murine genes, and they were similar to the gene organization in the human genes (Chong et al. 1996). We determined the relative transcriptional directions of these three murine genes by using two novel approaches. The transcription direction of Lis1 relative to Mnt/Rox was determined using YAC fragmentation (Pavan et al. 1990), demonstrating that these genes are divergently transcribed. The relative direction of 14-3-3ε was determined by the introduction of a super-rare cutter site for VDE digestion into the locus through homologous recombination in ES cells. PFGE and Southern analysis then allowed us to determine that 14-3-3ε is transcribed the same direction as Lis1.
The murine homologs of Lis1, Mnt/Rox, and 14-3-3ε each encode known proteins. Lis1 was isolated as a gene that showed partial deletion in two patients with lissencephaly (Reiner et al. 1993), and was later identified as the homolog of one of the subunits of platelet-activating factor acetylhydrolase (Hattori et al. 1994). Lis1 is expressed in the cortical plate in the developing mouse (Reiner et al. 1995), consistent with its presumed role in neuronal migration. Mnt/Rox is deleted in all patients with MDS. Mnt/Rox is a basic helix–loop–helix domain that interacts with Max and Sin3 to regulate the activity of c-Myc (Hurlin et al. 1997; Meroni et al. 1997). 14-3-3ε is located in a region with frequent loss of heterozygosity in several cancers (Phillips et al. 1993; McDonald et al. 1994), raising the possibility that this gene may act as a tumor suppressor. Additionally, an interaction between 14-3-3ε and cdc25B has been described (Conklin et al. 1995), suggesting a role in cell cycle regulation. Thus, all three genes that were analyzed have potential function in development, and may play a role in the ILS and/or MDS phenotypes.
Conservation of synteny is a feature of mammalian chromosomes (DeBry and Seldin 1996). Within these regions, the gene order appears to be similar, although detailed examination of distances and orientation have been performed for few of those regions. We have examined the conservation of synteny between human chromosome 17p13.3 and mouse 11B2 in detail. Our data demonstrate that the gene order and distance of these genes have been conserved between the mouse and human. The evolutionary conservation suggests either that there is some functional importance to the organization of this genomic region or that there is not sufficient evolutionary distance between these species for divergence to have occurred. Because we have not identified all genes in this region in either mouse or human, we cannot rule out the possibility that small rearrangements may be present. However, the overall organization of these regions is conserved between these two species. Because there is conservation of linkage, it will be possible to create deletions in the mouse that mimic those of ILS and MDS. Such models will likely be effective reagents for the molecular dissection of the genes involved in the pathogenesis of these disorders. The detailed organization of the murine homologous region described here provides an important framework for the creation of a mouse model of ILS and MDS.
METHODS
Isolation of Mouse Genomic Clones of Lis1, Mnt/Rox, and 14-3-3ε
A λ phage genomic library (strain 129/Sv, Stratagene) was screened with labeled cDNAs for human LIS1, MNT/ROX, and 14-3-3ε. As probes, the 1.5-kb HindIII fragment of human LIS1 cDNA (Reiner et al. 1993), the 0.8-kb HindIII–PvuII fragment of human MNT/ROX cDNA (Meroni et al. 1997), and the 1.7-kb PCR-amplified product from a human 14-3-3ε cDNA clone (Chong et al. 1996) were used. The phage DNAs were purified by standard procedures (Sambrook et al. 1989). Phage inserts were cloned into the NotI site of the pBluescript (Stratagene) and digested with NotI and EcoRI or PstI for fingerprinting.
To determine exons and exon–intron junctions, the plasmid subclones were digested with AluI or Sau3AI and subcloned into the EcoRV or BamHI sites of pBluescript II (Stratagene), respectively. These subcloned libraries were screened with cDNA probes as described above. The plasmid DNAs of the positive colonies were extracted by the Qiagen plasmid kit, and sequenced by automated cycle methods (model 377, Perkin-Elmer Applied Biosystem Inc.; Robbins et al. 1996). GenBank accession nos. of Lis1, Mnt/Rox, and 14-3-3ε are U34277, U77536, and Z19599, respectively.
FISH Analysis Using Phage Clones
Slides with metaphase spreads, interphase nuclei, and extended chromatin were prepared from normal mouse fibroblasts. Interphase and metaphase FISH were performed as described (Pinkel et al. 1986; Haaf and Ward 1994 a,b), using phage and cosmid genomic probes labeled with digoxigenin-11–dUTP. Hybridization signals were scored using a Zeiss Axiophot fluorescence microscope and three-color images were captured on a Photometrics cooled-CCD camera (Photometrics, Ltd., Tucson, AZ) using IP Lab image software (Signal Analytics Corporation, Vienna, VA). Genomic clones of Lis1, Mnt/Rox, and 14-3-3ε, as well as Brca1 (Schröck et al. 1996) as a marker for chromosome 11, were used as FISH hybridization probes. At least 25 metaphase spreads, 100 interphase nuclei, and 15 fiberFISH preparations were examined with identical results.
Isolation of YACs Containing Lis1 and Mnt/Rox
The YAC clone containing Lis1 and Mnt/Rox was obtained by screening the Princeton mouse YAC library by PCR. Pools of YAC DNA prepared from the library were screened in two steps using a pair of Mnt/Rox specific primers (5′-CTTCTTCAGCCGGTGCCAACTTCA-3′ and 5′-CCCTCCCTGCGCCCATCCTG-3′). We identified two positive YAC clones containing Mnt/Rox. YAC DNA was prepared according to standard procedures (Smith et al. 1988). These two DNAs were amplified by PCR using a pair of Lis1-specific primers (5′-TACCGTGCATGGTTCTGATGC-3′ and 5′-TCTCAAGGGCCATACAGACTCTG-3′) with the same conditions described above. One positive YAC clone containing both Lis1 and Mnt/Rox was identified.
YAC Fragmentation for Lis1 and Mnt/Rox Transcriptional Orientation
To make fragmentation vectors for Lis1 and Mnt/Rox, the 6-kb SalI–SalI (Fig. 2A) fragment of the Lis1 genomic clone and the 10-kb EcoRI–EcoRI fragment (Fig. 2B) of the Mnt/Rox genomic clones were inserted into EcoRI site of the yeast fragmentation vector, pB1R (Lewis et al. 1992), in both orientations. The orientation of the inserts was determined by restriction site analysis.
Yeast cells (5 × 10⁷) were transformed with 2 μg of the fragmentation vectors digested with NotI and SalI. Transformation was accomplished with lithium acetate using the Alkali-Cation Yeast Kit (BIO 101). Transformants were selected on plates lacking lysine but supplemented with uracil. LYS+ transformants were further tested for the ability to grow in the absence of lysine and uracil or tryptophan and uracil. For PFGE analysis, high-molecular-weight yeast DNA of URA+, TRP−, and LYS+ transformants were prepared (Smith et al. 1988), and electrophoretic karyotypes were assessed using CHEF DRII (Bio-Rad). In addition, yeast DNA from transformants was digested with EcoRI, and separated by agarose gel electrophoresis, and DNAs were subsequently transferred to Hybond N+ (Amersham). Probes used for hybridization included a 0.5-kb SalI–BamHI fragment of the Lis1 genomic clone, a 0.7-kb EcoRI–SalI fragment, a 0.5-kb BamHI–BamHI fragment of the Mnt/Rox genomic clone, and pBR322.
Construction of Targeting Vector for Insertion of VDE into 14-3-3ε
Genomic fragments of 14-3-3ε were amplified from 129Sv mouse genomic DNA directly using long PCR. The primers were synthesized based on the reported mouse 14-3-3ε sequence (McConnell et al. 1995). The primer pair 5′-ATGGACGTGGAGCTGACAGTTGAAGA-3′ and 5′-TGTTAGCTGCTGGAATGA GGTGTTTG-3′ was used for amplification of a 3.5-kb fragment located at the 5′ site of the 14-3-3ε. The primer pair, 5′-ACTTCCTCCAACGCACCCCATTC-3′ and 5′-TCACTGATTCTCATCTTCACATCCT-3′ was used for amplification of a 9.0-kb fragment located at 3′ site of the 14-3-3ε. A shuttle PCR program was performed: 5 min at 95°C, 30 cycles each of 1 min at 95°C and 15 min at 68°C, followed by additional extension of 15 min at 72°C using a LA PCR Kit (Takara, Oncor). The amplified fragments were inserted into pCRII using the TA Cloning Kit (Invitrogen).
These fragments were cloned into a modified version of the targeting vector pPNT (Tybulewicz et al. 1991), where the PGK–neo gene was replaced with pMC1–hyg. In this vector, pPNT–hyg loxP VDE, a cassette was inserted at unique cloning sites between the 3′ end of the pMC–1hyg and PGK–tk. The cassette contains several novel restriction sites, a loxP site, and a VDE restriction site. To create the targeting construct for 14-3-3ε, the 3.3-kb BglII–BamHI fragment of the 5′ region was inserted at a unique BamHI site of pPNT–loxPVDE. The 9.0-kb XhoI–SacI fragment of the 3′ region was made blunt with T4 DNA polymerase (NEB) followed by insertion at a unique XhoI site of pPNT–loxPVDE (Fig. 3A).
Insertion of Super-Rare Cutter VDE to 14-3-3ε locus of ES Cell by Homologous Recombination
TC1 ES cells (Deng et al. 1996) were transfected with NotI-linearized 14-3-3ε targeting vector and selected with hygromycin and FIAU. The culture, electroporation, and selection of TC1 cells were carried out as described (Deng et al. 1994). ES cell colonies that were resistant to both hygromycin and FIAU were analyzed by Southern blotting for homologous recombination events within the 14-3-3ε locus by a novel method that used 96-well plates and low-melting-temperature agarose (S. Hirotsune and A. Wynshaw-Boris, unpubl.). Genomic DNAs from drug-resistant ES clones were digested with BamHI and transferred to Hybond N+ after separation by electrophoresis in 0.8% agarose gel in 0.5× TBE. The membrane was probed with a 0.2-kb EcoRI–BglII fragment derived from the 5′ genomic fragment of 14-3-3ε (Fig. 3A).
Determination of the Orientation and Distance of 14-3-3ε
We used the inserted VDE site for determination of the orientation and distance of 14-3-3ε relative to Lis1 and Mnt/Rox. The 14-3-3ε targeted ES cells were embedded in low melting agarose (0.5 × 10⁷ cells/300 μl), and DNA was prepared as described above. DNA of the targeted clone was digested completely with VDE and partially with NruI, separated by PFGE, and transferred and hybridized with a 5′ or 3′ probe of 14-3-3ε as described above. The PCR-amplified product used for screening ES clones for targeting was used for the 5′ probe. As the 3′ probe, a PCR-amplified product using two primers (5′-TCACTCTTGCCTTAAGAACTTCTGAAAA-3′, 5′-GCTGCAGGATGTGGAAGATGAGAAT-3′) was used. To construct a restriction map with NruI, the agarose block was digested with VDE completely followed by partial NruI digestion with various enzyme concentrations (1–0.003 unit/μl).
Acknowledgments
We thank Denise Larson and Lisa Garrett for excellent technical support; Robert Eisenman and Romeo Carrozzo for communicating data prior to publication; and Robert Nussbaum for his generous support.
The publication costs of this article were defrayed in part by payment of page charges. This article must therefore be hereby marked “advertisement” in accordance with 18 USC section 1734 solely to indicate this fact.
Footnotes
E-MAIL tonywb@nhgri.nih.gov; FAX (301) 402–2170.
REFERENCES
- Bremer MCD, Gimble FS, Thorner J, Smith CL. VDE endonuclease cleaves Saccharomyces cerevisiae genomic DNA at a single site: Physical mapping of the VMA1 gene. Nucleic Acids Res. 1992;20:5484. doi: 10.1093/nar/20.20.5484. [DOI] [PMC free article] [PubMed] [Google Scholar]
- Chong SS, Tanigami A, Roschke AV, Ledbetter DH. 14-3-3ε has no homology to LIS1 and lies telomeric to it on chromosome 17p13.3 outside the Miller–Dieker syndrome chromosome region. Genome Res. 1996;6:735–741. doi: 10.1101/gr.6.8.735. [DOI] [PubMed] [Google Scholar]
- Chong SS, Pack SD, Roschke AV, Tanigami A, Carrozzo R, Smith ACM, Dobyns WB, Ledbetter DH. A revision of the lissencephaly and Miller–Dieker syndrome critical region in chromosome 17p13.3. Hum Mol Genet. 1997;6:147–155. doi: 10.1093/hmg/6.2.147. [DOI] [PubMed] [Google Scholar]
- Conklin DS, Galaktionov K, Beach D. 14-3-3 proteins associate with cdc25 phosphatases. Proc Natl Acad Sci. 1995;92:7892–7896. doi: 10.1073/pnas.92.17.7892. [DOI] [PMC free article] [PubMed] [Google Scholar]
- DeBry RW, Seldin MF. Human/mouse homology relationships. Genomics. 1996;33:337–351. doi: 10.1006/geno.1996.0209. [DOI] [PubMed] [Google Scholar]
- Deng C, Wynshaw-Boris A, Shen M, Daugherty C, Ornitz DM, Leder P. Murine FGFR-1 is required for early post-implantation growth and axial organization. Genes & Dev. 1994;8:3045–3058. doi: 10.1101/gad.8.24.3045. [DOI] [PubMed] [Google Scholar]
- Deng C, Wynshaw-Boris A, Kuo A, Zhou F, Leder P. Fibroblast growth factor-3 is a negative regulator of bone growth and development. Cell. 1996;84:911–921. doi: 10.1016/s0092-8674(00)81069-7. [DOI] [PubMed] [Google Scholar]
- Dobyns WB. Developmental aspects of lissencephaly and the lissencephaly syndromes. In: Gilbert EF, Opitz JM, editors. Genetic aspects of developmental pathology. New York, NY: Alan R. Liss; 1987. pp. 225–241. [Google Scholar]
- Dobyns WB, Elias ER, Newlin AC, Pagon RA, Ledbetter DH. Casual heterogeneity in isolated lissencephaly. Neurology. 1992;42:1375–1388. doi: 10.1212/wnl.42.7.1375. [DOI] [PubMed] [Google Scholar]
- Dobyns WB, Reiner O, Carrozzo R, Ledbetter DH. Lissencephaly, a human brain malformation associated with deletion of the LIS1 gene located at chromosome 17p13. J Am Med Assoc. 1993;270:2838–2842. doi: 10.1001/jama.270.23.2838. [DOI] [PubMed] [Google Scholar]
- Gimble FS, Thorner J. Homing of DNA endonuclease gene by meiotic gene conversion in Saccharomyces cerevisiae. Nature. 1992;357:301–306. doi: 10.1038/357301a0. [DOI] [PubMed] [Google Scholar]
- Haaf T, Ward DC. High resolution ordering of YAC contigs using extended chromatin and chromosomes. Hum Mol Genet. 1994a;3:629–633. doi: 10.1093/hmg/3.4.629. [DOI] [PubMed] [Google Scholar]
- ————— Structural analysis of alpha–satellite DNA and centromere proteins using extended chromatin and chromosomes. Hum Mol Genet. 1994b;3:697–709. doi: 10.1093/hmg/3.5.697. [DOI] [PubMed] [Google Scholar]
- Hattori M, Adachi H, Tsujimoto M, Arai H, Inoue K. Miller–Dieker lissencephaly gene encodes a subunit of brain platelet-activating factor. Nature. 1994;370:216–218. doi: 10.1038/370216a0. [DOI] [PubMed] [Google Scholar]
- Hurlin P, Queva C, Eisenman RN. Mnt, a novel Max-interacting protein is coexpressed with Myc in proliferating cells and mediates repression at Myc binding sites. Genes & Dev. 1997;11:44–58. doi: 10.1101/gad.11.1.44. [DOI] [PubMed] [Google Scholar]
- Ledbetter DH, Ballabio A. Molecular cytogenetics of contiguous gene syndrome: Mechanisms and consequences of gene dosage imbalance. In: Scriver C, Beudet AL, Sly WS, Valle D, editors. The metabolic basis of inherited disease. New York, NY: McGraw–Hill; 1995. pp. 881–839. [Google Scholar]
- Lewis BC, Shah NP, Braun BS, Denny CT. Creation of yeast artificial chromosome fragmentation vector based on lysine-2. Genet Anal Tech Appl. 1992;9:86–90. doi: 10.1016/1050-3862(92)90003-n. [DOI] [PubMed] [Google Scholar]
- LoNigro C, Chong SS, Smith AMC, Dobyns WB, Carrozzo R, Ledbetter DH. Point mutation and intragenic deletion in LIS1, the lissencephaly causative gene in isolated lissencephaly sequence and Miller–Dieker syndrome. Hum Mol Genet. 1997;6:157–164. doi: 10.1093/hmg/6.2.157. [DOI] [PubMed] [Google Scholar]
- McConnell JE, Armstrong JF, Hodges PE, Bard JB. The mouse 14–3–3 epsilon isoform, a kinase regulator whose expression pattern is modulated in mesenchyme and neural differentiation. Dev Biol. 1995;168:218–228. doi: 10.1006/dbio.1995.1139. [DOI] [PubMed] [Google Scholar]
- McDonald JD, Daneshvar L, Willert JR, Matsumura K, Waldman F, Cogen PH. Physical mapping of chromosome 17p13.3 in the region of a putative tumor suppressor gene important in medulloblastoma. Genomics. 1994;23:229–232. doi: 10.1006/geno.1994.1481. [DOI] [PubMed] [Google Scholar]
- Meroni, G., A. Reymond, M. Alcalay, G. Borsani, A. Tanigami, R. Tonlorenzi, C. Lo Nigro, S. Messali, M. Zollo, D.H. Ledbetter, R. Brent, A. Ballabio, and R. Carrozzo. 1997. Rox: A novel bHLHZip protein expressed in quiescent cells that heterodimerizes with Max, binds a non-canonical “E-box,” and acts as a transcriptional repressor. EMBO J. (in press). [DOI] [PMC free article] [PubMed]
- Pavan WJ, Hieter P, Reeves RH. Generation of deletion derivatives by targeted transformation of human-derived yeast artificial chromosomes. Proc Natl Acad Sci. 1990;87:1300–1304. doi: 10.1073/pnas.87.4.1300. [DOI] [PMC free article] [PubMed] [Google Scholar]
- Peterfy M, Gyuris T, Basu R, Takacs L. Lissencephaly-1 is one of the most conserved proteins between mouse and human: A single amino-acid difference in 410 residues. Gene. 1994;150:415–416. doi: 10.1016/0378-1119(94)90468-5. [DOI] [PubMed] [Google Scholar]
- Phillips N, Ziegler M, Saha B, Xynos F. Allelic loss on chromosome 17 in human ovarian cancer. Int J Cancer. 1993;54:85–91. doi: 10.1002/ijc.2910540115. [DOI] [PubMed] [Google Scholar]
- Pinkel D, Straune T, Gray JW. Cytogenetic analysis using quantitative, high sensitivity, fluorescence hybridization. Proc Natl Acad Sci. 1986;83:2934–2938. doi: 10.1073/pnas.83.9.2934. [DOI] [PMC free article] [PubMed] [Google Scholar]
- Reiner O, Carrozzo R, Shen Y, Wehnert M, Faustinella F, Dobyns WB, Caskey T, Ledbetter DH. Isolation of a Miller–Dieker lissencephaly gene containing G protein β-subunit-like repeats. Nature. 1993;364:717–721. doi: 10.1038/364717a0. [DOI] [PubMed] [Google Scholar]
- Reiner O, Albrecht U, Gordon M, Chianoso KA, Wong C, Gai-Gorber O, Sapir T, Siracusa LD, Buchberg AM, Caskey CT, Eichele G. Lissencephaly gene (LIS1) expression in the CNS suggests a role in neuronal migration. J Neurosci. 1995;15:3730–3738. doi: 10.1523/JNEUROSCI.15-05-03730.1995. [DOI] [PMC free article] [PubMed] [Google Scholar]
- Robbins CM, Hsu E, Gillevet P. Sequencing homopolymer tracts and repetitive elements. BioTechniques. 1996;20:862–868. doi: 10.2144/96205st06. [DOI] [PubMed] [Google Scholar]
- Sambrook J, Fritsch EF, Maniatis T. Molecular cloning: A laboratory manual. 2nd ed. Cold Spring Harbor, NY: Cold Spring Harbor Laboratory Press; 1989. [Google Scholar]
- Schröck E, Badger P, Larson D, Erdos M, Wynshaw-Boris A, Ried T, Brody L. The murine homolog of the human breast and ovary cancer susceptibility gene Brca1 maps to mouse chromosome 11D. Hum Genet. 1996;97:256–259. doi: 10.1007/BF02265277. [DOI] [PubMed] [Google Scholar]
- Smith CL, Klco SR, Cantor CR. Pulsed–field gel electrophoresis and the technology of large DNA molecules. In: Davies KE, editor. Genome analysis: A practical approach. Oxford, UK: IRL Press; 1988. pp. 41–72. [Google Scholar]
- Tybulewicz VL, Crawford CE, Jackson PK, Bronson RT, Mulligan RC. Neonatal lethality and lymphopenia in mice with a homozygous disruption of the c-abl proto-oncogene. Cell. 1991;65:1153–1163. doi: 10.1016/0092-8674(91)90011-m. [DOI] [PubMed] [Google Scholar]