Abstract
As the rate of DNA sequencing increases, analysis by sequence similarity search will need to become much more efficient in terms of sensitivity, specificity, automation potential, and consistency in annotation. PowerBLAST was developed, in part, to address these problems. PowerBLAST includes a number of options for masking repetitive elements and low complexity subsequences. It also has the capacity to restrict the search to any level of NCBI’s taxonomy index, thus supporting “comparative genomics” applications. Postprocessing of the BLAST output using the SIM series of algorithms produces optimal, gapped alignments, and multiple alignments when a region of the query sequence matches multiple database sequences. PowerBLAST is capable of processing sequences of any length because it divides long query sequences into overlapping fragments and then merges the results after searching. The results may be viewed graphically, as a textual representation, or as an HTML page with links to GenBank and Entrez. For matching database sequences, annotated features are superimposed on the aligned query sequence in the output, thus greatly increasing the ease of interpretation. Such features may be used for automated annotation of new sequence because PowerBLAST output in ASN.1 form may be “dragged and dropped” into NCBI’s Sequin program for sequence annotation and submission. PowerBLAST is capable of analyzing and annotating a 100-kb query in 60 min on NCBI’s BLAST server.
[THC BLAST is available at http://www.ncbi.nlm.nih.gov/cgi-bin/THCBlast/nph-thcblast]
Recent advances in large-scale genomic sequencing require more powerful tools for sequence analysis and interpretation. Database similarity search programs, such as BLAST (Altschul et al. 1990), are very effective and reliable computational tools for exon identification and gene prediction. But the rapidly growing number of sequences in GenBank, as well as the size and complexity of genomic query sequences, have strained the capabilities of the traditional BLAST search interface and network server. Some of the difficulties are as follows: (1) The presence of repetitive elements in the query greatly complicates interpretation; (2) large query sequences exceed practical memory limitations imposed by the BLAST server; (3) GenBank now contains sequences from so many different organisms (∼18,000) that output can be extremely complex and/or redundant; (4) GenBank contains so many sequences (∼1,000,000) that “hit lists” are much too large for manual browsing; (5) truncated definition lines of matching database sequences can be ambiguous and uninformative; and (6) gapped alignments can be useful and have not been supported previously by National Center for Biotechnology Information (NCBI’s) BLAST server. Many of these problems have been recognized for some time (Altschul et al. 1994), and various solutions involving preprocessing of query or database sequences, and postprocessing of BLAST output have been crafted (Claverie and States 1993; Sonnhammer and Durbin 1994; Worley et al. 1995). However, these solutions may address only a subset of the problems, may not be sufficiently portable or efficient, or may be difficult to maintain, keep current, and support.
PowerBLAST was developed to meet the increasing demand for a more powerful tool that facilitates efficient and sophisticated analysis and automation of annotation. The program performs various types of query “masking” to reduce or eliminate spurious or misleading results. PowerBLAST postprocesses the BLAST search results to generate organism-specific results and more sensitive gapped alignments. It offers a flexible and convenient user interface that supports (1) batch submission of query sequences, (2) search against multiple databases, and (3) simultaneous searches with multiple BLAST programs (e.g., BLASTN, BLASTX). The results are displayed as multiple alignments with annotated features, derived from the GenBank records of matching sequences. All of the results may be viewed as text files in ASCII format or as web pages with HTML links to various database records. The results may also be exported to Chromoscope (Zhang et al. 1994), which is an interactive graphical viewer. PowerBLAST’s output may also be saved in NCBI’s ASN.1 format, thus making it file compatible with Sequin (J. Kans, unpubl.), a recently developed sequence annotation and GenBank submission tool.
SYSTEM
PowerBLAST can be executed using either a command line interface or a graphic user interface. It is a client–server program that requires network access to both the BLAST server (Madden et al. 1996) and Network Entrez Server (Schuler et al. 1996) at the NCBI. An experimental web interface has been implemented (http://www.ncbi.nlm.nih.gov/cgi-bin/THCBlast/nph-thcblast) for search against the THC (Tentative Human Consensus) sequences generated by The Institute for Genome Research. PowerBLAST is written in the C language using the NCBI toolkit (ftp ncbi.nlm.nih.gov) and is thus a portable program that runs on UNIX systems (SunOS/Solaris/SGI), as well as Apple Macintosh computers and Intel-compatible personal computers running the Windows NT or Windows 95 operating systems. It is available by anonymous ftp to ncbi.nlm.nih.gov at the pub/sim2 directory.
RESULTS
The results can be exported to the interactive browser Chromoscope, or formatted as ASCII files, or as HTML pages with links to GenBank, MEDLINE, and other components of Entrez for browsing via the World Wide Web. Both the text and graphical views display the results as multiple alignments. Annotated features on the matching sequences are superimposed on the alignments, and this greatly facilitates identification of functional domains in the query sequence. When analyzing a large genomic sequence, it is difficult to untangle the relationship of the various BLAST hits by browsing a large text. It is more informative to start with a high-level overview of the distribution of the BLAST hits and then zoom to the region of interest for detailed text view. The graphical browser Chromoscope starts with a global view that displays the entire query sequence, the repeat regions, and the hits from various BLAST programs, such as BLASTN and BLASTX (Fig. 1). BLAST hits are sorted by their locations within the query sequence to present a compact view of their clustering pattern. If a matching sequence aligns to more than one region in the query sequence, the regions will be labeled by a distinct color. This visual enhancement facilitates exon identification in a genomic sequence as the various regions aligned to the same transcript sequence or the same protein sequence indicate potential exons. The user can select any region of interest by “rubber-banding” with the mouse pointer to obtain a detailed graphic view that shows the locus names or accession numbers of the matching sequences, the orientation of the alignment, and detailed information about the alignment, such as the deletions, insertions, and substitutions (Figs. 2 and 3). Annotated features on the matching database sequences, such as genes, mRNAs and coding regions for DNA sequences, and active sites on protein sequences, are marked underneath the alignments so that the functionally important domains are directly associated with the sequence homology. Results from various BLAST programs, such as BLASTN and BLASTX, are displayed in the same view as separate groups. The combination of multiple BLAST searches gives a complete picture of the homology information in both the nucleotide and the protein databases, which can greatly accelerate the time-consuming process of piecing together all the available information to predict the biological functions of the query sequence. When there are hits from both the DNA and the protein databases in the same region, the consistency may confirm the significance of some weak matches. Repeat regions on both the query sequence and hit sequences are also marked so that spurious hits that match the unmasked residues at the end of a repeat region can be detected. Double-clicking will show the GenBank or the MEDLINE record of a matching sequence. Rubber-banding a region brings the text view of the alignments (Fig. 4). The variations between the query sequence and matching sequences can be identified easily with the multiple alignment display, and their biological implications can be assessed by analyzing their effect on the annotated features in the aligned sequences. In addition, PowerBLAST may also be used to assist positional cloning projects to identify the potential exons in the genomic sequences. One example is the recently cloned MEN1 gene (Chandrasekharappa et al. 1997), which causes multiple endocrine neoplasia, an autosomal dominant disorder characterized by a high frequency of primary endocrine abnormalities involving hyperactivity, and tumors of the pituitary, parathyroid, and pancreas. Compared with the full-length cDNA sequencing, the combined results from mouse and human expressed sequence tag (EST) hits confirm 9 of 10 exons in the gene and suggest a potential antisense transcription on the genomic sequence (Fig. 3).
Figure 1.
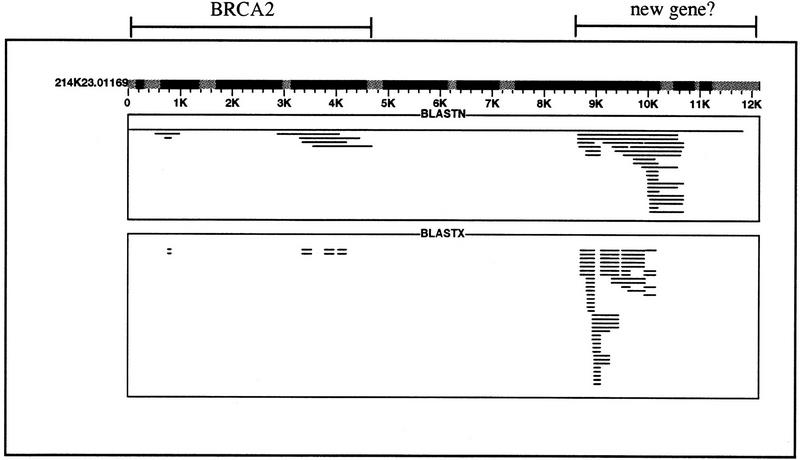
Global view of the PowerBLAST results in Chromoscope. The query sequence 214K23.01169 is a P1-derived artificial chromosome (PAC) clone in the 900-kb region of human chromosome 13 that contains the BRCA2 gene. The sequence was obtained from the web site of the Washington University Genome Sequencing Center (http://genome.wustl.edu) and at the time of retrieval these data were in “phase 2” of finishing. The shaded regions in the query sequence indicate the locations of repeat regions identified by PowerBLAST. The results from BLASTN and BLASTX are grouped into separate rectangles. Each line within the rectangle represents one alignment, and if parts of the matching sequence align to more than one region, the lines are shown in color (this situation occurs when an mRNA sequence is split into its component exons upon alignment with its gene). There are three clusters of alignments. The first is from 500 to 1000 nucleotides (between 0 and 1K on the scaled diagram), the second from ∼3K to 5K nucleotides, and the last from 8.5K to 11K nucleotides. In all of the regions, both BLASTN and BLASTX hits were found. The first and second cluster code for the last four exons of the BRCA2 gene (GenBank accession no. Z74739), whereas the third cluster shows high similarity to a 56-kD interferon-induced protein (SwissProt P09914) and its mRNA (GenBank accession no. M24594).
Figure 2.
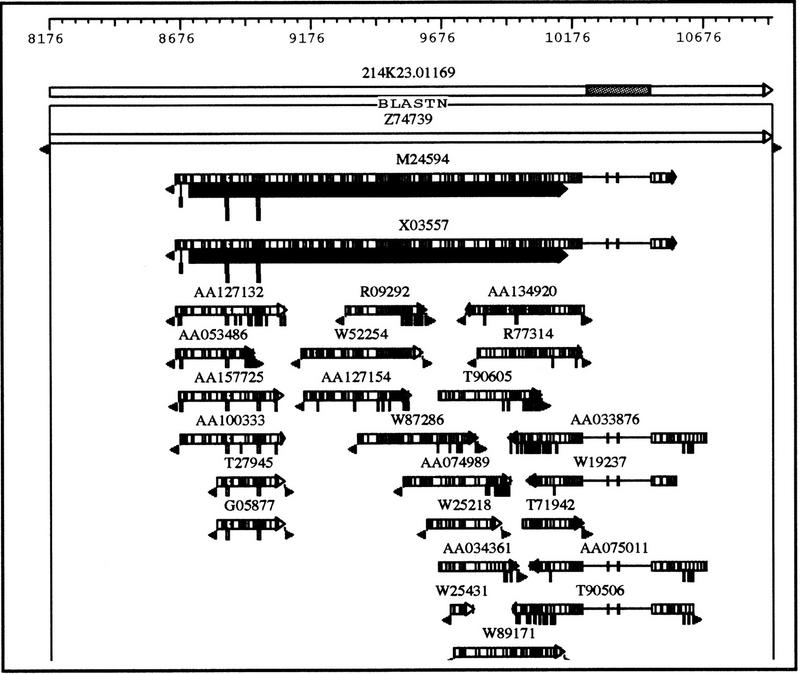
Detailed graphic view of the third alignment cluster in Fig. 1. The shaded area in the query sequence represents a repeat region. Each rectangle represents an alignment. The arrow at the end indicates the orientation of alignment. The numerous grey lines inside the rectangle represent mismatched residues compared with the query sequence. A gap in a matching sequence is represented by a single line connecting two adjacent rectangles, and an insertion is represented by a vertical bar connected to a rectangle that is proportional to the size of the insertion. The triangles at the end indicate unaligned ends, often seen in EST matches because of the degenerating data quality at the ends of the “single pass” sequence reads. The grey rectangles beneath the two mRNA sequences (GenBank accession nos. M24594 and X03557) show the coding region features in the aligned region.
Figure 3.
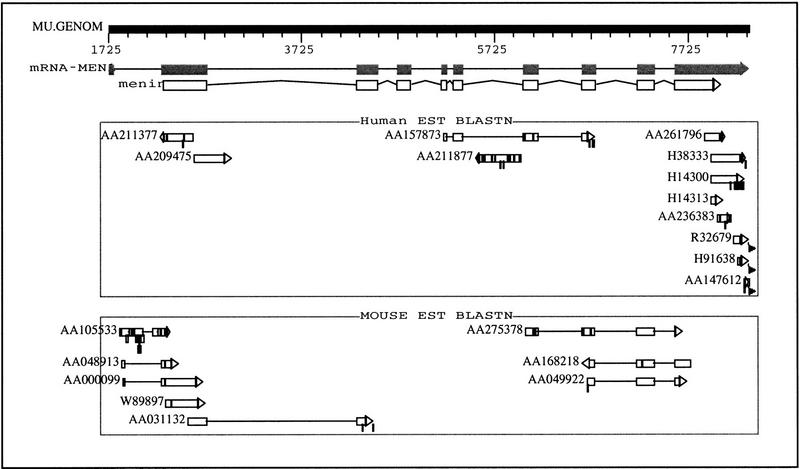
The graphic view of the multiple alignments for the MEN1 gene against mouse and human EST database. Annotated mRNA and coding features, shown as shaded and open boxes respectively, are labeled above the alignments. Each box represents an exon, and the mRNA sequence is made up of 10 exons. Exons 1,2,3,7,8,9, and 10 are confirmed by the mouse EST hits. Exons 2,5,6,7,8, and 10 are confirmed by the human EST hits. Combining the results from both the mouse and human database, only exon 4 is missing from the EST hits. Two human ESTs hits (GenBank accession nos. AA209475 and AA211877) are aligned to the intronic regions. They are the 5′ and 3′ ends of the same cDNA clone (648332) sequenced by the Washington University School of Medicine (St. Louis, MO). The alignments are in reverse orientation of the transcription, which suggests a potential antisense transcription of this gene.
Figure 4.
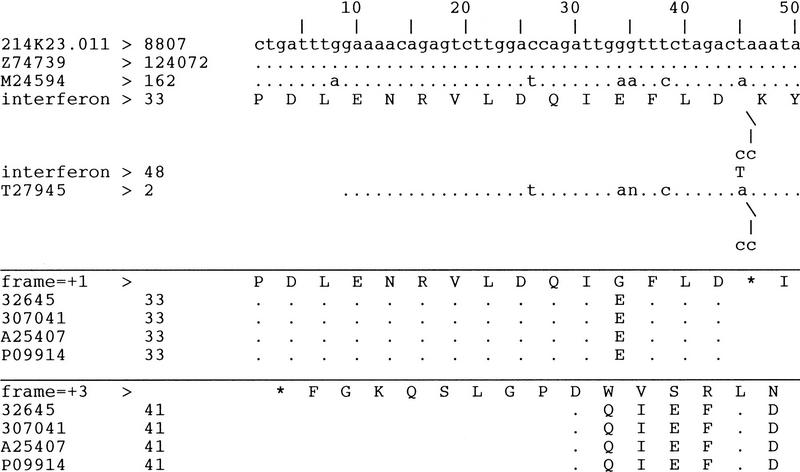
An abbreviated text view of the multiple alignments in Fig. 2. The results from BLASTN and BLASTX are separated into three panels. (Top) The results from BLASTN; (middle, bottom) the results from BLASTX with translation reading frames +1 and +3, respectively. Three BLASTN hits are displayed: the BRCA2 genomic sequence (GenBank accession no. Z74739); an mRNA sequence (GenBank accession no. M24594), which encodes a 56-kD interferon-induced protein; and an EST sequence (GenBank accession no. T27945). The results are displayed as multiple pairwise alignments to compare the sequence identity between the query sequence and the matching database sequences. The mismatched residues are displayed, whereas the identical residues are shown as dots. Gaps on the master sequence, i.e., the query sequence, are displayed as insertions in the matching sequences, e.g., at nucleotide 8852 of the query sequence, both M24594 and T27945 have the same 2-nucleotide insertion represented by
/ | cc In this region, the coding region feature on M24594 is represented by labeling each translated amino acid residue in the middle of the 3-base condon. The translated amino acid residue at the insertion are labeled as well. The > or the < symbol attached to a sequence label indicates the plus or minus orientation of the alignment; the > or < symbol at the end of the annotated coding region feature indicates the orientation of the transcription in relation to the orientation of the alignment. If a sequence or a feature label exceeds 12 characters, it will be truncated, such as the label for “interferon-induced protein,“ which was shortened to interferon. For BLASTX results, the conceptual transactions with the specified reading frames are displayed in the middle and bottom panels. The conceptual translation is compared with mathing sequences from the protein databases, and the identical residues are labeled as dots. In this view, all of the four protein sequences (GenBank accession nos. 32645, 307041, A25407, and P09914), align to the query sequence in both frames +1 and +3. The alignments for frame 1 translation stop at position 8852 on the query sequence, which corresponds to the 2-nucleotides gap in the query sequence. This gap also introduces a stop codon (represented by an asterisk, *) in the query sequence on the translation with frame = +1. Because the sequence variations are consistent in the alignments of the two transcript sequences as well as those of the protein sequences, the sequence homology suggests a pseudogene in this region.
DISCUSSION
The problems of processing large genomic sequences and summarizing voluminous BLAST textual output have been addressed previously by programs such as Blixem and MSPcrunch (Sonnhammer and Durbin 1994). These programs suppress spurious matches by restricting the number of matched sequences in a certain region, which has the advantage of retaining significant matches in the same region. However, this process requires long computing time for the BLAST search when there are numerous repetitive sequences present in the database. This computing time is likely to exceed the 2700-sec time limit currently imposed for individual searches on the NCBI BLAST server. In contrast, PowerBLAST preprocesses the query sequence by masking the repeat regions so that the public BLAST server will not waste time extending the high-scoring segment pairs (HSPs) of these noninformative hits. In addition, PowerBLAST provides a flexible user interface that allows the user to set up BLAST parameters, search a batch of query sequences, search against multiple databases with multiple BLAST programs, and run organism-specific searches.
One strategy for the integreation of biological information with BLAST alignments was implemented in the web-based program BEAUTY (Worley et al. 1995). BEAUTY searches against a preclustered local database file that has to be updated periodically in a rather complex scheme. PowerBLAST, however, takes the annotated features directly from GenBank and other centrally maintained public databases, which include EMBL, DDBJ, and SwissProt, and superimposes these annotations as features on the alignments, making the entire process more direct. This strategy also has the advantage of being able to utilize the latest information in the public database without having to rely on the update cycle of large and ever-expanding local database search files.
Some of the features of PowerBLAST, such as organism-specific searches and the display of annotated features together with alignments, are made possible through real-time communications with the Entrez Network Server. This design characteristic will allow future versions of PowerBLAST to adopt the full capability of Entrez’s BOOLEAN query facilities so that additional specilized BLAST searches can be performed. For example, PowerBLAST could be parameterized to report only new information, for example, matches to GenBank sequences that were released only after the last search was performed. However, network traffic may restrain the performance of PowerBLAST. A new version is in development that does not require access to Entrez Network Server and Network Blast Server. Once completed, it will also be possible to search against a local database. PowerBLAST can be used in concert with the Sequin program for sequence annotation and GenBank/EMBL submission. PowerBLAST output (in ASN.1 form) can be imported into Sequin for direct submission to GenBank. If human genomic sequencing capacity does achieve the 100 Mb per year anticipated in 1998, PowerBLAST can be envisioned as the basis of a noninteractive system to provide initial baseline annotation of genomic sequence data as well as automated periodic updates.
METHODS
Figure 5 illustrates the data processes in PowerBLAST. Both the BLAST search and Entrez access require connections to the servers at NCBI; all of the other processes are computed on the client machine. Prior to the BLAST search, SIM2 (Chao et al. 1994) computes repeat regions in the query sequence, and the results are automatically annotated as repeat features in the query sequence. For a DNA query sequence, the low complexity regions are identified by the “dust” program (J. Kuzio, R. Tatusov, and D.J. Lipman, unpubl.). These, together with the repeats, are masked in a copy of the query sequence, which is then sent to the BLAST server for the database search. Alternatively, a flag, −filter = seg, can be set in the BLAST search parameter to filter low complexity regions in a protein sequence with the “seg” program (Wootton and Federhen 1996). Four types of BLAST searches may be performed: BLASTN compares a nucleotide query to a nucleotide database; BLASTP compares a protein query to a protein database; BLASTX compares a translated nucleotide query to a protein database; and TBLASTN compares a protein query to a translated nucleotide database. Large sequences are split into overlapping pieces, and the results are merged at the end. An interface was developed to enable searches against multiple databases with multiple BLAST programs (Fig. 6). Organism-specific results can be obtained at any level of the NCBI taxonomy by filtering the HSP alignments inclusively or exclusively with Etrez Taxonomy Server. A suite of SIM algorithms, which include SIN (Huang et al. 1990), SIM2 (Chao et al. 1994), and SIM3 (Chao et al. 1997) may be selected to compute more refined gapped alignments. The details of repeat filtering, processing of large sequences, restricting the search by organism, and gapped alignments are described below.
Figure 5.
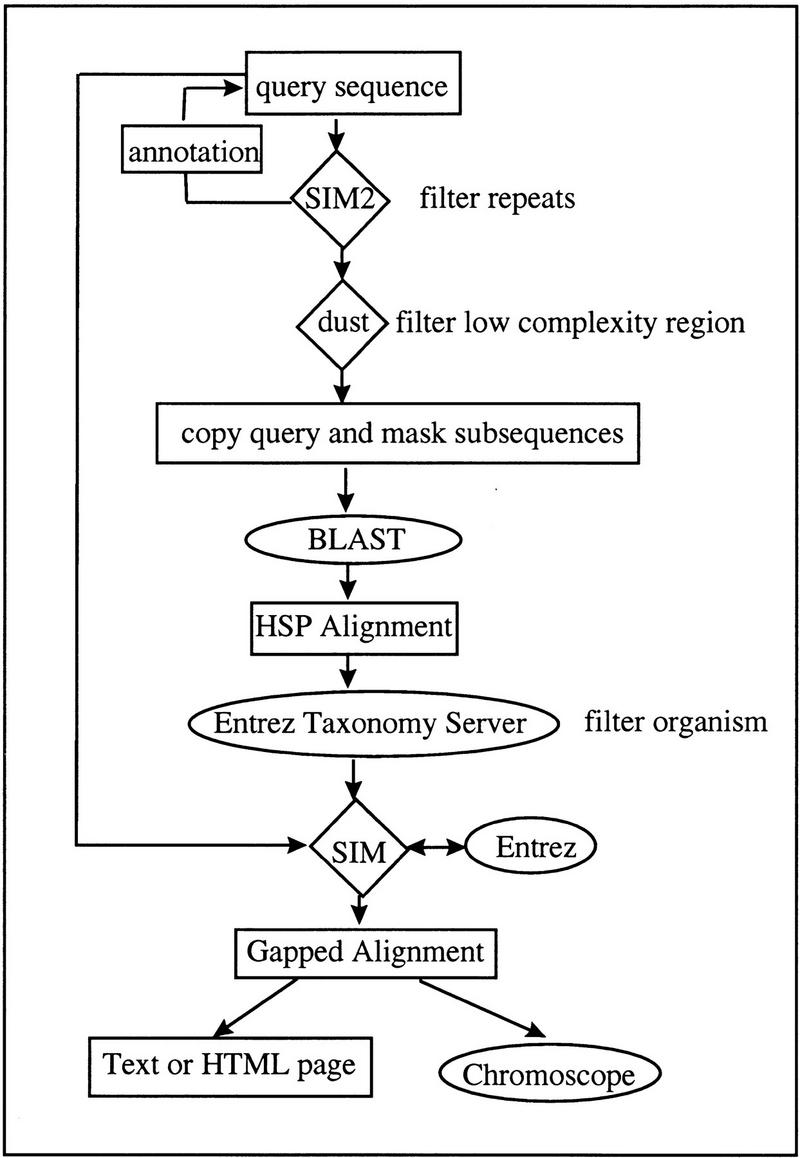
Overview of data processes in PowerBLAST. Applications that require network connections, such as the BLAST and Entrez servers, are enclosed by ovals. The applications that run on the client machine (e.g., SIM, dust) are enclosed by diamonds. Program imput/output is enclosed by rectangles.
Figure 6.
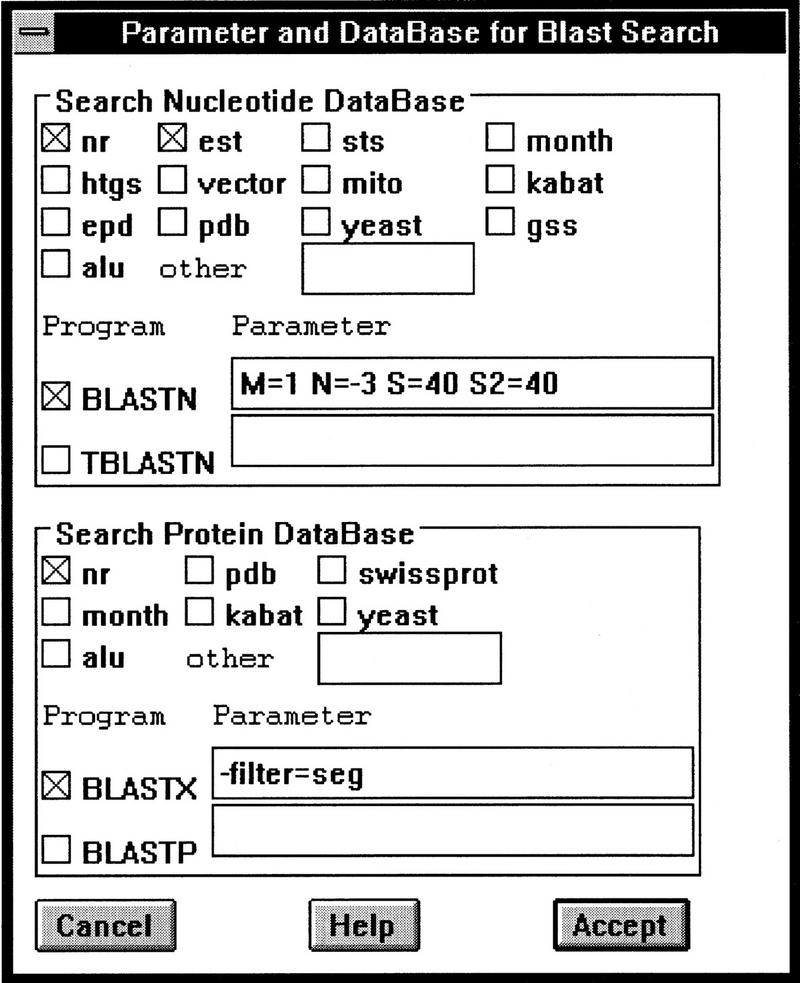
The graphic interface for setting up options of searching against multiple databases with multiple BLAST programs. The settings shown specify a BLASTN search against both the nr (the non-redundant database) and the est database with the parameters M = 1 N = −3 S = 40 S2 = 40; and a BLASTX search against the nr database with the query sequence masked for low complexity using the paramer −filter = seg.
Filtering Repeat Regions
To identify repeat regions in the query sequence, PowerBLAST uses the SIM2 algorithm to compute the top n nonintersecting gapped alignments between the query sequence and repeat sequences in a user-supplied FASTA library file. A sample file for human repeat seqeunces, humrep (W. Makalowski, unpubl.), is included in the package. The repeat regions are computed on the client machine, and the user can substitute the humrep file with repeats from other organisms if the query is not a human sequence. To reduce false-positive and false-negative results, various parameters were tested in an experiment that compares the Alu repeats identified by SIM2 with the annotations in the public records (W. Makalowski and J. Zhang, unpubl.), and the optimal choice is the combination of scores ⩾20 and sequence identity >65%. The end points of the alignments are taken as repeat regions, and if there are tandem repeats of the same repeat element, the leftmost and rightmost positions will be recorded as the end points of a single repeat region. The repeat regions will also be annotated automatically as features on the query sequence. Because repeat features are derived from the gapped alignments, the query sequence will be broken into overlapping pieces if its length exceeds 10,000 nucleotides because it is faster to compute alignments multiple times than to process the whole sequence at one time. Alternatively, PowerBLAST can mask the repeats computed by other external methods, such as the popular RepeatMasker program (Smit 1996), if repeat features were annotated on the query sequence with the NCBI sequence submission tool Sequin.
Processing of Long Genomic Sequences
Because the memory and central processing unit (CPU) time requirements vary with the type of BLAST program as well as the composition and length of the query, PowerBLAST uses an empirically derived maximum search size for each BLAST program. For BLASTN, the maximum size is 8000 nucleotides; for BLASTP, it is 4000 amino acid residues; for BLASTX, it is 3000 nucleotides; and for TBLASTN, it is 2000 residues. If the query sequence exceeds the threshold, it is broken into overlapping pieces and each piece is submitted as a separate query to the Network BLAST server. For a DNA sequence, the length of overlap is 1000 nucleotides; for a protein sequence, the overlap is set to be 100 amino acid residues. When the entire sequence is processed, HSPs from the same matching sequence are sorted by locations. If two neighboring HSPs overlap and cover the same diagonal, they will be merged into a larger HSP. The statistics of the merged HSP are not recalculated. The merged HSP takes the values from the HSP that has a higher score to maintain its rank in the output list.
Restricting the Search by Organism
PowerBLAST employs two strategies for organism filtering to achieve the most efficient network communication with Entrez Taxonomy Server. If the selected organism has <1000 records in the public databases, all the IDs are loaded in memory. The BLAST hits will be compared locally with the list of the IDs. Otherwise, the IDs of the matching sequences will be sent over the network to Entrez server for evaluation. The user may choose either to include or exclude a certain taxonomy class.
Gapped Alignments
Three algorithms, SIM, SIM2, SIM3, can be selected to compute gapped alignments between the query sequence and the database matches. The original unmasked query sequence is used as the input to the SIM programs to ensure that the repeat regions are included in the alignments. SIM is a space-efficient algorithm that generates the top n nonintersecting Smith–Waterman alignments between DNA and DNA or protein and protein sequences (Huang et al. 1990). However, it may be too slow for long sequences. SIM2 (Chao et al. 1994) and SIM3 (Chao et al. 1997) are much faster than SIM, but they only compute DNA to DNA alignments. SIM2 improves the speed by first constructing the n best nonintersecting chains of “fragments”. It then applies the traditional dynamic programming algorithm to compute an optimal gapped alignment in a region delimited by the chain. SIM3 computes global alignments for sequences that have high similarity; it can be used only when a high cutoff score is set for the BLAST search. HSPs from a BLAST search supply the orientation and approximate range as input to the SIM programs so that the computation is much more efficient than aligning the entire sequences. Matches are sorted by location, and the gaps between the neighboring HSPs are analyzed to determine whether more than one alignment needs to be computed because a large gap may impose a heavy penalty that terminates the alignment. The threshold for gap size is set to be 200 residues, with the default setting of the SIM programs. The ends of the HSPs are extended (1000 nucleotides for DNA sequences, 100 amino acids for protein sequences) so that the SIM programs will be able to compute more accurate end points.
Acknowledgments
We thank Dr. Mark Boguski for encouragement and helpful suggestions on the manuscript. We thank Drs. David Lipman and Jim Ostell for critical readings of the manuscript.
The publication costs of this article were defrayed in part by payment of page charges. This article must therefore be hereby marked “advertisement” in accordance with 18 USC section 1734 solely to indicate this fact.
Footnotes
E-MAIL zjing@ncbi.nlm.nih.gov; FAX (301) 480-9241.
REFERENCES
- Altschul SF, Gish W, Miller W, Myers EW, Lipman DJ. Basic local alignment search tool. J Mol Biol. 1990;215:403–410. doi: 10.1016/S0022-2836(05)80360-2. [DOI] [PubMed] [Google Scholar]
- Altschul SF, Boguski MS, Wootton JC. Issues in searching molecular sequence databases. Nature Genet. 1994;6:119–129. doi: 10.1038/ng0294-119. [DOI] [PubMed] [Google Scholar]
- Chao K-M, Zhang J, Ostell J, Miller W. A local alignment tool for very long DNA sequences. Comput Applic Biosci. 1994;11:147–153. doi: 10.1093/bioinformatics/11.2.147. [DOI] [PubMed] [Google Scholar]
- Chao K-M, Zhang J, Ostell J, Miller W. A tool for aligning very similar DNA sequences. Comput Applic Biosci. 1997;13:75–80. doi: 10.1093/bioinformatics/13.1.75. [DOI] [PubMed] [Google Scholar]
- Chandrasekharappa SC, Guru SC, Manickam P, Olufemi S, Collins FS, Emmert-Buck MR, Debelenko LV, Zhuang Z, Lubensky IA, Liotta LA, Crabtree JS, Wang Y, Roe BA, Weisemann J, Boguski MS, Agarwal SK, Kester MB, Kim YS, Heppner C, Dong Q, Spiegel AM, Burns AL, Marx SJ. Positional cloning of the gene for multiple endocrine neoplasia-type 1. Science. 1997;276:404–407. doi: 10.1126/science.276.5311.404. [DOI] [PubMed] [Google Scholar]
- Claverie JM, States DJ. Information enhancement methods for large scale sequence analysis. Comput Chem. 1993;17:191–201. [Google Scholar]
- Huang X, Hardison RC, Miller W. A space-efficient algorithm for local similarities. Comput Applic Biosci. 1990;6:373–381. doi: 10.1093/bioinformatics/6.4.373. [DOI] [PubMed] [Google Scholar]
- Madden TL, Tatusov RL, Zhang J. Applications of Network BLAST Server. Methods Enzymol. 1996;266:131–141. doi: 10.1016/s0076-6879(96)66011-x. [DOI] [PubMed] [Google Scholar]
- Schuler GD, Epstein JA, Ohkawa H, Kans JA. Entrez: Molecular biology database and retrieval system. Methods Enzymol. 1996;266:141–162. doi: 10.1016/s0076-6879(96)66012-1. [DOI] [PubMed] [Google Scholar]
- Smit AFA. Origin of interpersed repeats in the human genome. Curr Opin Genet Dev. 1996;6:743–749. doi: 10.1016/s0959-437x(96)80030-x. [DOI] [PubMed] [Google Scholar]
- Sonnhammer ELL, Durbin R. A workbench for large scale sequence homology analysis. Comput Applic Biosci. 1994;10:301–307. doi: 10.1093/bioinformatics/10.3.301. [DOI] [PubMed] [Google Scholar]
- Wootton JC, Federhen S. Analysis of compositionally biased regions in sequence databases. Methods Enzymol. 1996;266:554–571. doi: 10.1016/s0076-6879(96)66035-2. [DOI] [PubMed] [Google Scholar]
- Worley KC, Wiese BA, Smith RF. BEAUTY: An enhanced BLAST-based search tool that integrates multiple biological information resources into sequence similarity search results. Genome Res. 1995;5:173–184. doi: 10.1101/gr.5.2.173. [DOI] [PubMed] [Google Scholar]
- Zhang J, Ostell J, Rudd KE. Proceedings of the Twenty-Seventh Annual Hawaii International Conference on System Sciences. Vol. 5. Los Alamitos, CA: IEEE Computer Society Press; 1994. ChromoScope: A graphic interactive browser for E. coli data expressed in the NCBI data model; pp. 58–67. [Google Scholar]


