Abstract
We have assembled a first-generation anchor map of the mouse genome using a panel of 94 whole-genome–radiation hybrids (WG–RHs) and 271 sequence-tagged sites (STSs). This is the first genome-wide RH anchor map of a model organism. All of the STSs have been previously localized on the genetic map and are located 8.8 Mb apart on average. This mouse WG–RH panel, known as T31, has an average retention frequency of 27.6% and an estimated potential resolution of 145 kb, making it a powerful resource for efficient large-scale expressed sequence tag mapping.
[All of the mapping data for the maps presented here have been deposited at the Research Genetics, Inc., web site and can be freely accessed and downloaded at http://www.resgen.com/.]
Mouse genetics is one of the most powerful systems for the study of many aspects of vertebrate biology, including development, physiology, and pathobiology. The mouse is particularly important for studying genetics, and there are numerous mouse models of human disease (Cecchi and Avner 1996; Kleyn et al. 1996; Lee et al. 1996; Newton et al. 1996; Shiels and Bassnett 1996; Yamaki et al. 1996; Antoch et al. 1997). High-density genome maps are needed to fully exploit the potential of these mouse models.
High-resolution mapping tools are essential to facilitate high-density genome mapping. Genetic crosses and clone libraries of yeast, bacterial, and P1-derived artificial chromosomes, respectively (YACs, BACs, PACs), and cosmids all offer routes to high-resolution maps but require screening thousands of individuals in the case of genetic mapping and at least tens of thousands of clones for physical map generation. Because we expect genes to be spaced at 40-kb intervals on average, the ideal mapping tool should offer this level of resolution combined with the capacity to map both polymorphic and nonpolymorphic markers by screening a minimal number of clones or individuals.
Whole genome radiation hybrid (WG–RH) mapping meets all of these criteria. WG–RH panels consisting of <100 hybrids can offer very high resolution, allowing long-range genomic map generation by screening a single 96-well microtiter plate of hybrid DNAs (Walter et al. 1994; Hudson et al. 1995; Gyapay et al. 1996; Schuler et al. 1996; Stewart et al. 1997). Because the donor genome is retained on a background of chromosomes from another species, nonpolymorphic markers are often informative, making it particularly useful for anchoring clone contigs, which frequently do not contain polymorphic markers. Apart from the efficiency of RH mapping as a stand-alone mapping tool, an additional strength of this technique lies in the ability to integrate physical and genetic maps, by facilitating the resolution of cosegregating genetic markers lying in recombination cool spots on the meiotic map, and anchoring YAC contigs to the genome map. WG–RH mapping has been reviewed extensively elsewhere (Walter and Goodfellow 1993; Leach and O’Connell 1995; McCarthy 1996).
The technology for physical map generation using irradiation and fusion gene transfer (IFGT) was first developed by Goss and Harris (1975). This technique was rarely used until advances in molecular genetics allowed efficient PCR screening of the RH panels. WG–RH mapping was revived by Walter et al. (1994). Using a panel of 44 WG–RHs, an ordered map of the long arm of chromosome 14 was generated containing 40 markers, with 5 gaps in the map. These data suggested that a single panel of 100 hybrids could be used to generate a high-resolution WG–RH map.
Recently, several WG–RH maps of the human genome (Hudson et al. 1995; Gyapay et al. 1996; Stewart et al. 1997) have been published. A consortium is currently localizing thousands of expressed sequence tags (ESTs) on the human genome map using RH mapping and integrating these data with the physical map using the CEPH YAC library (Schuler et al. 1996). Data from the GB4 (Gyapay et al. 1996) and G3 (Stewart et al. 1997) WG–RH panels are being integrated to generate this map. To date, >16,000 human cDNAs have been mapped by Schuler et al. (1996).
The successful WG–RH mapping of the human genome has led the way to WG–RH mapping of model organism genomes. Schmitt et al. (1996) demonstrated the feasability of WG–RH mapping in the mouse, by making a WG–RH map containing 14 markers of a 14-cM region of mouse chromosome 11. This has been followed by a WG–RH map of baboon chromosome 13p and 13q (D. Spillett and P. Hayes, unpubl.).
The Schmitt et al. (1996) mouse WG–RH panel had an estimated average retention frequency of 18.5%, suggesting that it would be a less than optimal resource for whole genome mapping. This is supported by the fact that the human G3 panel with a 15% retention rate contains gaps in the genome map (P. Deloukas, pers. comm.) that are spanned by the Genebridge4 panel with a retention rate of 33% (Schuler et al. 1996). For this reason, the T31 panel was generated with the objective of creating a mouse WG–RH panel with a high retention of donor DNA for optimal mapping, which could be used for large-scale EST mapping of the mouse genome.
RESULTS
Three hundred hybrids from the T31 fusion were initially grown on a small scale to test for mouse DNA content. These hybrids were PCR screened for the presence of 30 microsatellite markers located in noncentromeric positions across the genome. The average retention rate of the panel at this preliminary stage was 24%. The object of this screen was to determine which hybrids were likely to retain a low mouse genome content and to omit these from further consideration. Not to bias the final panel in favor of those regions represented by the 30 markers, a subset of the remaining hybrids was selected randomly to constitute the final mapping panel. These were then grown on a large scale at Research Genetics to be made available to the scientific community. DNA from hybrids numbered 1 to 94 from this expansion were used to generate the data presented here.
To estimate the quantity of mouse DNA in the hybrids, total genomic mouse DNA was hybridized to metaphase spreads of hybrid chromosomes using fluorescence in situ hybridization (FISH) (Fig. 1). To prevent hybridization of the many repetitive sequences in common between mouse and hamster, the mouse DNA was prehybridized with mouse Cot-1 DNA. It was striking that most of the mouse DNA was not integrated into hamster chromosomes, but was maintained as independent recombinant mouse chomosomes in the hybrids.
Figure 1.
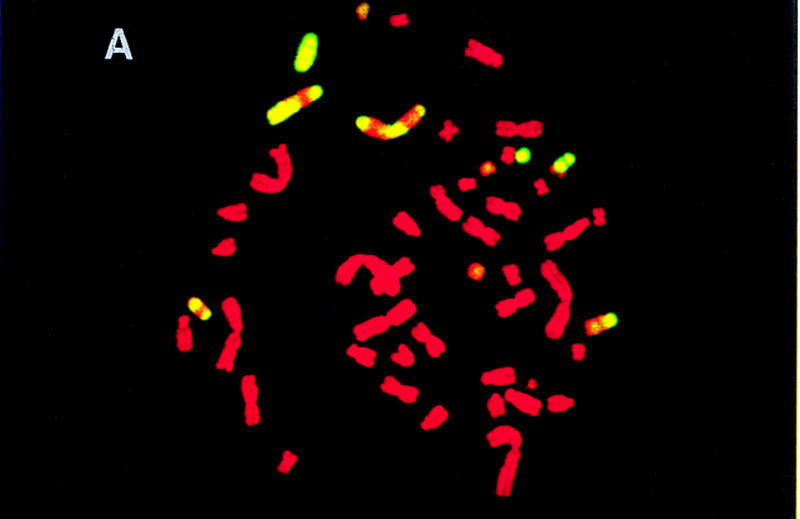
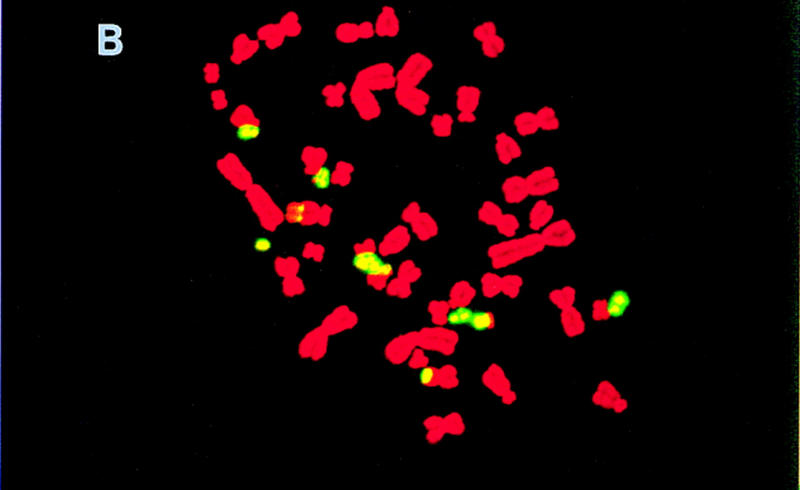
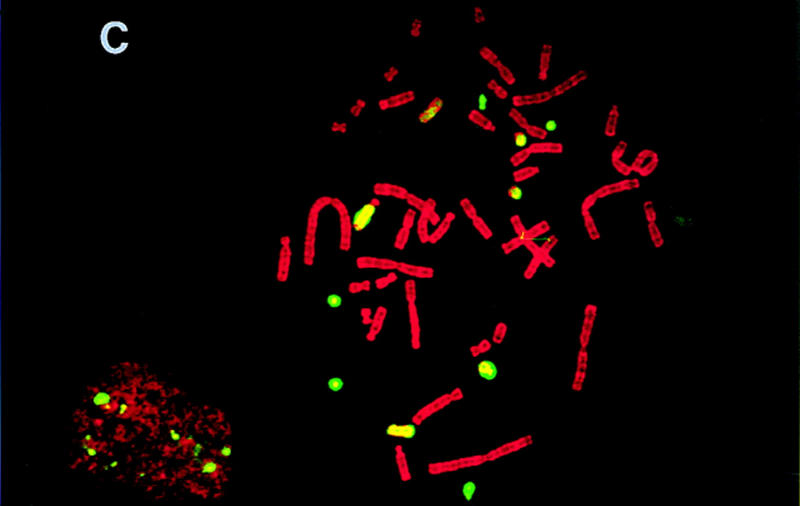
FISH of T31 hybrids. Shown are metaphase spreads of hybrids T31–3L7 (A), T31–2G3 (B), and T31–1O10 (C), respectively, hybridized with total genomic mouse DNA. The mouse DNA was prehybridized with mouse Cot-1 DNA to prevent hybridization of the many repetitive sequences in common between mouse and hamster.
Ninety-four hybrids were screened by PCR with 275 markers in duplicate, from all mouse chromosomes with the exception of Y. The PCR products were resolved on 3% agarose gels, and the results were entered manually into spreadsheet files before analysis using the RHMAP software package (Boehnke et al. 1991). The number of markers mapped to each chromosome varies from 10 to 26. The average retention frequency for the data set is 27.6%, with the frequency for individual chromosomes varying from 22% on chromosome 2 to 37% on chromosome 19. It has been observed in WG–RH panels that smaller chromosomes are generally retained at a higher rate. This trend is clear in the human WG–RH panels (Gyapay et al. 1996), where the difference in chromosome sizes is considerable. In the mouse, there is less difference between the sizes of the largest and smallest chromosomes, and this trend is less evident. The average retention frequency for each chromosome is shown graphically in Figure 2a. The variation in retention frequency for each marker across the genome is shown in Figure 2b. Markers D11Mit214 and D11Mit69, located near the selective marker TK, show a spike in retention frequency of 0.75 and 0.65, respectively. Because the selective marker must be retained in each hybrid for viability, the retention frequency would rise to 100% for the TK gene.
Figure 2.
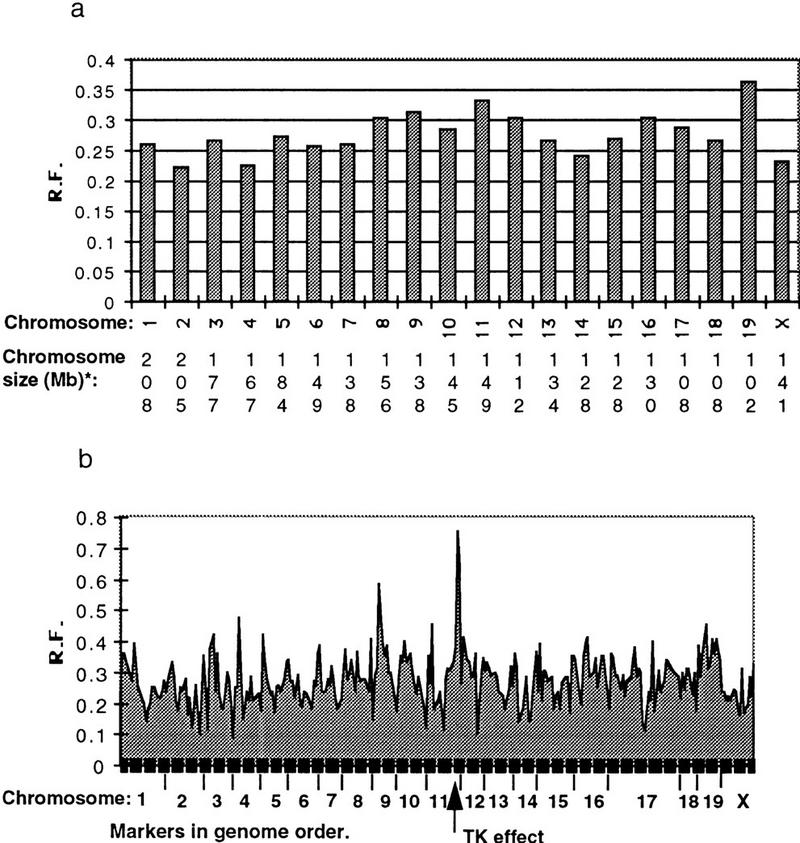
Marker retention across the genome. (a) Average retention frequency for each chromosome; (b) The retention frequency (R.F.) for each marker across the genome varies from 0.14 to 0.74. A spike in retention frequency can be observed in the markers flanking TK on chromosome 11. (*) Chromosome sizes obtained from Mouse Chromosome Committee reports: http://www.informatics.jax.org.
Twenty-six markers were used to assemble the chromosome 17 map (Fig. 3). The Whitehead (Dietrich et al. 1994) and European Collaborative Interspecific Backcross (EUCIB) (Breen et al. 1994) genetic maps are included in Figure 3 for comparison. These markers spanned a 47-cM region on the Whitehead genetic map and a 52-cM region on the EUCIB genetic map. Seventeen of these markers were located in the T complex, or proximal 15- to 20-cM region of the chromosome. Two-point analysis placed all 26 of the markers in a single linkage group of lod > 4.00. That is, each marker on the chromosome was linked to at least one other marker with a likelihood of >10,000:1. To assemble a high confidence map order using multipoint analysis, the markers were analyzed in two groups. Group 1 contained the 17 T-complex markers, and group 2 contained the nine markers spanning the distal portion of the map. The T-complex map contained six framework markers ordered with >1000:1 odds, five additional markers ordered with >100:1 odds, and seven markers ordered with <100:1 odds. The map length is 699.5 cR, and the best order is four times more likely than the next best order. Group 2 contains eight framework markers ordered with >1000:1 odds and one marker ordered with <100:1 odds. This map length is 395.3 cR, and the best order is 23.6 times more likely than the next best order. The RH map resolved 16 markers cosegregating to seven positions on the Whitehead genetic map and 4 markers cosegregating to two positions on the EUCIB genetic map. Markers D17Mit167 and D17Mit61 cosegregating at 11.55 cM on the EUCIB map are placed 45.4 cR3000 apart, and D17Mit22 and D17Mit16 cosegregating at 13.39 cM are placed 47.4 cR3000 apart. The EUCIB genetic map, generated using 1000 backcross progeny, has an average resolution of <0.1 cM, or 200 kb. Although this suggests that the T31 panel has a resolution higher than 200 kb, the four ancestral inversions in this region may have resulted in some recombination suppression in the T-complex portion of the EUCIB map. There is one difference between the marker orders of the RH map and the EUCIB genetic map. D17Mit167 is proximal to markers D17Mit61 and D17Mit228 on the RH map and distal to these markers on the EUCIB map. All three markers are unresolved on the Whitehead map.
Figure 3.
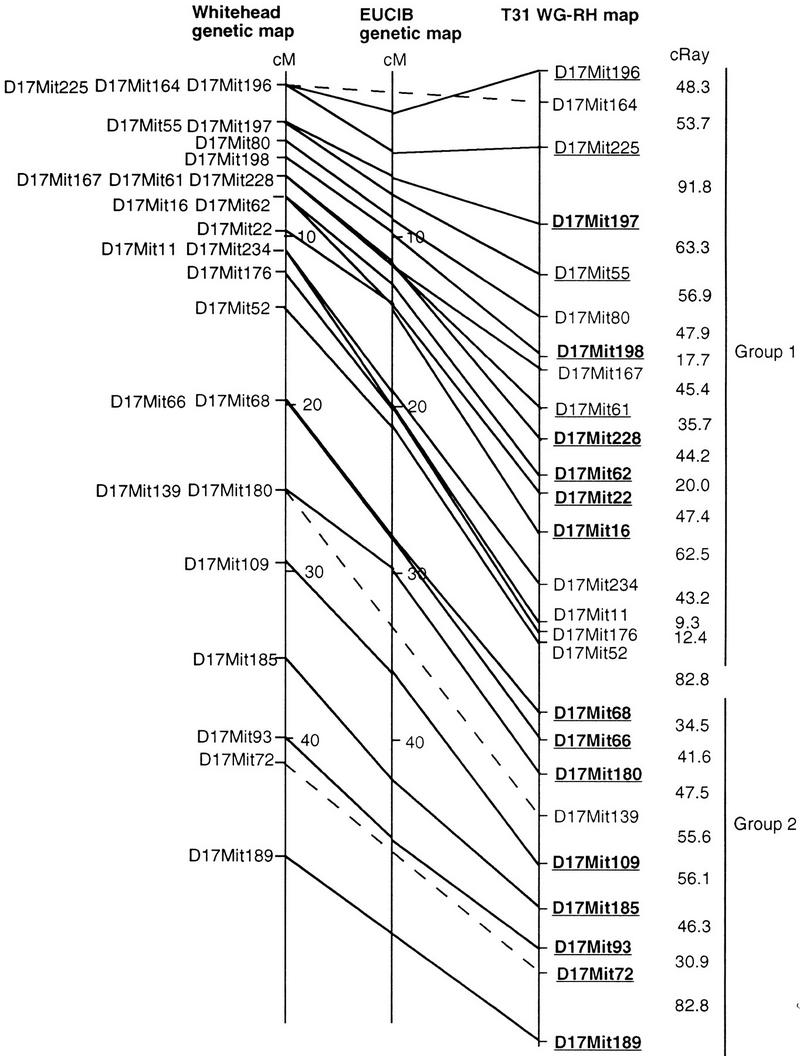
Chromosome 17 WG–RH map. The 26 markers were analyzed in two groups to generate a high confidence map. Framework markers ordered with >1000:1 odds are represented in bold and underlined. Markers ordered with >100:1 odds are underlined and in plain type. The 82.8 cR distance between the two map groups was derived by analysis of the data as a single set. The Whitehead and EUCIB genetic maps are included for comparison. Unbroken lines connect markers localized on all three maps. Broken lines connect markers placed on the Whitehead and T31 maps that are not localized on the EUCIB map.
The WG–RH anchor map is represented in Figure 4. This is not a framework map as the full set of markers for each chromosome are not ordered at >1000:1 odds. When all markers from across the genome were analyzed as a single file, some linkage groups supported by a lod score criteria of 3 < 4 contained markers from different chromosomes. Markers must contribute to a linkage group with a two-point lod score support of ⩾4 to assume linkage to this group of markers and not to others located on different chromosomes. Most of the chromosomal maps consist of more than one linkage group, within which the markers are well ordered relative to other markers within each group. These linkage groups are supported by a two-point lod score of >4, and the map within each linkage group was identified as the best order under multipoint analysis. Low statistical support for ordering between these linkage groups prevents their orientation relative to each other using only WG–RH data. Hence, we have oriented these linkage groups relative to each other using the genetic map. Large distances and gaps in the RH map are indicated by diagonal strokes. The marker orders on the WG–RH anchor map are consistent with those on the genetic map. The correlation between the genetic maps and WG–RH map can be observed for chromosome 17 in Figure 3. A summary of the genome anchor map statistics is provided in Table 1.
Figure 4.
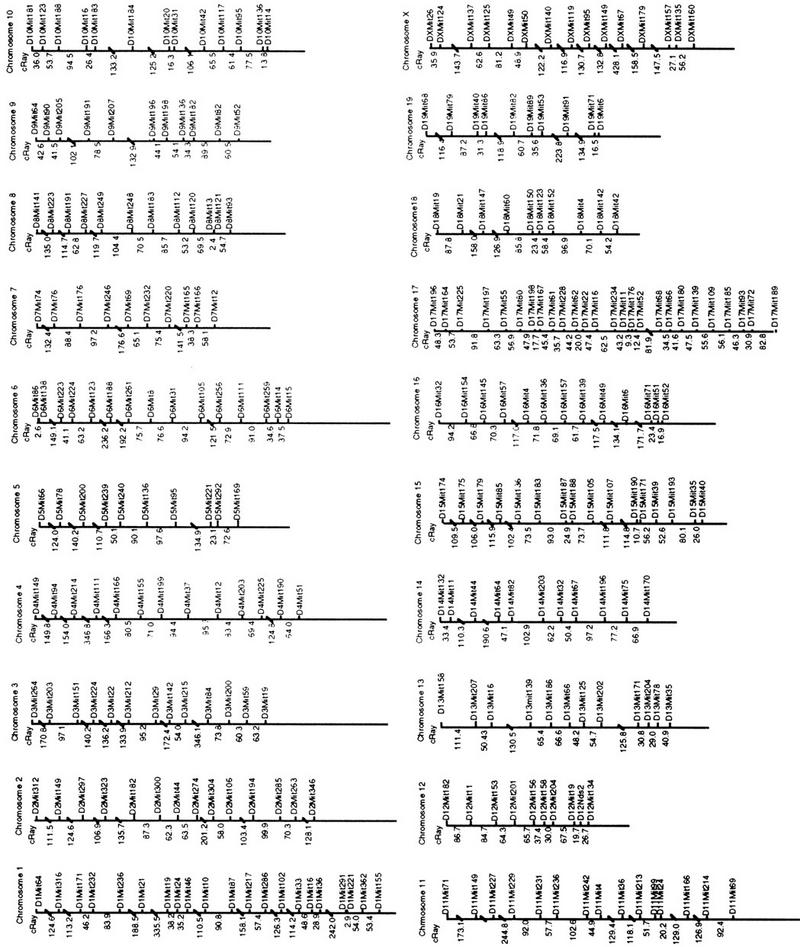
WG–RH anchor maps of the mouse genome. Most of the chromosomal maps consist of more than one linkage group. These linkage groups are supported by a two-point lod score of >4, and the map within each linkage group was identified as the best order using multipoint analysis. Low statistical support for ordering between these linkage groups prevents their orientation relative to each other. Because these groups could not be oriented relative to one another using only WG–RH data, the existing genetic map was used to position the marker groups separated by gaps in the RH map. Large distances and gaps in the RH map are indicated by diagonal strokes. The marker orders on the WG–RH anchor map are consistent with those on the genetic map.
Table 1.
T31 Anchor Map Statistics by Chromosome
| Chromosome | No. of markers | Genetic length (cM)a | RH map length (cR) | cR/cM | Retention |
|---|---|---|---|---|---|
| 1 | 21 | 110.4 | 1939.7 | 17.6 | 0.260 |
| 2 | 14 | 91.8 | 1352.7 | 14.7 | 0.221 |
| 3 | 13 | 66.7 | 1543.2 | 23.1 | 0.266 |
| 4 | 13 | 82.0 | 2629.7 | 32.0 | 0.224 |
| 5 | 10 | 82.0 | 843.2 | 10.3 | 0.273 |
| 6 | 15 | 66.7 | 1288.5 | 19.3 | 0.257 |
| 7 | 10 | 62.3 | 873 | 14.0 | 0.258 |
| 8 | 13 | 74.3 | 1004.8 | 13.5 | 0.304 |
| 9 | 11 | 69.9 | 680.2 | 9.7 | 0.311 |
| 10 | 13 | 69.9 | 809.6 | 11.6 | 0.285 |
| 11 | 15 | 83.1 | 2582.1 | 31.1 | 0.331 |
| 12 | 10 | 57.9 | 482.7 | 8.3 | 0.302 |
| 13 | 12 | 59.0 | 753.7 | 12.8 | 0.266 |
| 14 | 11 | 69.9 | 838.2 | 12.0 | 0.240 |
| 15 | 16 | 65.6 | 1155.6 | 17.6 | 0.268 |
| 16 | 13 | 51.4 | 1014.5 | 19.7 | 0.302 |
| 17 | 26 | 47.0 | 1177.6 | 25.0 | 0.289 |
| 18 | 10 | 37.2 | 762.2 | 20.5 | 0.267 |
| 19 | 10 | 57.9 | 825.9 | 14.3 | 0.364 |
| Χ | 15 | 57.9 | 1681.5 | 29.04 | 0.230 |
| Total | 271 | 1362.9 | 24238.6 | ||
| Average | 14 | 68.145 | 1211.9 | 17.8 | 0.276 |
Genetic length of region spanned by the markers screened on the RH map (Whitehead Institute/MIT Center for Genome Research).
DISCUSSION
This is the first genome-wide WG–RH anchor map of a model organism and could form the basis for large-scale EST mapping of the mouse genome. This first-generation anchor map provides a characterization of the T31 panel and allows us to estimate its potential limit of resolution, that is, the shortest physical distances that can be resolved using this panel.
Accurate physical distances are not available for the genome lengths spanned by this WG–RH map. Given a genetic length of ∼1700 cM for the mouse genome, 1 cM is equivalent to 1.75 Mb. The T31 24,239 cR3000 map spans a genetic distance of 1363 cM (Whitehead Institute/MIT Center for Genome Research 1996). Allowing for the equivalent physical distance of 2385 Mb provides an estimate of 98 kb/cR3000. With an average retention rate of 27.6%, and 98 kb/cR3000, we can estimate the average DNA fragment size to be 9.8 Mb and the potential resolution of the panel to be 378 kb. This implies that 8000 markers would be required to begin saturation of the panel. This projection is based on the markers placed on the panel to date, which is an underestimation of its eventual mapping power. There are certainly DNA fragments that have not been identified by the markers tested currently on the panel.
The T complex of chromosome 17 is the most densely mapped region of the RH anchor map, with 17 markers located in a 15-cM (26.25 Mb, 699.5 cR3000) region. The higher density of markers identified more obligate breakpoints than were detected for any other 15-cM region across the genome. The T-complex map has a current resolution of 37.5 kb/cR, which would result in a potential map resolution limit of 145 kb. Such a resolution would require at least 20,689 markers to saturate the mapping panel. It is reasonable to assume that an increased marker density across all genomic regions would result in the identification of donor DNA fragments that were not detected during this characterization, thus increasing the number of obligate breaks in the map and improving the estimates for the potential resolution of this resource. Even with a potential resolution of 145 kb, the T31 panel would be an excellent resource for high-density EST mapping, which has already begun using the EUCIB backcross.
Linkage reaches the point of being very poor at a distance of ∼100 cR3000, which approximates a two-point lod score of 3.15 for the 94 hybrids of this panel. Taking into account both the genome-wide estimate of 98 kb/cR3000 and the chromosome 17 T-complex estimate of 37.5 kb/cR3000, 100 cR3000 equates to a physical distance of 3.75–9.8 Mb, beyond which linkage is extremely tenuous.
The estimated limit of resolution for the human G3 panel is 240 kb (Stewart et al. 1997), which is comparable with the T31 panel. Although the T31 average fragment size is larger than in the G3 panel, the T31 panel contains 13% more hybrids and has a 73% higher retention rate, increasing the mapping power of the panel. The T31 panel demonstrates a potentially higher resolution than Genebridge4, although both were generated using 3000-rad x-rays from the same x-ray tube source. We can surmise that this difference may be attributable to increased radiation sensitivity of the donor mouse cell line.
In the human WG–RH panels there was evidence of higher retention rates in the pericentromeric and peritelomeric regions of many chromosomes. This centromeric effect has not been observed in the mouse panel. Retention rates across each mouse chromosome are shown graphically in Figure 2. The retention rate is variable across each chromosome and, if anything, there is evidence for a trend toward higher retention rates in the most proximal and distal regions, with a drop in retention frequency to a varying degree at the most proximal and distal markers. This is not in agreement with current wisdom on the cause of the centromeric effect. The fact that not all donor DNA fragments are integrated into the recipient chromosomes, but are maintained as recombinant additional chromosomes requiring donor centromeres and telomeres, has explained the sometimes higher retention rate for these regions.
METHODS
Cell Lines and Fusion
The T31 WG–RH panel was generated essentially as described by Walter et al. (1994). The donor cell line was a male 129aa strain embryonic stem cell line. Donor cells (2.5 × 10⁷) were irradiated with 3000 rads of x-rays, before fusion using polyethylene glycol (PEG) to an equal number of recipient cells. The recipient cell line A23 (Westerveld et al. 1971) was a thymidine kinase-deficient (TK−) established hamster fibroblast cell line. The fusion products were grown in Dulbecco’s modified Eagle medium (DMEM) containing 10% fetal bovine serum, glutamine, penicillin, and HAT (hypoxanthine, aminopterin, thymidine) at 37°C with 8% CO2. Ten days after fusion, 300 hybrid colonies were picked into individual wells of six-well microtiter plates and grown for DNA extraction. Fifty percent of cells from each hybrid were stored as frozen cell stocks in 12-well microtiter plates at this point. After an initial characterization, 104 hybrids were selected for expansion (Research Genetics). The data presented in this paper were gathered using the T31 panel DNA available from Research Genetics. Of the 104 T31 hybrids, those numbered 1 to 94, along with mouse and hamster controls, were screened to generate this data set.
FISH
Metaphase spreads of the hybrids and progenitor cell lines were prepared by standard cytogenetic techniques (Lichter et al. 1990). Two-hundred nanograms of total genomic DNA labeled with 16-dUTP was hybridized to the metaphase spreads at 37°C overnight. Stringent washes of 50% formamide at 42°C and 2× SSC at 42°C were followed by probe detection using avidin FITC. The signal was amplified by further incubations with biotinylated anti-avidin and avidin FITC. The chromosomes were counterstained with 0.5 μg/ml of propidium iodide and 2.5 μg/ml of 4,6,diamino-2-phenylindole in vector shield. Image analysis was performed using an MRC 600 confocal microscope.
PCR Screening
All primers used in the map generation amplified polymorphic microsatellite markers, and with the exception of D12Nds2 (Love et al. 1990) sequences are available from the Whitehead Institute. The screening was performed using two-temperature PCR. An initial 3-min denaturation step at 94°C was followed by 36 cycles of 30 sec at 94°C and 30 sec at the annealing temperature. For all PCR reactions, the annealing temperature was decreased by 1° per cycle for the first eight cycles to the final annealing temperature. This touchdown technique was employed to minimize nonspecific products from the hamster background. Although the recommended annealing temperature for the primer set is 55°C, all primer pairs were optimized before screening to elucidate annealing temperatures that minimized any hamster background. The actual annealing temperatures for the primer set varied between 53°C and 58°C. The Mg2+ concentration was optimized for each reaction and varied between 1 and 2 mm. The products were resolved on 3% agarose gels. All markers were screened in duplicate.
Data Analysis
Data analysis was performed using the RHMAP program (Boehnke et al. 1991). Because all of the markers had been localized previously on genetic maps, each chromosomal data set was analyzed individually. Two-point analysis was used to identify well-supported linkage groups within chromosomes. Linkage groups supported by a lod score of >4 were determined to be unambiguously linked. The markers were then ordered using maximum likelihood analysis with stepwise addition of markers. Assumptions of this analysis are that x-ray breakage occurs randomly, all DNA fragments are retained independently of each other, and there is a Poisson distribution of DNA fragment sizes. Distance (D) in Rays is calculated as follows: D = −ln(1 − bf), where bf is the breakage frequency. Distance is expressed in centiRaysN (cRN), where N is the radiation dose in rads, used to generate the hybrid panel.
Acknowledgments
The publication costs of this article were defrayed in part by payment of page charges. This article must therefore be hereby marked “advertisement” in accordance with 18 USC section 1734 solely to indicate this fact.
The publication costs of this article were defrayed in part by payment of page charges. This article must therefore be hereby marked “advertisement” in accordance with 18 USC section 1734 solely to indicate this fact.
Footnotes
E-MAIL lmc@mole.bio.cam.ac.uk; FAX 01223 333992.
REFERENCES
- Antoch M, Song E, Chang A, Vitaterna M, Zhao Y, Wilsbacher L, Sangoram A, King D, Pinto L, Takahashi J. Functional identification of the mouse circadian clock gene by transgenic BAC rescue. Cell. 1997;89:655–667. doi: 10.1016/s0092-8674(00)80246-9. [DOI] [PMC free article] [PubMed] [Google Scholar]
- Boehnke M, Lange K, Cox DR. Statistical methods for multipoint radiation hybrid mapping. Am J Hum Genet. 1991;49:1174–1188. [PMC free article] [PubMed] [Google Scholar]
- Breen M, Deakin L, Macdonald B, Miller S, Sibson R, Tarttelin E, Avner P, Bourgade F, Guenet J, Montagutelli X, et al. Towards high-resolution maps of the mouse and human genomes—A facility for ordering markers to 0.1 cM resolution. Hum Mol Genet. 1994;3:621–627. [PubMed] [Google Scholar]
- Cecchi C, Avner P. Genomic organization of the mottled gene, the mouse homolog of the human Menkes disease gene. Genomics. 1996;37:96–104. doi: 10.1006/geno.1996.0525. [DOI] [PubMed] [Google Scholar]
- Dietrich WF, Miller JC, Steen RG, Merchant M, Damron D, Nahf R, Gross A, Joyce DC, Wessel M, Dredge RD, et al. A genetic map of the mouse with 4,006 simple sequence length polymorphisms. Nature Genet. 1994;7:220–245. doi: 10.1038/ng0694supp-220. [DOI] [PubMed] [Google Scholar]
- Goss S, Harris H. New method for mapping genes in human chromosomes. Nature. 1975;255:680–684. doi: 10.1038/255680a0. [DOI] [PubMed] [Google Scholar]
- Gyapay G, Schmitt K, Fizames C, Jones H, Vega-Czarny N, Spillett D, Muselet D, Prud’Homme J-F, Dib C, Auffray C, et al. A radiation hybrid map of the human genome. Hum Mol Genet. 1996;5:339–346. doi: 10.1093/hmg/5.3.339. [DOI] [PubMed] [Google Scholar]
- Hudson TJ, Stein LD, Gerety SS, Ma J, Castle AB, Silva J, Slonim DK, Baptista R, Kruglyak L, Xu SH, et al. An STS-based map of the human genome. Science. 1995;270:1945–1954. doi: 10.1126/science.270.5244.1945. [DOI] [PubMed] [Google Scholar]
- Kleyn P, Fan W, Kovats S, Lee J, Pulido J, Wu Y, Berkemaier LR, Misumi DJ, Holmgren L, Charlat O, et al. Identification and characterisation of the mouse obesity gene Tubby—A member of a novel gene family. Cell. 1996;85:281–290. doi: 10.1016/s0092-8674(00)81104-6. [DOI] [PubMed] [Google Scholar]
- Leach RJ, O’Connell P. Mapping of mammalian genomes with radiation (Goss and Harris) hybrids. Adv Genet. 1995;33:63–99. doi: 10.1016/s0065-2660(08)60331-4. [DOI] [PubMed] [Google Scholar]
- Lee R, Johnson K, Lerner T. Isolation and chromosomal mapping of a mouse homolog of the Batten-disease gene CLN3. Genomics. 1996;35:617–619. doi: 10.1006/geno.1996.0410. [DOI] [PubMed] [Google Scholar]
- Lichter P, Ledbetter S, Ledbetter D, Ward D. Fluorescence in situ hybridisation with Alu and L1 polymerase chain-reaction probes for rapid characterisation of human chromosomes in hybrid cell lines. Proc Natl Acad Sci. 1990;87:6634–6638. doi: 10.1073/pnas.87.17.6634. [DOI] [PMC free article] [PubMed] [Google Scholar]
- Love JM, Knight AM, McAleer MA, Todd JA. Towards construction of a high-resolution map of the mouse genome using PCR-analysed microsatellites. Nucleic Acids Res. 1990;18:4123–4130. doi: 10.1093/nar/18.14.4123. [DOI] [PMC free article] [PubMed] [Google Scholar]
- McCarthy L. Whole genome radiation hybrid mapping. Trends Genet. 1996;12:491–493. doi: 10.1016/s0168-9525(96)30110-8. [DOI] [PubMed] [Google Scholar]
- Newton J, Orlow S, Barsh G. Isolation and characterisation of a mouse homolog of the X-linked ocular albinism (OA1) gene. Genomics. 1996;37:219–225. doi: 10.1006/geno.1996.0545. [DOI] [PubMed] [Google Scholar]
- Schmitt K, Foster JW, Feakes RW, Knights C, Davis ME, Spillet DJ, Goodfellow PN. Construction of a mouse whole genome radiation hybrid panel and application to MMU11. Genomics. 1996;34:193–197. doi: 10.1006/geno.1996.0265. [DOI] [PubMed] [Google Scholar]
- Schuler GD, Boguski MS, Stewart EA, Stein LD, Gyapay G, Rice K, White RE, Rodrigueztome P, Aggarwal A, Bajorek E, et al. A gene map of the human genome. Science. 1996;274:540–546. [PubMed] [Google Scholar]
- Shiels SA, Bassnett S. Mutations in the founder of the MIP gene family underlie cataract development in the mouse. Nature Genet. 1996;12:212–215. doi: 10.1038/ng0296-212. [DOI] [PubMed] [Google Scholar]
- Stewart E, McKusick K, Aggarwal A, Bajorek E, Brady S, Chu A, Fang N, Hadley D, Harris M, Hussain S, et al. An STS-based radiation hybrid map of the human genome. Genome Res. 1997;7:422–433. doi: 10.1101/gr.7.5.422. [DOI] [PubMed] [Google Scholar]
- Walter M, Goodfellow P. Radiation hybrids: Irradiation and fusion gene transfer. Trends Genet. 1993;9:352–356. doi: 10.1016/0168-9525(93)90040-o. [DOI] [PubMed] [Google Scholar]
- Walter M, Spillet D, Thomas P, Weissenbach J, Goodfellow P. A method for constructing radiation hybrid maps of whole genomes. Nature Genet. 1994;7:22–28. doi: 10.1038/ng0594-22. [DOI] [PubMed] [Google Scholar]
- Westerveld A, Visser R, Meera Khan P, Bootsma D. Loss of human genetic markers in man-Chinese hamster somatic cell hybrids. Nature New Biol. 1971;234:20–24. doi: 10.1038/newbio234020a0. [DOI] [PubMed] [Google Scholar]
- Whitehead Institute/MIT Center for Genome Research (H.G.M.P.) 1996. Data release 10, http://www-genome.wi.mit.edu/ftp/distribution/human_STS_releases/may96/.
- Yamaki A, Noda S, Kudoh J, Shindoh N, Maeda H, Minoshima S, Kawasaki K, Shimizu Y, Shimizu N. The mammalian single-minded (SIM) gene—mouse cDNA structure and dicephalic expression indicate a candidate gene for Down Syndrome. Genomics. 1996;35:136–143. doi: 10.1006/geno.1996.0332. [DOI] [PubMed] [Google Scholar]


