

Abstract
Multiple endocrine neoplasia type 1 (MEN 1) is an inherited cancer syndrome in which affected individuals develop multiple parathyroid, enteropancreatic, and pituitary tumors. The locus for MEN1 is tightly linked to the marker PYGM on chromosome 11q13, and linkage analysis places the MEN1 gene within a 2-Mb interval flanked by the markers D11S1883 and D11S449. Loss of heterozygosity studies in MEN 1 and sporadic tumors suggest that the MEN1 gene encodes a tumor suppressor and have helped to narrow the location of the gene to a 600-kb interval between PYGM and D11S449. Focusing on this smaller MEN1 interval, we have identified and mapped 12 transcripts to this 600-kb region. A precise ordered map of 33 transcripts, including 12 genes known to map to this region, was generated for the 2.8-Mb D11S480–D11S913 interval. Fifteen candidate genes (of which 10 were examined exhaustively) were evaluated by Southern blot and/or dideoxy fingerprinting analysis to identify the gene harboring disease-causing mutations.
[The sequence data described in this paper have been submitted to GenBank under accession nos. EST06996, U93236, AF001540–AF001547, AF001433–AF001436, AF001891–AF001893, N55476, R19205, and W37647 (see Table 1 for listing of transcripts). The BAC clone sequences have been submitted to GenBank under accession nos. AC000134, AC000159, and AC000353.]
Multiple endocrine neoplasia type 1 (MEN 1) is an autosomal dominant disorder in which affected individuals develop variable combinations of parathyroid, anterior pituitary, endocrine pancreatic, and duodenal tumors (Metz et al. 1994). The PYGM (muscle glycogen phosphorylase) marker at chromosome 11q13 originally was found to be linked to MEN1, showing no recombination with the MEN1 phenotype (Larsson et al. 1988; Nakamura et al. 1989; Petty et al. 1994; Kytola et al. 1995; Smith et al. 1995; Courseaux et al. 1996). However, recombinants between the MEN1 phenotype and more centromeric and telomeric markers have narrowed the MEN1 locus to a ∼2-Mb interval flanked by the markers D11S1883 and D11S449 (Courseaux et al. 1996; Debelenko et al. 1997a). The MEN1 gene is suspected to encode a classic tumor suppressor gene based on the observed loss of heterozygosity (LOH) for markers at 11q13 present in MEN 1 tumors, as well as in sporadic tumors of the types seen in familial MEN 1 (Larsson et al. 1988; Friedman et al. 1989, 1992; Debelenko et al. 1997b; Dong et al. 1997). Tumor deletion studies have suggested that the disease locus lies just telomeric to PYGM, narrowing the location of the MEN1 gene to a 600-kb region between PYGM and D11S449 (Bystrom et al. 1990; Lubensky et al. 1996; Emmert-Buck et al. 1997).
At present only two genes, ZFM1 (Toda et al. 1994) and FAU1 (Kas et al. 1993a), have been assigned to the minimal MEN1 interval, PYGM–D11S449 (Courseaux et al. 1996). Both genes have been excluded as candidates for MEN 1 based on mutation analysis (Kas et al. 1993b; Courseaux et al. 1996). Here we report the isolation, mapping, characterization, and mutation analysis of 21 transcripts contained in the 1-Mb region from PYGM to D11S4907, with the most intensive effort focusing on the genes in the PYGM to D11S449 interval. The transcript map, however, includes 33 transcripts spanning the 2.8-Mb interval between D11S480 and D11S913.
RESULTS
Mapping of 12 Known Genes to the Contig
A high-density clone contig-based physical map was generated for the 2.8-Mb region between D11S480 and D11S913 (Guru et al. 1997). This clone contig was used to precisely map 12 genes known to map to this general vicinity. Four of these genes, ZFM1 (Toda et al. 1994), FAU1 (Kas et al. 1993a), NOF1 (Kas et al. 1996), and CAPN1 (calpain) (Ohno et al. 1990), mapped to the PYGM–D11S449 region, the minimal interval for the MEN1 gene (Fig. 1). A group of four additional genes, PLCβ3 (Weber et al. 1994), FKBP2 (Grimmond et al. 1995), PNG (Lagercrantz et al. 1996), and VRF (Grimmond et al. 1996), were located centromeric to PYGM, close to markers D11S599 and D11S457. These results are consistent with the recent Fifth Chromosome 11 Workshop Report and an integrated physical map generated by the European Consortium on MEN 1 (Courseaux et al. 1996; Shows et al. 1996). An earlier report placed the group of PLCβ3/FKBP2/PNG/VRF on the telomeric side of PYGM, apparently because of the incorrect mapping of D11S457 (Weber et al. 1994).
Figure 1.
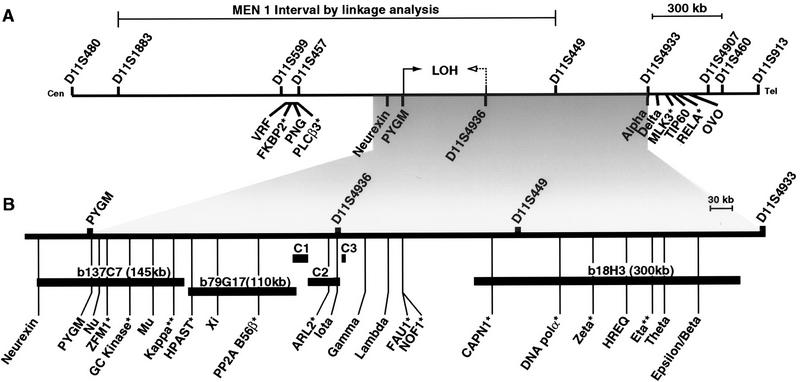
Transcript map of 2.8-Mb region containing the MEN1 locus in the interval D11S480–D11S913. (A) The MEN1 interval identified by linkage analysis spanning from D11S1883 to D11S449 is shown, with the region from PYGM to D11S4936 marked by arrows as the minimal interval inferred from LOH data. The arrow with a dotted line represents the boundary determined from a sporadic gastrinoma. (B) The 1-Mb region from PYGM to D11S4933 is expanded for clarity. Some relevant markers are indicated above the map and the transcripts are identified below. Sizes of BAC clones (b137C7, b79G17, and b18H3) are given. Sequence contigs from cosmids C1, C2, and C3 are 14 kb, 46 kb, and 6.8 kb, respectively. (*) Genes that have been eliminated as MEN1 candidates by mutation detection analysis. Mutation analysis is incomplete for the Kappa and Eta (**). Identification and mapping of OVO will be reported independently (A. Chidambaram, R. Allikmets, S.C. Chandrasekharappa, S.C. Guru, W. Modi, B. Gerrard, and M. Dean, in prep.).
Two other genes, RELA (Deloukas et al. 1994) and TIP60 (Kamine et al. 1996), were reported previously to map to the 11q13 region based on FISH and somatic cell hybrid mapping. Both transcripts were found to be located within the cosmid clone c132h3 in the D11S449–D11S4907 region. Another gene, MLK3 (Ing et al. 1994), was also mapped close to RELA and TIP60, outside the MEN1 distal boundary defined by the marker D11S449.
Identification and Mapping of 21 Other Transcripts
New transcripts identified in the present investigation were identified primarily by BLAST and GRAIL analysis of genomic sequences generated for the MEN1 region (D11S1883–D11S4933). The sequences originated from three different sources: (1) end sequencing of yeast artificial chromosomes (YAC, y) and bacterial [P1-derived artificial chromosome (PAC, pc), bacterial artificial chromosome (BAC, b), P1 (p), and cosmid (c)] clones (Guru et al. 1997), (2) sequencing BAC clones b137C7, b79G17, and b18H3 (GenBank accession nos. AC000134, AC000159, and AC000353, respectively), and (3) sequences available in the public database (http://mcdermott.swmed.edu/datapage/11_seq_project/) for three overlapping cosmids, cSRL 23c3/116b6/114g4 (denoted as sequence contigs C1, C2, and C3 in Fig. 1), and a cosmid cSRL32h5 that we mapped to the PYGM–D11S449 region (Guru et al. 1997). The identified transcripts were categorized into the following four groups.
Known Human Genes Not Previously Known to Map to This Region
The BLAST analysis against National Center for Biotechnology Information (NCBI) databases identified four known genes: GC-kinase (Katz et al. 1994), PP2AB56β (McCright et al. 1996), ARL2 (Clark et al. 1993), and DNA polα (Collins et al. 1993). The T7 end sequence of the BAC clone b138M20 matched PP2AB56β. DNA polα and GC-kinase were identified by BLAST analysis of sequence generated from BAC clones b18H3 and b137C7, respectively. ARL2 was discovered by similar analysis of a 46-kb cosmid sequence (C2) derived from overlapping cosmids cSRL23c3/116b6/114g4, as mentioned above.
Human Homologs of Genes Known in Other Species
Three genes, HPAST, HREQ, and Neurexin, belong to this category. Sequence from b79G17 identified HPAST, whose name was based on its homology to the Drosophila PAST-1 gene (GenBank accession no. U70135). Similarly, sequences from the end of a PAC clone pc195F17 (SP6-end) identified a gene homologous to the mouse Requiem (GenBank accession no. U10435) and therefore the human homolog was named HREQ. Both the b137C7 sequence and the end sequence of cosmid c16F4 showed homology to rat Neurexin II-alpha (GenBank accession no. M96376). The human homolog is being characterized.
Transcripts of Unknown Function with Expressed Sequence Tag Matches
EST matches with genomic sequence identified a total of 12 new transcripts. The ESTs were mapped back to the clones in the contig before further characterization. Independent newly identified transcripts were named with sequential Greek letters. At least two of the following criteria were required to validate a putative transcript: (1) EST matches from a minimum of two cDNA clones from different tissue sources, (2) expression of the message on Northern blots, (3) presence of a poly(A) signal followed by a track of As, and (4) comparison of the cDNA versus the genomic sequence for the presence of interrupted exons.
Two ESTs (D11S1957E and D11S951E) known to map to the 11q13 region based on a radiation hybrid map (James et al. 1994) were found to identify a single transcript of 8.5 kb, which was named Alpha. Transcripts Beta, Gamma, Delta, and Lambda were identified from EST hits homologous to end sequences of clones, yA87A1(left-end), b138M20(SP6-end), p47F3(SP6-end) and c72C4(T7-end), respectively. Transcripts Mu and Nu were identified based on the EST hits from the BAC clone b137C7, and Epsilon, Zeta, Eta, and Theta were defined from b18H3 sequence matches. Iota was identified from EST matches to the cosmid sequence contig C2; upon completion of the Iota cDNA sequence, the first exon was found to be in the 46-kb C2 cosmid sequence contig, and five additional exons were found in the 6.8-kb C3 sequence contig from cosmid cSRL114g4 (Fig. 1).
Transcripts of Unknown Function Derived from Software Prediction of Exons
One transcript, Xi, was identified solely based on exons predicted by GRAIL and FEXH. Another transcript, Kappa, was identified based on potential coding region similarity (BLASTX) to several kinases in the protein databases and on exon predictions by GRAIL and FEXH. Validation as bona fide transcripts was accomplished by amplification of neighboring exons from cDNA, followed by sequencing and Northern blot analysis.
Predicted exons from three b137C7 sequence contigs (Fig. 2) were found to be part of the same transcript (Kappa), because each of them hybridized to an 8-kb message on Northern blots, and mapped back to the same interval on the genomic clones of our contig (data not shown). The predicted exons were analyzed by PCR amplification from a leukocyte cDNA library (Fig. 2). The sequence from the five exons in sequence contig 194 were present in the PCR product amplified from the leukocyte cDNA library, precisely as predicted by GRAIL. However, three differences were observed in sequence contigs 168 and 200. GRAIL failed to predict an exon in each contig (Fig. 2, asterisk). In addition, an intron predicted by GRAIL in contig 200 was found to be part of the cDNA (Fig. 2, arrow). This very small (33-nucleotide) intron might have been predicted to be biologically unlikely.
Figure 2.
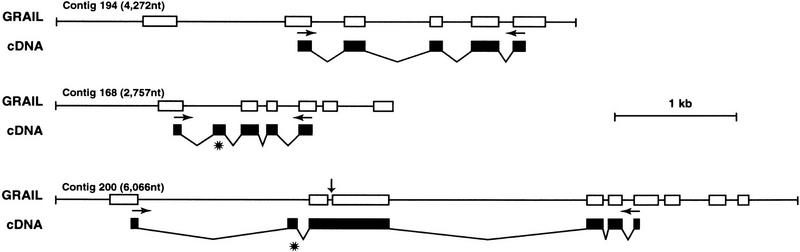
Comparison of GRAIL-predicted exons vs the cDNA sequence. GRAIL-predicted exons of b137C7 sequence contigs 194, 168, and 200 are shown in open boxes and compared with the corresponding exons identified by amplifying and sequencing cDNA, represented by solid boxes. (*) Two exons missed by GRAIL in contigs 168 and 200. A vertical arrow shows a 33-nucleotide intron predicted by GRAIL that is part of the exon in cDNA. Arrows indicate the primers used for amplifying the corresponding cDNA. All three contigs identified the same 8-kb transcript, denoted Kappa, on Northern blots.
Characterization of Transcripts
All the transcripts were analyzed for expression and size. This usually was carried out by probing one or more of three commercially available Multiple Tissue Northern (MTN) blots (Human 7760-1, HumanII 7759-1, and human endocrine blot, Human 7751-1, Clontech). The probes used varied from PCR-amplified exons as small as 120 nucleotides to complete cDNA, but in all cases, complete or nearly complete cDNA probes were eventually used for hybridization. Typical examples of the expression analysis are shown in Figure 3. A single 2.8-kb transcript was detected in all the tissues from MTN and endocrine blots with both a 220-nucleotide PCR product and a 1.8-kb cDNA probe from the Mu transcript. On the other hand, two transcripts, the 4.4-kb Epsilon and the 19-kb Beta, were seen with an 8.8-kb probe. However the 2.8-kb probe (Fig. 3C) detected only the 19-kb Beta transcript (data not shown). Both Epsilon and Beta are transcribed as intronless RNAs from the same start site, with Epsilon using a poly(A) signal at 4.4 kb, whereas the Beta transcript uses a downstream poly(A) signal. Thus, these two transcripts, originally interpreted as separate, now seem to represent polyadenylation isoforms.
Figure 3.
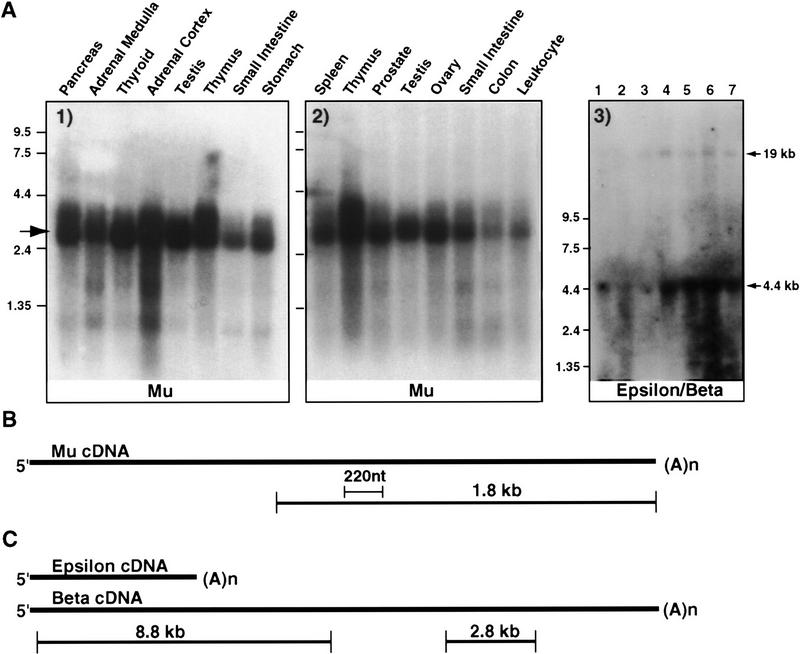
Representative Northern blots of new transcripts. New transcripts were analyzed for message size and expression levels by probing one or more of the three commercially available multiple tissue Northern blots. (A, left) Endocrine blot probed with a 1.8-kb Mu cDNA from the Mu transcript; (middle) blot probed with a 220-bp Mu cDNA. In both cases a 2.8-kb message is identified that is expressed in all tissues. (A, right) Blot containing total RNA from EBV-transformed lymphocytes from seven FMEN1 cases, probed with the 8.8-kb Epsilon/Beta probe. Two messages are seen: a more abundant 4.4-kb Epsilon transcript and a less abundant 19-kb message named Beta. (B) Mu cDNA and location of probes used for blots in A left and middle. (C) Epsilon/Beta cDNA and probes used in A right. Probes used in A are in B and C. The 2.8-kb probe in C independently confirmed the 19-kb Beta transcript, and did not detect Epsilon (data not shown).
Table 1 lists a number of features of 23 transcripts in the PYGM–D11S4933 interval. There were two genes, Gamma and Eta, where expression was not visible on Northern blots. Presumably these are low abundance messages; they were considered bona fide transcripts based on EST matches, amplification from RNA, and the presence of poly(A) signal at the 3′ end. Transcript Nu was expressed in only 4 out of the 16 tissues tested: leukocytes, thymus, spleen, and stomach. The remaining transcripts showed roughly similar expression levels in the 8 to 20 tissues analyzed by probing Northern blots. The Zeta probe detected two transcripts, 2- and 2.2-kb in all the tissues tested, and sequencing of the cDNA indicated that the two transcripts differed by the use of two different poly(A) signals located 328 bases apart. The characterization of two different transcript sizes on Northern blots for Lambda and Delta has not yet been carried out.
Table 1.
Characterization and Mutation Analysis of Transcripts Located between PYGM and D11S4933
| Transcripts | GenBank ID no. | Size of mRNA (kb) | cDNA cloning | Mutation analysis of FMEN 1 patientsa | Uni- Geneb | Gene Mapc | |
|---|---|---|---|---|---|---|---|
| Southern | ddF | ||||||
| Nu | EST06996 | 4.5 | incomplete | not done | not done | yes | no |
| GC-kinase | U07349 | 2.9 | GenBank | yes | yes | yes | no |
| Mu | U93236 | 2.8 | complete | yes | yes+ | yes | yes |
| Kappa | AF001543, AF001544 | 8 | incomplete | not done | partial++ | no | no |
| HPAST | AF001434 | 3.5 | complete | yes | yes | yes | yes |
| Xi | AF001545 | 8 | incomplete | not done | not done | no | no |
| PP2AB56β | L42374 | 2.5 | GenBank | yes | yes | yes | yes |
| ARL2 | L13687 | 0.9 | GenBank | yes | yes | yes | no |
| Iota | AF001435 | 2.2 | complete | not done | not done | yes | yes |
| Gamma | AF001547 | no signal | 1.6 kb | not done | not done | yes | yes |
| Lambda | AF001891 | 1.4/3.5* | incomplete | not done | not done | yes | no |
| NOF1 | U39400 | 2.2 | GenBank | yes | yes | yes | yes |
| DNA polα | L24559 | 2.2 | GenBank | yes | yes | yes | yes |
| Zeta | AF001436 | 2.0/2.2* | complete | yes | yes | yes | yes |
| HREQ | AF001433 | 2.5 | complete | yes | not done | yes | yes |
| Eta | AF001546 | no signal | 1.2 kb | not done | partial+++ | yes | yes |
| Theta | N55476, R19205 | 4 | incomplete | not done | not done | yes | no |
| Epsilon/Beta | AF001892, AF001893 | 4.4/19.0* | incomplete | yes | not done | yes | yes |
| Alpha | AF001540, AF001541, AF001542 | 8.5 | incomplete | not done | not done | yes | yes |
| Delta | W37647 | 0.7/2.8* | incomplete | not done | not done | yes | no |
| MLK3 | L32976 | 3.5 | GenBank | yes | yes | yes | yes |
| RELA | L19067 | 2.5 | GenBank | yes | yes | yes | yes |
| TIP60 | U40989 | 2.9 | GenBank | yes | not done | yes | yes |
Four known genes from this region, ZFM1 (D26120), FAU1 (X65923), CAPN1 (X04366), and OVO (A. Chidambaram, R. Allikmets, S.C. Chandrasekharappa, S.C. Guru, W. Modi, B. Gerrard, and M. Dean, in prep.), were not included here as they have previously been excluded as candidates for MEN 1. (*) Two messages on Northern blot.
(+)Mutation analysis by dideoxy fingerprinting identified Mu as the MEN1 gene (Chandrasekharappa et al. 1997); (++) 22 exons excluded (+++) available 1.2 kb, excluded.
Presence of EST matches with the transcript in Unigene is indicated by ‘yes’ and absence by ‘no’ (http://www.ncbi.nlm.nih.gov/Schuler/UniGene/Chr11.html).
Presence of EST matches with the transcript on the Gene Map is indicated by ‘yes’ and absence by ‘no’ (http://www.ncbi.nlm.nih.gov/SCIENCE96/ResTools.html).
Once a transcript was validated as bona fide and the size of the transcript was determined, cloning of the complete cDNA sequence was attempted. For three transcripts (Zeta, Iota, and HREQ), EST clones in the database could be clustered into contigs covering the entire cDNA. A substantial portion of the remaining 11 transcripts, except Kappa and Xi, were assembled from overlapping ESTs from Unigene (Table 1). Efforts were then made to clone full-length cDNAs from libraries by various techniques: GENETRAPPER (GIBCO-BRL), 5′ and 3′ RACE (Clontech), PCR amplification with primers designed from GRAIL predicted exons, and PCR amplification of regions between EST clones. A single 2.8-kb cDNA clone containing the entire Mu transcript was isolated by the GENETRAPPER method. The cloning of a complete cDNA for another transcript, HPAST, was accomplished by characterizing two overlapping cDNA clones identified by EST matches, each hybridizing to the same 3.5-kb transcript. Incomplete clones for the following transcripts were recovered by at least one of the aforementioned methods: Nu, Kappa, Xi, Theta, Epsilon/Beta, Lambda, Alpha, and Delta. Also, because the expression and size of the message of Gamma and Eta could not be ascertained by Northern blot, it is not certain whether full-length cDNAs have been obtained.
The transcripts were analyzed for exon–intron structure by comparing the cDNA sequence to the available genomic sequence from the BAC or cosmid sequence contigs. For HPAST, NOF1, Lambda, and MLK3, cosmid clones containing the corresponding gene were directly sequenced by primers designed from the cDNA sequences.
Mutation Analysis of Candidate Genes
Candidate genes in the MEN1 interval from PYGM to D11S4933 were analyzed for the presence of mutations in familial MEN 1 (FMEN 1) patients by Southern blots for detecting gross structural changes and in more detail by dideoxy fingerprinting. The diagnosis of MEN 1 was based upon the presence of tumors in two of the three principal systems: parathyroid, enteropancreatic endocrine tissue, and anterior pituitary. Also, the diagnosis of FMEN 1 required at least one first-degree relative with a tumor of one or more of these systems (all participating family members gave full informed consent in a protocol approved by the National Institute of Diabetes and Digestive and Kidney Diseases (NIDDK) Institutional Review Board). Table 1 includes a summary of the genes. Southern blot analysis was performed with TaqI- and HindIII-digested DNA from 32 FMEN1 affected individuals belonging to 32 different kindreds with full-length cDNA probes for 13 out of the 23 candidate genes (Table 1). No gross structural changes were observed in any of the candidate genes. In three instances (HREQ, DNA polα, and GC-kinase), variant bands were seen that were analyzed further in normal controls and confirmed as benign restriction fragment length polymorphisms. Dideoxy fingerprinting analysis was performed for 12 candidate genes (Table 1). Genomic DNA samples from 16 different FMEN 1 kindreds and 10 normal controls were included in the analysis. For each transcript, the coding region from ATG to stop codon (if known) was screened except for Kappa and Eta. In 11 genes, no significant changes were seen that segregated with the disease. Isolated DNA samples in some of the genes showed dideoxy fingerprinting band pattern changes that were followed further by sequencing to identify the sequence change. For GC-kinase, two different heterozygous sequence changes were identified: exon 5 GCA to TCA (A120S) and exon 24 CGC to CAC (A579H). NOF1 had one instance of a heterozygous G to A sequence change in exon 1, ATG to ATA (M5I). One patient had a heterozygous sequence change in Eta from CAG to AAG (E159K), and one patient had AGG to AAG (R152K) in Zeta. These changes were further analyzed in other affected family members of the kindred, and none of them were linked with the disease phenotype. The sequence changes found in NOF1, Eta, Zeta, and MLK3 are not likely to be disease-causing because these genes also lie outside the distal flanking marker D11S449, and therefore are excluded from the minimal 600-kb MEN1 interval between PYGM and D11S449 (Bystrom et al. 1990; Courseaux et al. 1996; Lubensky et al. 1996; Emmert-Buck et al. 1997). An additional four variants that were seen in GC-kinase, Kappa, ARL2, and DNA polα, which were also present in normal DNA samples, were found to be benign polymorphisms and therefore could be used as polymorphic markers for this region (Manickam et al. 1997). Additionally, nine dideoxy fingerprinting polymorphic band pattern changes seen only in normal controls (two each in GC-kinase, HPAST, and PP2AB56β, and one each in Kappa, Eta, and Zeta) were not followed further. Also, five ddF polymorphic band pattern changes that were equally distributed in patients and normal controls, three of which were seen in Eta and two in MLK3, were not followed further. Finally, dideoxy fingerprinting changes identified in Mu were found in multiple individuals affected with MEN1, allowing its assignment as the MEN1 gene (Chandrasekharappa et al. 1997).
DISCUSSION
A map consisting of 33 transcripts was generated for the 2.8-Mb D11S480–D11S913 interval at 11q13. Twenty-seven of these transcripts map telomeric to PYGM, in what appears to be a fairly gene-rich region. Four previously identified genes, GC-kinase (Katz et al. 1994), PP2AB56β (McCright et al. 1996), ARL2 (Clark et al. 1993), and DNA polα (Collins et al. 1993), not known previously to map to this region, were precisely mapped. Thirteen new transcripts were isolated, including three human homologs of previously known genes, one for the Drosophila PAST-1 gene, another for rat Neurexin II-alpha, and the third for mouse Requiem.
The gene cluster of PLCβ3/FKBP2/PNG/VRF, reported earlier to be telomeric to PYGM (Weber et al. 1994; Grimmond et al. 1995, 1996; Lagercrantz et al. 1996), now is shown to map centromeric to PYGM. The FAU1 gene was also reported to be 90 kb proximal to PYGM (Kas et al. 1993a), but we find it to be nearly 400 kb distal to PYGM. These results are consistent with two other more recent efforts to generate integrated maps for this region of chromosome 11 (Courseaux et al. 1996; Shows et al. 1996).
All but two of the new transcripts were identified as EST matches with the genomic sequences (Table 1). The two exceptions were Kappa and Xi, which were identified as GRAIL-predicted exons from the two BAC clones b137C7 and b79G17, respectively. GRAIL analysis of genomic sequence contigs with good to excellent matches were characterized in detail by amplifying the exon sequences from a leukocyte cDNA library and comparing the sequences, as shown in Figure 2. Fifteen exons predicted by GRAIL were verified by amplifying from cDNA and sequencing (Fig. 2). However, two exons were missed by GRAIL. In addition, a 33-nucleotide sequence in contig 200 perceived as an intron by GRAIL was found to be part of an exon in cDNA. Though Kappa and Xi are ∼8 kb transcripts, each gave a distinct tissue-specific expression pattern on MTN blots (data not shown). This along with their origin from two nonoverlapping BAC clones indicate that Kappa and Xi are independent transcripts.
Our map includes 15 transcripts mapping to the 600-kb PYGM–D11S449 MEN1 interval. Previous reports include only two transcripts, ZFM1 (Courseaux et al. 1996) and FAU1 (Kas et al. 1993b), in this interval, both of which had been excluded by mutation analysis as candidate genes for MEN1. Another gene, CAPN1 (Pang et al. 1996), excluded previously by mutation analysis, also maps to this region. LOH studies in MEN 1 and sporadic tumors with several new markers have subsequently resulted in narrowing the MEN1 locus to a 300-kb PYGM–D11S4936 region (Emmert-Buck et al. 1997), though the distal boundary has to be considered provisional because it was based on LOH in a sporadic gastrinoma. Eight transcripts (Nu, GC-kinase, Mu, Kappa, Xi, HPAST, PP2AB56β, and ARL2) lie within this new minimal MEN1 interval and therefore were of greatest interest.
Genes excluded from the MEN1 linkage interval (D11S1883–D11S449) are DNA polα, Zeta, HREQ, Eta, Theta, Beta/Epsilon, Alpha, Delta, MLK3, RELA, TIP60, and OVO, all located distal to D11S449 (Fig. 1). However, the new LOH distal boundary, D11S4936, excludes Iota, Gamma, Lambda, FAU1, NOF1, and CAPN1, as well. PYGM as a proximal boundary eliminates PLCβ3, FKBP2, PNG, VRF, and Neurexin. Among these genes, PLCβ3 (de Witt et al. 1997; Weber et al. 1997) and FKBP2 (Grimmond et al. 1995) have also been analyzed previously for mutations in MEN1 kindreds and excluded. Nine additional genes, GC-kinase, HPAST, PP2AB56β, ARL2, NOF1, DNA polα, Zeta, MLK3, and RELA, have been excluded by Southern blot and dideoxy fingerprinting analysis in this study (Table 1). Since completion of the work intended for presentation in this manuscript, MEN1 mutations were identified in one of the candidate genes (Mu) mapped in this transcript search. Full details of that analysis, which revealed significant alterations in 14 out of 15 FMEN 1 pedigrees, are reported elsewhere (Chandrasekharappa et al. 1997).
The present report provides a detailed map of 33 transcripts in the 2.8-Mb region on chromosome 11q13 and the mutation analysis of 15 candidate genes (of which 10 were examined exhaustively). This not only has proved valuable to identify the MEN1 tumor suppressor gene, but is likely to provide valuable information in the future for the identification of other disease-causing genes that map to this gene-rich region. This includes Bardet–Biedl Syndrome-1 (BBS1; Leppert et al. 1994), insulin-dependent diabetes mellitus 4 (IDDM4; Davies et al. 1994), paraganglioma 2 (PGL2; Mariman et al. 1993), spinocerebellar ataxia type 5 (SCA5; Ranum et al. 1994), vitreoretinopathy neovascular inflammatory disease (VRN1; Stone et al. 1992a), and Best’s disease (VDM2; Stone et al. 1992b).
METHODS
Mapping the Transcripts on the Contig
Sequence-tagged sites (STSs) were generated from gene sequences in the database, matching EST- and GRAIL-predicted exon sequences. Nearly 80 YAC, BAC, PAC, and P1 clones have been isolated and assembled into a 2.8-Mb contig based on the STS-content analysis with nearly 120 STSs (Guru et al. 1997). Cosmid clones have also been isolated and assembled into smaller contigs for this region (Guru et al. 1997). PCR was carried out with STSs representing the transcripts, in duplicates, using genomic clones (YAC, BAC, PAC, P1, and cosmid clones) as templates. The results were integrated with an STS-content map to generate an ordered map of the transcripts on the 2.8-Mb physical map.
Northern Analysis
Multiple Northern blots (human poly(A)+ blots, Human 7760-1, HumanII 7759-1, and human endocrine blot, Human 7751-1, Clontech) were used to check the size and the distribution of expression in different tissues using either the full length or fragment of an EST as a probe. A Northern blot was also made containing 20 μg of total RNA isolated from Epstein–Barr virus-transformed lymphocytes from seven FMEN 1 probands. Preparation of labeled probes and hybridization conditions were as described under Southern hybridization below.
Screening cDNA Libraries by GENETRAPPER
GENETRAPPER cDNA positive selection system was used for the isolation of full-length cDNA using Human Leukocyte SuperScript cDNA library (GIBCO-BRL). In brief, a PAGE-purified oligonucleotide complementary to a segment of the target cDNA was biotinylated using biotin-14-dCTP and terminal deoxynucleotidyl transferase (TdT). A complex population of double-stranded phagemid DNA containing cDNA inserts was converted to single-stranded DNA using Gene II and Exonuclease III. Hybrids between the biotinylated oligonucleotide and single-stranded DNA formed in solution were captured on streptavidin-coated paramagnetic beads. The captured single-stranded DNA target was released from the biotinylated oligonucleotide and the cDNA clone was further enriched by using a nonbiotinylated target oligonucleotide to specifically prime conversion of the recovered single-stranded DNA target to double-stranded DNA. Repaired DNA (2 μl) was electroporated into 40 μl of ElectroMAX DH10B cells using BioRad Gene Pulser (2.5 kV in a 0.1-cm gap chamber at settings of 100 ohms and 25 μF). Positive clones were identified either by PCR or oligonucleotide hybridization and determined by digesting with MluI.
5′ and 3′ RACE
Primers were designed from the EST sequences and RT–PCR was performed on the following Mararthon cDNA sources as per the manufacturer’s protocol (Clontech): pancreas, pituitary, and ovary. PCR products were cloned in the PCRII TA-cloning vector (Invitrogen). Positive clones were identified by colony hybridization to end-labeled nested oligonucleotides. Inserts of positive clones were sequenced first with vector primers and then by primer walking.
Southern Hybridization
Blood DNA (5 μg) extracted (Qiagen Genomic Tips) from 32 FMEN1 affected individuals from 32 different kindreds was digested with TaqI and HindIII restriction enzymes, separated on 0.8% agarose gel, and blotted to Hybond membrane (Amersham). cDNAs from GC-kinase, Mu, HPAST, PP2AB56β, ARL2, NOF1, DNA polα, Zeta, HREQ, Epsilon/Beta, MLK3, RELA, and TIP60 were radiolabeled using Random primer labeling kit (Amersham) as per the manufacturer’s protocol. Labeled DNA (50–100 ng) was preannealed at 65°C (50 μl probe, 100 μg unlabeled human COT-I DNA and 50 μl 6× SSC) for 2–4 hr. These preannealed probes were hybridized to Southern or Northern blots at 65°C for 16–24 hr in hybridization solution (6× SSC, 5× Denhardt’s, 0.5% SDS, and 100 μg/ml of denatured salmon sperm DNA). Filters were washed at room temperature in 2× SSC/0.1% SDS twice for 30 min, and 0.2× SSC/0.1% SDS at 65°C for 30 min. The blots were exposed to Kodak X-ray film at −70°C for 3–7 days.
Primary PCR for Dideoxy Fingerprinting
DNA was isolated from blood samples of 16 FMEN 1 probands (from 16 different kindreds) and 10 normal healthy individuals using Qiagen Genomic Tips. Genomic DNA fragments containing exons of each gene were amplified using primers designed from the genomic DNA sequence (PCR primer and dideoxy fingerprinting primer sequences can be found as supplementary material to this article at http://www.nhgri.nih.gov and the Genome Research Web site). PCR was performed in 25-μl reactions containing 100 ng DNA, 0.2 μm of each primer, 200 μm dNTPs, 10 mm Tris-HCl at pH 8.3, 50 mm KCl, 1.5 mm MgCl2, 0.001% (wt/vol) gelatin, and 0.5 units of AmpliTaq Gold (Perkin Elmer). DMSO was added to a final concentration of 5% for amplifying MLK3 exons 5 and 9. Reactions were cycled in a Perkin Elmer System 9600: 92°C for 10 min to activate Taq Gold and then 35 cycles of 94°C for 30 sec, 60°C for 30 sec, and 72°C for 1–2 min depending on the size of the fragment amplified; after a final extension step at 72°C for 5 min the reactions were held at 4°C. All PCR products were checked for homogeneity by electrophoresing a 5-μl aliquot on agarose gels.
Dideoxy Fingerprinting
Primers for the dideoxy fingerprinting reaction (PCR primer and dideoxy fingerprinting primer sequences can be found as supplementary material to this article at http://www.nhgri.nih.gov and the Genome Research web site) were end-labeled with [γ-33P]ATP and T4 polynucleotide kinase as per the manufacturer’s protocol. Dideoxy fingerprinting was performed as per the protocol described by Sarkar et al. (1992) with modifications. The primary PCR products generated above were subjected to Sanger’s dideoxy chain termination reaction using ddG (dideoxy GTP) in a 10-μl reaction containing 1 μl primary PCR template (20 ng), 0.15 μm end-labeled ddF primer, 25 μm dNTPs, 200 μm ddG, 10 mm Tris-HCl at pH 8.3, 50 mm KCl, 1.5 mm MgCl2, 0.001% (wt/vol) gelatin, and 1 unit of AmpliTaq Gold. Reactions were cycled in a Perkin Elmer System 9600: 92°C for 10 min to activate Taq Gold and then 35 cycles of 94°C for 30 sec, 65°C for 30 sec, and 72°C for 1 min; after a final extension step at 72°C for 5 min the reactions were held at 4°C. To the 10-μl dieoxy fingerprinting reactions was added 40 μl of buffer containing 7 m urea, 50% formamide, bromophenol blue, and xylene cyanol. Reactions were heated at 94°C for 5 min and chilled in ice, and 5 μl was loaded on a nondenaturing gel [0.75× mutation detection enhancement (MDE) gel (FMC BioProducts) in 0.5× TBE buffer] on a sequencing apparatus. The gel was electrophoresed at a constant power of 8 watts at room temperature in a buffer system consisting of 0.5× TBE in the top reservoir and 0.8× TBE with 0.5 m sodium acetate in the bottom reservoir, until the bromophenol blue reached the bottom of the gel. The gel was removed onto Whatman paper, dried for 30 min in a sequencing gel drier, and autoradiographed overnight. One dideoxy fingerprinting primer could screen ∼250 bp; if the coding region to be screened in the primary PCR product was larger, one or more additional primers were used for dideoxy fingerprinting. Samples with changes in band patterns were subjected to cycle sequencing using the same primary PCR product and the same end-labeled primer as was used in the dideoxy fingerprinting reaction. Some polymorphic changes distributed in normal controls and affecteds were also sequenced to generate markers.
Genomic Clone Sequencing
BAC clones were subjected to shotgun sequencing (Pan et al. 1994) and the data assembled using the Phred/Phrap/Consed system developed by P. Green (University of Washington, Seattle); http://chimera.biotech.washington.edu/uwgc/. All assembled contigs ⩾1000 bases were analyzed using the PowerBLAST program (ftp://ncbi.nlm.nih.gov/pub/sim2/PowerBlast/), which masks low complexity sequences and repetitive elements and then performs simultaneous BLASTN and BLASTX searches, reporting the results in graphical form (Zhang and Madden 1997). Both the “nr” and “est” databases at http://ncbi.nlm.nih.gov/ were searched. Contigs were also analyzed using GRAIL (http://avalon.epm.ornl.gov/) and the FEXH and HEXON programs (http://dot.imgen.bcm.tmc.edu:9331/gene-finder/gf.html).
Acknowledgments
We are grateful to Dr. John Kehrl for providing information about some of the exon–intron junctions in the 5′ part of GC-kinase. We thank Christina Robbins, Nicole Dietrich, Diana Willingham, and George Poy for assistance in sequencing; Hongshing Lai for assistance with the computer-based sequence assembly; Suraj Saggar for technical help; and Darryl Leja for illustrations. We thank all the MEN 1 families who participated in this research effort. We would also like to acknowledge a Department of Energy graduate fellowship to J.S.C., an NHGRI grant HG00313 to B.A.R., and the support from the intramural research programs of NHGRI, the National Institute of Diabetes and Digestive Diseases, the National Cancer Institute, and the National Library of Medicine.
The publication costs of this article were defrayed in part by payment of page charges. This article must therefore be hereby marked “advertisement” in accordance with 18 USC section 1734 solely to indicate this fact.
Footnotes
E-MAIL chandra@nhgri.nih.gov; FAX (301) 496-7210.
REFERENCES
- Bystrom C, Larsson C, Blomberg C, Sandelin K, Falkmer U, Skogseid B, Oberg K, Werner S, Nordenskjold M. Localization of the MEN1 gene to a small region within chromosome 11q13 by deletion mapping in tumors. Proc Natl Acad Sci. 1990;87:1968–1972. doi: 10.1073/pnas.87.5.1968. [DOI] [PMC free article] [PubMed] [Google Scholar]
- Chandrasekharappa SC, Guru SC, Manickam P, Olufemi S-E, Collins FS, Emmert-Buck MR, Debelenko LV, Zhuang Z, Lubensky IA, Liotta LA, Crabtree JS, Wang Y, Roe BA, Weisemann JM, Boguski MS, Agarwal SK, Kester MB, Kim YS, Heppner C, Dong Q, Spiegel AM, Burns AL, Marx SJ. Positional cloning of the gene for multiple endocrine neoplasia-type 1. Science. 1997;276:404–407. doi: 10.1126/science.276.5311.404. [DOI] [PubMed] [Google Scholar]
- Clark J, Moore L, Krasinskas A, Way J, Battey J, Tamkun J, Kahn RA. Selective amplification of additional members of the ADP-ribosylation factor (ARF) family: Cloning of additional human and Drosophila ARF-like genes. Proc Natl Acad Sci. 1993;90:8952–8956. doi: 10.1073/pnas.90.19.8952. [DOI] [PMC free article] [PubMed] [Google Scholar]
- Collins KL, Russo AA, Tseng BY, Kelly TJ. The role of the 70 kDa subunit of human DNA polymerase alpha in DNA replication. EMBO J. 1993;12:4555–4566. doi: 10.1002/j.1460-2075.1993.tb06144.x. [DOI] [PMC free article] [PubMed] [Google Scholar]
- Courseaux A, Grosgeorge J, Gaudray P, Pannett AA, Forbes SA, Williamson C, Bassett D, Thakker RV, Teh BT, Farnebo F, Shepherd J, Skogseid B, Larsson C, Giraud S, Zhang CX, Salandre J, Calender A. Definition of the minimal MEN1 candidate area based on a 5-Mb integrated map of proximal 11q13. The European Consortium on MEN1 (GENEM 1; Groupe d’Etude des Neoplasies Endocriniennes Multiples de Type 1) Genomics. 1996;37:354–365. [PubMed] [Google Scholar]
- Davies JL, Kawaguchi Y, Bennett ST, Copeman JB, Cordell HJ, Pritchard LE, Reed PW, Gough SC, Jenkins SC, Palmer SM, Balfour KM, Rowe BR, Farrall M, Barnett AH, Bain SC, Todd JA. A genome-wide search for human type 1 diabetes susceptibility genes. Nature. 1994;371:130–136. doi: 10.1038/371130a0. [DOI] [PubMed] [Google Scholar]
- Debelenko LV, Emmert-Buck MR, Manickam P, Kester MB, Guru SC, DiFranco EM, Olufemi S-E, Agarwal SK, Lubensky IA, Zhuang Z, Burns AL, Spiegel AM, Liotta LA, Collins FS, Marx SJ, Chandrasekharappa SC. Haplotype analysis defines a new minimal interval for multiple endocrine neoplasia type 1 (MEN1) gene. Cancer Res. 1997a;57:1039–1042. [PubMed] [Google Scholar]
- Debelenko LV, Zhuang Z, Emmert-Buck MR, Chandrasekharappa SC, Manikam P, Guru SC, Marx SJ, Spiegel AM, Collins FS, Jensen RT, Liotta LA, Lubensky IA. Allelic deletions on chromosome 11q13 in MEN1-associated and sporadic duodenal gastrinomas and pancreatic endocrine tumors. Cancer Res. 1997b;57:2238–2243. [PubMed] [Google Scholar]
- Deloukas P, Dauwerse JG, van Ommen GJ, van Loon AP. The human NFKB3 gene encoding the p65 subunit of transcription factor NF-kappa B is located on chromosome 11q12. Genomics. 1994;19:592–594. doi: 10.1006/geno.1994.1115. [DOI] [PubMed] [Google Scholar]
- de Witt MJ, Landsvater RM, Sinke RJ, Geurts van Kessel A, Lips CJ, Hoppener JW. Exclusion of the phosphatidylinositol-specific phospholipase C beta 3 (PLC beta 3) gene as candidate for the multiple endocrine neoplasia type 1 (MEN1) gene. Hum Genet. 1997;99:133–137. doi: 10.1007/s004390050327. [DOI] [PubMed] [Google Scholar]
- Dong Q, Debelenko LV, Chandrasekharappa SC, Lotterman C, Skarulis M, Emmert-Buck MR, Zhuang Z, Guru SC, Manickam P, Lubensky IA, Liotta LA, Collins FS, Marx SJ, Spiegel AM. Loss of heterozygosity at 11q13: Analysis of pituitary tumors, lung carcinoids, lipomas, and other uncommon tumors in subjects with familial multiple endocrine neoplasia type 1. J Clin Endocrinol Metab. 1997;82:1416–1420. doi: 10.1210/jcem.82.5.3944. [DOI] [PubMed] [Google Scholar]
- Emmert-Buck MR, Lubensky IA, Dong Q, Manickam P, Guru SC, Kester MB, Olufemi S-E, Agarwal SK, Burns AL, Spiegel AM, Collins FS, Marx SJ, Zhuang Z, Loitta LA, Chandrasekharappa SC, Debelenko LV. Localization of the multiple endocrine neoplasia type 1 (MEN1) gene based on tumor LOH analysis. Cancer Res. 1997;57:1855–1858. [PubMed] [Google Scholar]
- Friedman E, Sakaguchi K, Bale AE, Falchetti A, Streeten E, Zimering MB, Weinstein LS, McBride WO, Nakamura Y, Brandi ML, Norton JA, Aurbach GD, Spiegel AM, Marx SJ. Clonality of parathyroid tumors in familial multiple endocrine neoplasia type 1. N Engl J Med. 1989;321:213–218. doi: 10.1056/NEJM198907273210402. [DOI] [PubMed] [Google Scholar]
- Friedman E, DeMarco L, Gejman PV, Norton JA, Bale AE, Aurbach GD, Spiegel AM, Marx SJ. Allelic loss from chromosome 11 in parathyroid tumors. Cancer Res. 1992;52:6804–6809. [PubMed] [Google Scholar]
- Grimmond S, Weber G, Larsson C, Walters M, Teh B, Shepherd J, Nordenskjold M, Hayward N. Exclusion of the 13-kDa rapamycin binding protein gene (FKBP2) as a candidate gene for multiple endocrine neoplasia type 1. Hum Genet. 1995;95:455–458. doi: 10.1007/BF00208976. [DOI] [PubMed] [Google Scholar]
- Grimmond S, Lagercrantz J, Drinkwater C, Silins G, Townson S, Pollock P, Gotley D, Carson E, Rakar S, Nordenskjold M, Ward L, Hayward N, Weber G. Cloning and characterization of a novel human gene related to vascular endothelial growth factor. Genome Res. 1996;6:124–131. doi: 10.1101/gr.6.2.124. [DOI] [PubMed] [Google Scholar]
- Guru SC, Olufemi S-E, Manickam P, Cummings C, Gieser LM, Pike BL, Bittner ML, Jiang Y, Chinault AC, Nowak NJ, Brzozowska A, Crabtree JS, Wang Y, Roe BA, Weisemann JM, Boguski MS, Agarwal SK, Burns AL, Spiegel AM, Marx SJ, Flejter WL, de Jong PJ, Collins FS, Chandrasekharappa SC. A 2.8 Mb clone contig of the multiple endocrine neoplasia type 1 (MEN1) region on 11q13. Genomics. 1997;42:436–445. doi: 10.1006/geno.1997.4783. [DOI] [PubMed] [Google Scholar]
- Ing YL, Leung IW, Heng HH, Tsui LC, Lassam NJ. MLK-3: Identification of a widely-expressed protein kinase bearing an SH3 domain and a leucine zipper-basic region domain. Oncogene. 1994;9:1745–1750. [PubMed] [Google Scholar]
- James MR, Richard CW, Schott JJ, Yousry C, Clark K, Bell J, Terwilliger JD, Hazan J, Dubay C, Vignal A, Agrapart M, Imai T, Nakamura YM, Polymeropoulos M, Weissenbach J, Cox DR, Lathrop GM. A radiation hybrid map of 506 STS markers spanning human chromosome 11. Nature Genet. 1994;8:70–76. doi: 10.1038/ng0994-70. [DOI] [PubMed] [Google Scholar]
- Kamine J, Elangovan B, Subramanian T, Coleman D, Chinnadurai G. Identification of a cellular protein that specifically interacts with the essential cysteine region of the HIV-1 Tat transactivator. Virology. 1996;216:357–366. doi: 10.1006/viro.1996.0071. [DOI] [PubMed] [Google Scholar]
- Kas K, Schoenmaker E, van de Ven WJM, Weber G, Nordenskjold M, Michiels L, Merregaert J, Larsson C. Assignment of the human FAU gene to a subregion of chromosome 11q13. Genomics. 1993a;17:387–392. doi: 10.1006/geno.1993.1337. [DOI] [PubMed] [Google Scholar]
- Kas K, Weber G, Merregaert J, Michiels L, Sandelin K, Skogseid B, Thompson N, Nordenskjold M, Larsson C, Friedman E. Exclusion of FAU as the multiple endocrine neoplasia type 1 (MEN1) gene. Hum Mol Genet. 1993b;2:349–353. doi: 10.1093/hmg/2.4.349. [DOI] [PubMed] [Google Scholar]
- Kas K, Lemahieu V, Meyen E, Van de Ven WJM, Merregaert J. Isolation, cDNA, and genomic structure of a conserved gene (NOF) at chromosome 11q13 next to FAU and oriented in the opposite transcriptional orientation. Genomics. 1996;34:433–436. doi: 10.1006/geno.1996.0310. [DOI] [PubMed] [Google Scholar]
- Katz P, Whalen G, Kehrl JH. Differential expression of a novel protein kinase in human B lymphocytes. Preferential localization in the germinal center. J Biol Chem. 1994;269:16802–16809. [PubMed] [Google Scholar]
- Kytola S, Leisti J, Salmela P. Improved carrier testing for multiple endocrine neoplasia, type 1, using new microsatellite-type DNA markers. Hum Genet. 1995;96:449–453. doi: 10.1007/BF00191805. [DOI] [PubMed] [Google Scholar]
- Lagercrantz J, Carson E, Larsson C, Nordenskjold M, Weber G. Isolation and characterization of a novel gene close to the human phosphoinositide-specific phospholipase C beta 3 gene on chromosomal region 11q13. Genomics. 1996;31:380–384. doi: 10.1006/geno.1996.0063. [DOI] [PubMed] [Google Scholar]
- Larsson C, Skogseid B, Oberg K, Nakamura Y, Nordenskjold M. Multiple endocrine neoplasia type 1 gene maps to chromosome 11 and is lost in insulinoma. Nature. 1988;332:85–87. doi: 10.1038/332085a0. [DOI] [PubMed] [Google Scholar]
- Leppert M, Baird L, Anderson KL, Otterud B, Lupski JR, Lewis RA. Bardet–Beidl syndrome is linked to DNA markers on chromosome 11q and is genetically heterogeneous. Nature Genet. 1994;7:108–111. doi: 10.1038/ng0594-108. [DOI] [PubMed] [Google Scholar]
- Lubensky IA, Debelenko LV, Zhuan Z, Emmert-Buck MR, Dong Q, Chandrasekharappa SC, Guru SC, Manickam P, Olufemi SE, Marx SJ, Spiegel AM, Collins FS, Liotta LA. Allelic deletions on chromosome 11q13 in multiple tumors from individual MEN1 patients. Cancer Res. 1996;56:5272–5278. [PubMed] [Google Scholar]
- Manickam, P., S.C. Guru, L.V. Debelenko, S.K. Agarwal, S.-E. Olufemi, J.M. Weisemann, M.S. Boguski, J.S. Crabtree, Y. Wang, B.A. Roe et al. 1997. Eighteen new polymorphic markers in the multiple endocrine neoplasia type 1 (MEN1) region. Hum. Genet. (in press). [DOI] [PubMed]
- Mariman ECM, van Beersum SEC, Cremers CWRJ, van Baars FM, Ropers HH. Analysis of a second family with hereditary non-chromaffin paragangliomas locates the underlying gene at the proximal region of chromosome 11q. Hum Genet. 1993;91:357–361. doi: 10.1007/BF00217356. [DOI] [PubMed] [Google Scholar]
- McCright B, Brothman AR, Virshup DM. Assignment of human protein phosphatase 2A regulatory subunit genes b56alpha, b56beta, b56gamma, b56delta, and b56epsilon (PPP2R5A–PPP2R5E), highly expressed in muscle and brain, to chromosome regions 1q41, 11q12, 3p21, 6p21.1, and 7p11.2 → p12. Genomics. 1996;36:168–170. doi: 10.1006/geno.1996.0438. [DOI] [PubMed] [Google Scholar]
- Metz DC, Jensen RT, Bale AE, Skarulis MC, Eastman RC, Nieman L, Norton JA, Friedman E, Larsson C, Amorossi A, Brandi ML, Marx SJ. Multiple endocrine neoplasia type I. Clinical features and management. In: Bilezekian JP, Levine MA, Marcus R, editors. The Parathyroids. New York, NY: Raven Press; 1994. pp. 591–646. [Google Scholar]
- Nakamura Y, Larsson C, Julier C, Bystrom C, Skogseid B, Wells S, Oberg K, Carlson M, Taggart T, O’Connell P, Leppert M, Lalouel J-M, Nordenskjold M, White R. Localization of the genetic defect in multiple endocrine neoplasia type 1 within a small region of chromosome 11. Am J Hum Genet. 1989;44:51–755. [PMC free article] [PubMed] [Google Scholar]
- Ohno S, Minoshima S, Kudoh J, Fukuyama R, Shimizu Y, Ohmi-Imajoh S, Shimizu N, Suzuki K. Four genes for the calpain family locate on four distinct human chromosomes. Cytogenet Cell Genet. 1990;53:225–229. doi: 10.1159/000132937. [DOI] [PubMed] [Google Scholar]
- Pan HQ, Wang YP, Chissoe SL, Bodenteich A, Wang Z, Iyer K, Clifton SW, Crabtree JS, Roe BA. The complete nucleotide sequence of the pSacBII P1 cloning vector and three cosmid cloning vectors: pTCF, suPHEP and LAWRIST16. Genet Anal Tech Appl. 1994;11:181–186. doi: 10.1016/1050-3862(94)90039-6. [DOI] [PubMed] [Google Scholar]
- Pang JT, Lloyd SE, Wooding C, Farren B, Pottinger B, Harding B, Leigh SE, Pook MA, Benham FJ, Gillett GT, Taggart RT, Thakker RV. Genetic mapping studies of 40 loci and 23 cosmids in chromosome 11p13-11q13, and exclusion of mu-calpain as the multiple endocrine neoplasia type 1 gene. Hum Genet. 1996;97:732–741. doi: 10.1007/BF02346182. [DOI] [PubMed] [Google Scholar]
- Petty EM, Green JS, Marx SJ, Taggart RT, Farid N, Bale AE. Mapping the gene for hereditary hyperparathyroidism and prolactinoma (MEN1-Burin) to chromosome 11q: Evidence for a founder effect in patients from Newfoundland. Am J Hum Genet. 1994;54:1060–1066. [PMC free article] [PubMed] [Google Scholar]
- Ranum LPW, Schut LJ, Lundgren JK, Orr HT, Livingston DM. Spinocerebellar ataxia type 5 in a family descended from the grandparents of President Lincoln maps to chromosome 11. Nature Genet. 1994;1:246–250. doi: 10.1038/ng1194-280. [DOI] [PubMed] [Google Scholar]
- Sarkar GH, Yoon HJ, Sommer SS. Dideoxy fingerprinting (ddF): A rapid and efficient screen for the presence of mutations. Genomics. 1992;13:441–443. doi: 10.1016/0888-7543(92)90266-u. [DOI] [PubMed] [Google Scholar]
- Shows TB, Alders M, Bennett S, Burbee D, Cartwright P, Chandrasekharappa S, Cooper P, Courseaux A, Davies C, Devignes M-D, Devilee P, Elliott A, Evans G, Fantes J, Garner H, Gaudray P, Gerhard D, Gessler M, Higgins M, Hummerich H, James M, Lagercrantz J, Litt M, Little P, Mannens M, Munroe D, Nowak N, O’Brien S, Parker N, Perlin M, Reid L, Richard C, Sawicki M, Swallow D, Thakker R, van Heyningen V, van Schothorst E, Vorechovsky I, Wadelius C, Weber B, Zabel B. Report of the Fifth International Workshop on Human Chromosome 11 Mapping 1996. Cytogenet Cell Genet. 1996;74:1–56. doi: 10.1159/000134383. [DOI] [PubMed] [Google Scholar]
- Smith CM, Wells SA, Gearhard DS. Mapping eight new polymorphisms in 11q13 in the vicinity of multiple endocrine neoplasia type 1: Identification of a new distal recombinant. Hum Genet. 1995;96:377–387. doi: 10.1007/BF00191793. [DOI] [PubMed] [Google Scholar]
- Stone EM, Kimura AE, Folk JC, Bennett SR, Nichols BE, Streb LM, Sheffield VC. Genetic linkage of autosomal dominant neovascular inflammatory vitreoretinopathy to chromosome 11q13. Hum Mol Genet. 1992a;1:685–689. doi: 10.1093/hmg/1.9.685. [DOI] [PubMed] [Google Scholar]
- Stone EM, Nichols BE, Streb LM, Kimura AE, Sheffield VC. Genetic linkage of vitelliform macular degeneration (Best’s disease) to chromosome 11q13. Nature Genet. 1992b;1:246–250. doi: 10.1038/ng0792-246. [DOI] [PubMed] [Google Scholar]
- Toda T, Iida A, Miwa T, Nakamura Y, Imai T. Isolation and characterization of a novel gene encoding nuclear protein at a locus (D11S636) tightly linked to multiple endocrine neoplasia type 1 (MEN1) Hum Mol Genet. 1994;3:465–470. doi: 10.1093/hmg/3.3.465. [DOI] [PubMed] [Google Scholar]
- Weber G, Friedman E, Grimmond S, Hayward NK, Phelan C, Skogseid B, Gobl A, Zedenius J, Sandelin K, The BT, Carson E, White L, Oberg K, Sheperd J, Nordenskjold M, Larsson C. The phospholipase C beta 3 gene located in the MEN1 region shows loss of expression in endocrine tumors. Hum Mol Genet. 1994;3:1775–1781. doi: 10.1093/hmg/3.10.1775. [DOI] [PubMed] [Google Scholar]
- Weber G, Grimmond S, Lagercrantz J, Friedman E, Phelan C, Carson E, Hayward N, Jacobovitz O, Nordenskjold M, Larsson C. Exclusion of the phosphoinositide-specific phospholipase C beta 3 (PLCB3) gene as a candidate for multiple endocrine neoplasia type 1. Hum Genet. 1997;99:130–132. doi: 10.1007/s004390050326. [DOI] [PubMed] [Google Scholar]
- Zhang J, Madden TL. PowerBLAST: A network BLAST application for interactive or automated sequence analysis and annotation. Genome Res. 1997;7:649–656. doi: 10.1101/gr.7.6.649. [DOI] [PMC free article] [PubMed] [Google Scholar]