

Abstract
Effective use of knowledge of human genome sequences in studies of hereditary diseases or cancer heavily depends on efficient methods for detection of mutations in individual samples. We describe here a simple and efficient mutation scanning system in which PCR products are post-labeled with two different fluorescent dyes in one tube, and analyzed by an automated capillary electrophoresis system using single-strand conformation polymorphism (SSCP) conditions (PLACE–SSCP). With the appropriate use of an internal control DNA, differences in electrophoretic mobilities between a reference and samples are precisely evaluated, then the presence of mutations is statistically judged. Thirty-three of 34 known mutations in fragments of three unrelated sequence contexts up to 741 bp were detected using one electrophoresis condition at the confidence level of <0.3% false positive. All the mutations were detected by analyzing at two temperatures. The described system has the advantage of little human intervention, short analysis time, high sensitivity, and objectivity of data interpretation.
PCR–single-strand conformation polymorphism (SSCP) analysis is a widely used method for the detection of sequence differences in PCR products (Hayashi and Yandell 1993). In the original method, radioactively labeled PCR products amplified from reference and sample DNAs are analyzed by nondenaturing polyacrylamide slab gel electrophoresis in a single-stranded state (Orita et al. 1989). Mutations are detected as differences in mobility between each strand of a reference and test samples, because the sample strands have different conformations if there are sequence changes, and therefore migrate differently during electrophoresis. PCR–SSCP requires minimal sample handling before separation, but the use of radioisotopes and dependence on gel electrophoresis represent disadvantages in large-scale mutation screening. Other limitations of the conventional SSCP technique are that its high sensitivity is assured only for short (<300 bp) DNA fragments, and that the data interpretation involves visual examination of band shifts, a process that requires experience and tends to be subjective.
Fluorescence-based PCR–SSCP (F-SSCP) has been developed in which fluorescently labeled PCR products are electrophoresed and detected by automated DNA sequencer (Makino et al. 1992). This method is nonradioactive, is highly sensitive, and has the advantage of direct data storage and processing by the computer of the automated DNA sequencer. In this system, however, peak detection depended on a single fluorescent dye, and normalization of lane-to-lane mobility variations is difficult. Subsequently, SSCP analysis using gel-based DNA sequencer with multicolor fluorescence detection has been developed (Ellison et al. 1993; Iwahana et al. 1994, 1995). The multiple fluorescent detection system permitted correction of lane-to-lane variations by coelectrophoresis of an internal size standard DNA labeled with a dye different from that of the sample DNA. The relative peak positions (mobility) of sample DNAs are then reproducibly determined using peaks of the internal standard DNA as references. However, the size range for sensitive detection of mutations does not seem to be significantly extended.
Capillary electrophoresis (CE) is a promising tool for effectively replacing gel electrophoresis techniques in DNA analysis. The characteristics that make CE attractive for DNA analysis include its high speed, high resolution, and high sensitivity provided with laser-induced fluorescence detection. No need for gel preparation and automatic sample loading also makes CE attractive to DNA analyses. A disadvantage of CE is that it is essentially a single channel analysis, and detection of subtle differences in mobility among samples, such as in SSCP analysis, is difficult, especially with equipment having a detection system of only a single color (of fluorescence emission or of UV absorption). CE with sieving matrices has been applied to SSCP analysis (Kuypers et al. 1993; Felmlee et al. 1995; Oto et al. 1995) but has not been widely used, perhaps because of the use of a single-color detection system, and also because of the failure to demonstrate improved sensitivity compared with conventional slab gel-based SSCP analysis.
Hebenbrock et al. (1995) used a capillary electrophoretic apparatus equipped with two-color fluorescence detection in SSCP analysis to facilitate strand identification. In their system, samples were amplified using primers labeled with different dyes, but whether or not sensitivity has been improved remained unproven because only a short (276-bp) DNA fragment was examined for mutation detection.
Here we describe a simple procedure of post-PCR multicolor fluorescence labeling of the DNA fragments in one tube, and directly subjecting them to SSCP analysis in an automatically operated capillary electrophoretic system (CE–SSCP). The presence of mutations is confidently determined at a high sensitivity using internal control DNA that included reference DNA, and the length limit of SSCP analysis is significantly extended compared with previous methods.
RESULTS
Strategy
The two strands of sample DNAs are labeled with 6-carboxyrhodamine (R110) and N,N′-diethyl-2′,7′-dimethyl-6-carboxyrhodamine (R6G) by a one-tube post-PCR labeling method. Internal control DNA is labeled with another dye, N,N,N′,N′-tetramethyl-6-carboxyrhodamine (TAMRA). Sample and internal control DNAs are mixed, denatured in formamide, and separated by nondenaturing electrophoresis in a capillary filled with a low viscosity sieving matrix that is replaced after each run.
A raw electropherogram is obtained for each dye by detecting spectrally separated laser-excited fluorescence near the cathode end of the capillary. Then, run-to-run variation of peak positions (in data points) of samples (labeled with R110 and R6G) are corrected by referring to peaks of the internal control (labeled with TAMRA). The results are obtained as a numerical table of peaks of samples versus their corrected positions. Variability of corrected peak positions of reference (wild type or normal) DNA labeled with R110 and R6G is statistically evaluated first, and mutations are judged to be present in the sample DNA when peak positions of either one or both strands are significantly different from peak positions of corresponding strands of reference (wild type or normal) DNA.
Sensitivity of the analysis is expressed as the percentage of known mutant fragments that can be detected based upon the above criteria. Obviously, small variation of peak positions of reference (wild type or normal) DNA is critical for the high sensitivity in the analysis.
Differential Post-PCR Labeling of Strands of PCR Products in One-Tube Reaction
Previously, we reported a simple and rapid one-tube method for fluorescent post-labeling of PCR products that is suitable for SSCP analysis (Inazuka et al. 1996). The method involved treatment of PCR products with Klenow fragment of DNA polymerase I to exchange the 3′-terminal residues of PCR-amplified DNA fragments for a fluorescent dUTP, and subsequent digestion with alkaline phosphatase to degrade unincorporated nucleotides. All reactions including PCR are carried out in one tube simply by successive addition of reagents. Labeled DNA can be applied directly to fluorescence-based automated DNA sequencers without purification.
We modified this method to label complementary strands with two different dyes to facilitate distinction of strands in SSCP analysis by capillary electrophoresis. A region of Bacillus subtilis gyrA gene was amplified from the wild-type DNA using primers that had 5′-GTT or 5′-ATT at the ends, as indicated in Table 1. The product was then treated with Klenow fragment of DNA polymerase I in the presence of R110–dUTP and R6G–dCTP to exchange 3′-terminal T or C in the PCR product with the respective fluorescent nucleotides. The 5′ ends of the primers were designed to assure unique incorporation of the fluorescent nucleotides at the ends (Inazuka et al. 1996). We have chosen Ts at the second and third positions from the 5′ ends of primers, because the labeling was less efficient when these residues were occupied by C. Presumably, tight duplex ends are inefficient substrates of 3′-exonuclease activity of the DNA polymerase that is essential in the exchange reaction. Strand separation and examination by nondenaturing capillary electrophoresis revealed that the exchange reaction was virtually quantitative, and each strand was labeled only with the expected dye (data not shown). Efficiency and reproducibility of this labeling reaction was confirmed using several other PCR products.
Table 1.
Primers Designed for Postlabeling
| Target | Primer | Nucleotide sequencea | Amplicon size (bp) |
|---|---|---|---|
| gyrA | sense | 5′-ATTTAGGCATGACAAGTGAC | |
| antisense | 5′-GTTTGTTCGATCTCAGCTTT | 592 | |
| hFIX exon 7 | sense | 5′-atTGCCTATTCCTGTAACCAGCA | |
| antisense | 5′-gttCTGCTACAGGTTGTGCCAAG | 521 | |
| hFIX exon 8 | sense | 5′-attCTGTGTATGTGAAATACTGTTTGTGA | |
| antisense | 5′-gtTCCCCTCTAAAGAGAAAAAGCA | 741 |
Primers are designed to have 5′-ATT or 5′-GTT. When necessary, extranucleotides (lowercase) are attached for postlabeling purposes.
Precise Calibration of Mobilities Using Reference DNA as an Internal Control
Reproducibility of SSCP in capillary electrophoresis was examined by repeated analysis of the same sample and correction of mobility in various ways. To do this, the wild-type gyrA fragment, labeled with two dyes as described above, was electrophoresed multiple times together with TAMRA-labeled internal controls. One electropherogram was chosen arbitrarily as a template, and peaks in the remaining electropherograms were calibrated using the sizing algorithm of the instrument software. This was done by first assigning the data point of each peak of the internal control in the template to “size.” By this procedure, corresponding peaks of internal control in the remaining electropherograms were aligned to those of the template. Sample peak positions are then estimated by intrapolation.
Among several methods of interpolation available with the instrument software, we found “local Southern” to be the most satisfactory, because it gave smallest variation of the peak positions of reference DNAs. In this method, positions of sample peaks were calculated as an average of two interpolations, each using a second-order curve fitted to three nearby peaks (one to the left and two to the right, or two to the left and one to the right) of the internal control. Table 2 shows an example of data normalization of five successive runs.
Table 2.
Calibration of Peak Positions of Normal DNA
| Sense strand | Antisense strand | ||||
|---|---|---|---|---|---|
| rawa | calibrated using | rawa | calibrated using | ||
| Mb | M + Nc | Mb | M + Nc | ||
| 6393d | 6393.00 | 6393.00 | 6557d | 6557.00 | 6557.00 |
| 6474 | 6389.01 | 6393.03 | 6638 | 6556.32 | 6557.02 |
| 6457 | 6392.16 | 6392.98 | 6623 | 6560.09 | 6557.02 |
| 6476 | 6391.79 | 6393.01 | 6641 | 6560.12 | 6557.02 |
| 6469 | 6389.53 | 6392.01 | 6635 | 6557.35 | 6557.01 |
| average | 6391.10 | 6392.81 | 6558.18 | 6557.01 | |
| s.d.e | 1.55 | 0.40 | 1.61 | 0.01 | |
Data points of peaks of R6G-labeled sense strand and R110-labeled antisense strand of PCR product of gyrA wild type examined by five successive runs.
Raw data without calibration.
Calibrated using size marker alone.
Calibrated using size marker and TAMRA-labeled normal PCR products.
Used as a template for calibration.
Standard deviation.
The variation of peak positions estimated as described above is dependent not only on the method of intrapolation but also on the choice of the internal control. The principle of intrapolation is such that the closer the peak of the sample is to that of the internal control, the more precise is the determination of relative positions. Preliminary experiments indicated that small mobility changes do exist when the same sequence was labeled with different fluorescent dyes, but the change was always small regardless of the sequence context. So, we included TAMRA-labeled reference DNA in the internal control and found that the variation of the peak positions of reference DNA labeled with R110 and R6G was significantly reduced compared with the variation of the data calibrated using size standard alone as an internal control (Table 2).
Sensitivity of Mutation Detection
Known mutations in three different sequence contexts were used to assess the sensitivity of SSCP in the capillary electrophoresis system. Those mutations were: 23 mutations in gyrA gene of B. subtilis, 5 mutations in exon 7 of human factor IX (hFIX), and 6 mutations in exon 8 of the same gene (Table 3). Appropriate regions in the mutant and reference (wild type or normal) genomes were amplified by PCR using primers shown in Table 1, followed by labeling of each strand with R110 or R6G. PCR product of reference allele of each fragment was also labeled with TAMRA, and combined with TAMRA-labeled size markers for use as an internal control. A mixture of sample and internal control DNAs was then subjected to electrophoresis at 30°C (Fig. 1) and analyzed following the procedures described above. Five runs were devoted to the reference sequences (not shown), and standard deviations of their peaks were calculated.
Table 3.
Mutated Sequences in Sample DNA
| No. | Mutation | Positiona | No. | Mutation | Positiona |
|---|---|---|---|---|---|
| gyrA | hFIX exon 7 | ||||
| 1 | T → G | 250 | 1 | T → C | 30046 |
| 2 | C → T | 251 | 2 | G → A | 30070 |
| 3 | G → C | 253 | 3 | T → G | 30117 |
| 4 | G → A | 262 | 4 | T → C | 30134 |
| 5 | G → C | 262 | 5 | AC deletion | 30141 |
| 6 | A → C | 263 | |||
| 7 | A → G | 263 | |||
| 8 | A → T | 263 | hFIX exon 8 | ||
| 9 | TC → AT | 250 | |||
| 10 | TC → AA | 250 | 1 | C → T | 30875 |
| 11 | TC → AG | 250 | 2 | C → A | 30973 |
| 12 | TC → CT | 250 | 3 | C → A | 31096 |
| 13 | CA → TG | 251 | 4 | G → A | 31119 |
| 14 | CA → TT | 251 | 5 | G → T | 31211 |
| 15 | CA → AT | 251 | 6b | A → G | 30972 |
| 16 | CA → TC | 251 | C → T | 31328 | |
| 17 | CA → AC | 251 | |||
| 18 | GA → AT | 262 | |||
| 19 | GA → TT | 262 | |||
| 20 | AA → TT | 263 | |||
| 21 | TTC → CTT | 249 | |||
| 22 | TCA → GGT | 250 | |||
| 23 | GAA → ACT | 262 |
Nucleotide number starting from the first nucleotide of the coding sequence of gyrA (Munakata et al. 1994) or proposed transcription initiation site of hFIX (Yoshitake et al. 1985).
This sample carried a double mutation, at positions 30972 and 31328.
Figure 1.

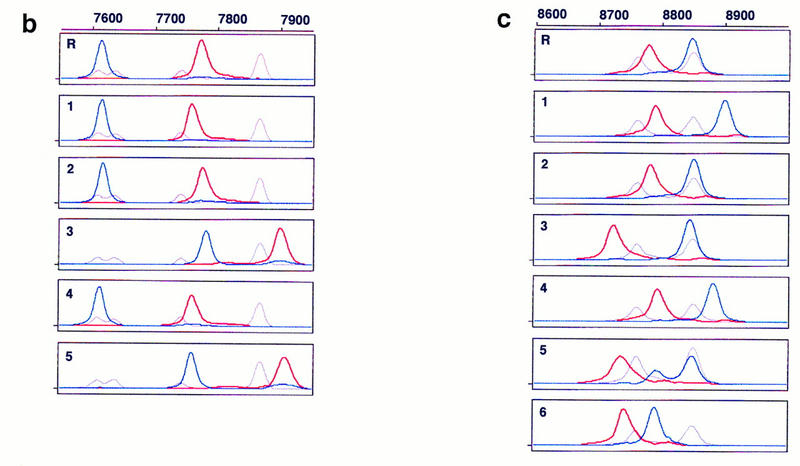
Electropherograms of multicolor fluorescence CE–SSCP. PCR products amplified from B. subtilis gyrA (a), hFIX exon 7 (b), and hFIX exon 8 (c) DNA were postlabeled with R6G–dCTP (red, sense strand) and R110–dUTP (blue, antisense strand) at their 3′ ends, and serially analyzed by CE–SSCP, together with TAMRA-labeled internal controls (gray, both strands). The internal controls were GS 2500 for gyrA, and a mixture of GS 500 and TaqαI fragments of pcDNAI for both hFIX exons 7 and 8, in addition to their respective normal sequences. Run-to-run differences in mobility were calibrated using peaks of TAMRA. Sample numbers correspond to mutant numbers in Table 2. (R) Wild type (gyrA) or normal (hFIX exons 7 and 8). Abscissa scaled at the top is retention time in data point (70-msec interval), and ordinate is fluorescence intensity in arbitrary unit. Data point 1 corresponds to 5 min after start of electrophoresis.
Table 4 summarizes standard deviations of reference sequences and mobility shifts of each mutant peak (Δ data point), which are the differences in data points between mutant peaks and averaged reference peaks. Assuming a mobility shift three times larger than the standard deviation of mobility of a normal sequence as a criteria of presence of mutation, all but one sample (no. 14 of gyrA) were judged to be mutants. By running electrophoresis at 20°C, this mutant showed significant mobility shift, although another mutant (no. 23 of gyrA) escaped detection (data not shown). Thus, in the present method, mutations are detected at 97% sensitivity at 0.3% chance of false positive, supposing Gaussian distribution of peak positions of normal sequences.
Table 4.
Statistical Evaluation of Mobility Shift
| No. | Mobility shifta | No. | Mobility shifta | ||
|---|---|---|---|---|---|
| sense | antisense | sense | antisense | ||
| gyrA | hFIX exon 7 | ||||
| 1 | −8.69 | 23.51 | 1 | −11.62 | −0.93 |
| 2 | −11.21 | −2.92 | 2 | 4.53 | 2.49 |
| 3 | 27.16 | 1.96 | 3 | 126.41 | 166.66 |
| 4 | 0.18b | 11.18 | 4 | −12.58 | −2.08 |
| 5 | 53.21 | −5.91 | 5 | 133.61 | 143.92 |
| 6 | 77.69 | 54.97 | |||
| 7 | 47.90 | 56.54 | |||
| 8 | 67.03 | 71.18 | hFIX exon 8 | ||
| 9 | −50.63 | −24.51 | |||
| 10 | −3.80 | −1.95 | 1 | 11.13 | 52.11 |
| 11 | −12.08 | 0.99 | 2 | 3.56 | 2.00 |
| 12 | −4.83 | −1.95 | 3 | −55.12 | −3.00 |
| 13 | −3.80 | 14.11 | 4 | 15.43 | 32.93 |
| 14 | −0.81b | 0.01b | 5 | −41.01 | −57.68c |
| 15 | −10.05 | −2.89 | 6 | −35.14 | −57.34 |
| 16 | 1.22 | 4.09 | |||
| 17 | 2.20 | 4.02 | |||
| 18 | 72.58 | 79.07 | |||
| 19 | 78.01 | 75.30 | |||
| 20 | 93.44 | 79.23 | |||
| 21 | 28.89 | 0.99 | |||
| 22 | 8.15 | 12.37 | |||
| 23 | 1.19b | 3.03 | |||
Mobility shift is defined as a difference between data point of mutant peak and averaged data point of normal peak. The standard deviations of normal DNAs are gyrA sense strand, 0.40; gyrA antisense strand, 0.01; hFIX exon 7 sense strand, 0.46; hFIX exon 7 antisense strand, 0.10; hFIX exon 8 sense strand, 0.40; hFIX exon 8 antisense strand, 0.63.
False negative (within 3× s.d. of normal DNA)
A minor peak was observed at 0.04, presumably attributable to an isoconformer.
Effects of Electrophoretic Conditions on Mobility Shift
Mobility of single-stranded DNA in gel-based SSCP analysis is known to change by changing temperature of electrophoresis. The effects of temperature are supposed to be attributable to temperature-dependence of conformation of single-stranded DNA. We examined the extent of the effects and how they influence the sensitivity in the electrophoretic system used in this study.
The commercially available electrophoretic system is equipped with a heating plate that keeps the capillary at a constant set temperature above ambiance. However, it is not suitable for subambient operation. Therefore, we used a prototype instrument version that utilizes an external temperature-controlled waterbath that allowed samples to be run at subambient temperatures.
Using this modified electrophoretic apparatus, we examined the effects of running temperatures on mobility shifts of mutants of gyrA, hFIX exon 7, and hFIX exon 8 (Fig. 2a–c, respectively). As seen in Figure 2, mobility shifts are highly dependent on temperature, but good separation was seen between 20°C and 30°C. In this temperature range, standard deviation of mobility of normal DNA varied between 0.01 and 0.72, but no systematic change was seen. Also, all of the mutant fragments showed significant mobility shifts greater than three times the standard deviation of the normal DNA at least in some temperature range.
Figure 2.
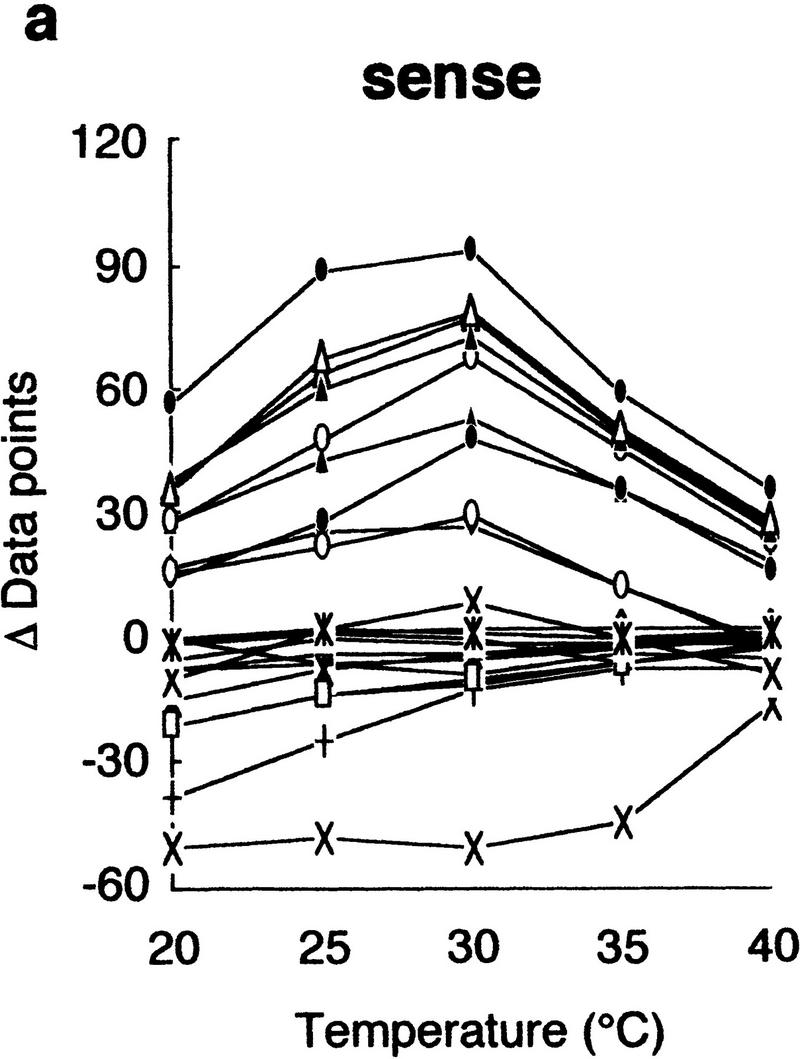
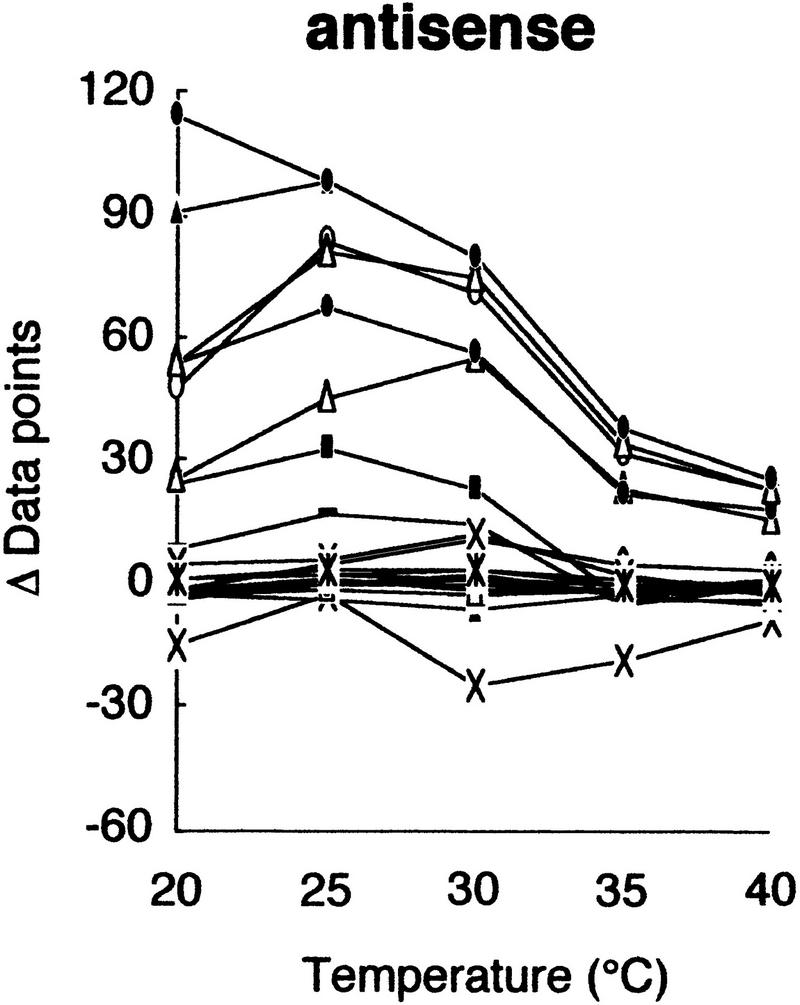


Effects of temperature on mobility shift. Three sequence contexts, i.e., gyrA (a), hFIX exon 7 (b), and hFIX exon 8 (c), were analyzed at indicated temperatures using 3% GeneScan Polymer buffered with 1× TBE and 10% glycerol. The mobility shifts were estimated as described in the text.
We then examined the influences of polymer concentrations on the separation. Because of the relatively high viscosity of the polymer solutions at high percentages, the practical range of concentrations was between 0 and 3% (Fig. 3). The results clearly indicated better resolution of mutant fragments at higher concentrations of the polymer, and diminished separation without the polymer. An essentially linear relationship in polymer concentration versus mobility, and convergence of the mobility to unity at 0% polymer, demonstrates that the hydrodynamic size of the molecule is the major factor determining separation (Rodbard and Chrambach 1973).
Figure 3.
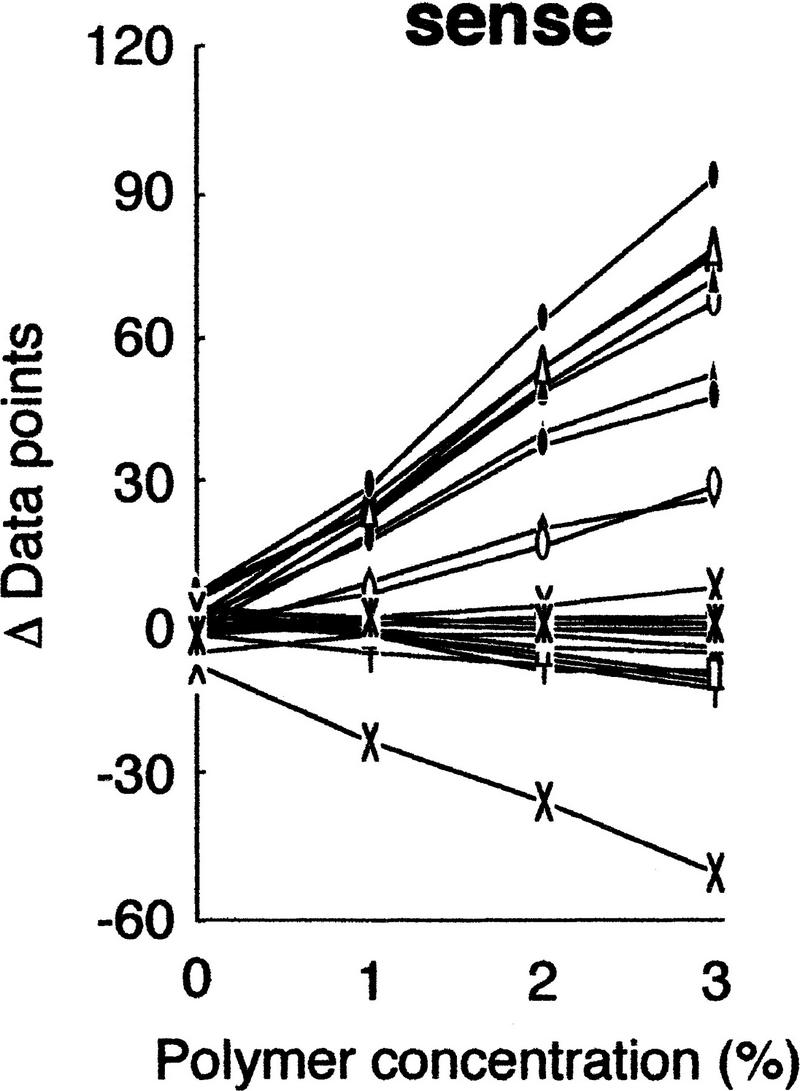
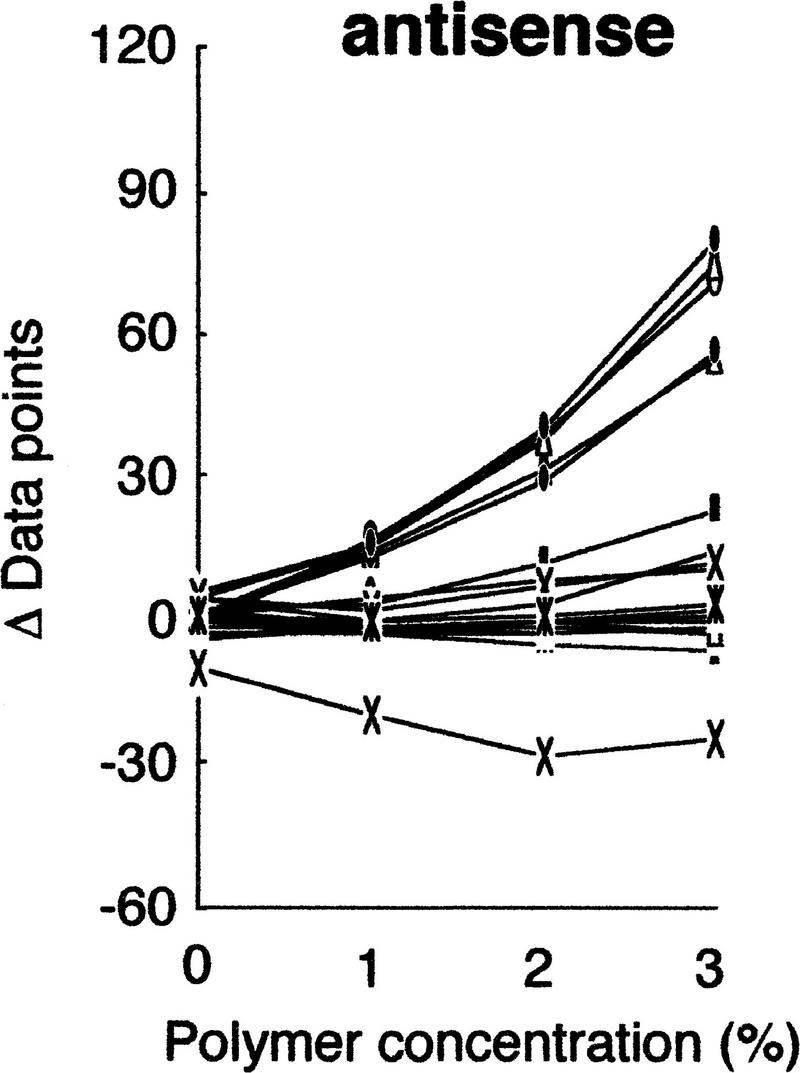
Effects of polymer concentration on separation. gyrA mutants were analyzed in various concentrations of GeneScan polymer at 30°C. The mobility shifts were estimated as described in the text, except for the shift at 0% polymer, which was obtained without run-to-run correction because peaks of internal control DNAs could not be identified.
DISCUSSION
Improvement in the methodology of large-scale mutation screening is essential for effective use of rapidly accumulating sequence information of the human genome in biomedical research or clinical diagnostics. A wide range of new mutation detection methods is emerging, including improvements of pre-existing methods (Landegren 1996) and innovative developments, most of them detecting sequence changes in PCR-amplified target segments of the genome. A remarkable innovation in this field is the development of DNA chip technology and its use in parallel hybridization analysis for high-throughput mutation detection (Chee et al. 1996). The experimental procedures are simplified, and computational algorithm for objective interpretation of the results is likely to be developed soon. However, at present, the cost for the analysis per sample is unclear, especially because repeated use of the chips is still uncertain.
Among the most frequently used mutation detection techniques is SSCP, which demands less skill relative to other methods, with the exception of polyacrylamide gel electrophoresis, which is a routine procedure in nucleic acid research. However, casting of gel and loading of samples are skill-demanding and cumbersome procedures, making conventional SSCP unsuitable for a large-scale mutation screening. A logical solution to overcoming these disadvantages is to use an automated capillary electrophoretic system, which has become available as a result of sophistication of sequencing technology. In this system, a replaceable separation matrix is used, and operations including expelling/refilling of the matrix, electrokinetic loading of samples, and separation are automated, so that the cumbersome steps required in gel-based electrophoresis are totally eliminated.
In the automated capillary electrophoretic system, DNAs are detected by fluorescence, and so the sample DNAs must be fluorescently labeled. The one-tube post-PCR labeling protocol described previously and modified here for multicolor labeling of amplified DNA effectively simplified the labeling procedure; that is, amplified DNAs were terminally labeled with fluorescent dNTPs, and unincorporated nucleotides were degraded by phosphatase treatment in the same tube as used for the PCR, simply by successive addition of appropriate reagents.
Multicolor detection capability of the electrophoretic system employed here enabled precise calibration of mobilities of normal DNA between runs, which was crucial for sensitive detection of mobility shifts of sample DNA. Owing to the high resolution of the capillary electrophoresis and also to the reproducibility of mobility as a result of this calibration method (standard deviation is usually less than one data point), the sensitivity was remarkably increased, and the length limit of the analysis was significantly extended from <300 bp in conventional SSCP to at least 740 bp in the present system. Further accumulation of data is needed to estimate an upper limit of the size range at which this technique sensitively detects mutations in a diverse sequence context. Employing other electrophoretic conditions, such as new separation matrices or other buffer conditions, for example, a low pH buffer system (Kukita et al. 1997), may increase sensitivity and also extend the length limit of the analysis further.
Digitized output of peak positions made it possible to statistically evaluate mobility shifts, and the entire procedure, including determination of the presence or absence of mutations in the sample DNA, was done with minimal human intervention. A divergent sensitivity of the conventional SSCP has been reported, and at least a part of the discrepancy is attributable to lack of common and objective criteria to determine whether there are mobility shifts or not. Thus, blind testings, that is, performing analysis without informing investigators whether the samples were control or mutant, have been adopted in some studies to assess the sensitivity of the method. In this study mobilities were statistically evaluated and their presence or absence was determined objectively at a known confidence level. Thus, blind samples are not necessary for reducing subjectivity. Objectiveness is essential, for example, for mutation detection in clinical diagnostics.
Separation of mutant fragments in gel-based, as well as capillary-based, SSCP analysis is sensitive to temperature, as shown previously and demonstrated in this report. So, strict control of temperature during electrophoresis is essential for obtaining reproducible results. The original electrophoretic apparatus (ABI PRISM 310) has a built-in regulated heating system that is sufficient to control the capillary at ∼5°C above room temperature or higher but obviously not suitable for operation below. The prototypic cooling unit employed here enabled, in principle, operations at any desired temperature. However, the practical temperature range is likely to be between 5°C below and 10°C above room temperature to avoid condensation and to obtain stable results. Also, mobility shifts of many mutant fragments seem to be reduced dramatically if analyzed at 40°C or above (Fig. 3). Mobilities are influenced by the room temperature, because ∼11 cm of the capillary is exposed outside the temperature-control unit. But the influence is usually subtle, and does not critically affect determination of the presence or absence of mutations because normal DNA is run under the same conditions.
Turnaround time in the present system is ∼20 min per sample per machine, including replacement of matrix, sample loading, and separation. Thus, the maximum number of samples analyzable per machine is ∼70 per day. This figure can be increased by multiplexing the analysis using several different dyes. Loading a mixture of DNA fragments with different mobility ranges in one run is another possibility of multiplexing. Finally, the strategy developed here, that is, post-PCR labeling, use of normal DNA as an internal control for normalization of run-to-run (or lane-to-lane) variation, and statistical determination of mobility shift, is directly exportable to SSCP in capillary array or high-throughput multilane gel electrophoresis systems.
METHODS
DNA and PCR Amplification
Nalidixic acid-resistant mutant and wild-type strains of B. subtilis were grown overnight at 37°C by shaking in 1 ml of 1% Nutrient Broth (Difco) supplemented with 0.02% MgSO4 and 0.1% KCl in 12-well microtiter plates. The cells were collected by centrifugation and suspended in 50 μl of M9 buffer containing 15% glycerol and stored at −80°C until DNA extraction as described previously (Munakata et al. 1995). A 592-bp fragment, corresponding to nucleotides 164–755 of the coding region of gyrA gene, was amplified by PCR using primers indicated in Table 1 in 5 μl as described previously (Hayashi et al. 1997). The cycling profile was 1 min at 94°C for initial heating, followed by 30 cycles of 30 sec at 94°C for denaturation, 30 sec at 55°C for annealing, and 60 sec at 72°C for extension. After the cycle, the mixture was further incubated at 72°C for 7 min.
The genomic DNA of hemophilia B patients carrying mutations in the corresponding regions were supplied by S.S. Sommer. Because of limitations in the amount of sample DNA, the PCR products of the target regions obtained as described previously (Kukita et al. 1997) were reamplified by 30 cycles of 30 sec at 94°C, 30 sec at 50°C, and 120 sec at 72°C using primers indicated in Table 1.
Post-PCR Two-Dye Fluorescence Labeling
Five microliters of the PCR product was mixed with an equal volume of 4 μm R6G–dCTP, 4 μm R110–dUTP, and 0.2 U/μl of Klenow fragment of DNA polymerase I in 10 mm Tris-HCl (pH 8.7) and 20 mm MgCl2, and incubated at 37°C for 15 min. The reaction was stopped by adding 1 μl of 0.2 m EDTA, and 1 μl of 2 U/μl of calf intestinal alkaline phosphatase was added. The mixture was incubated at 37°C for 30 min to degrade dNTPs and then diluted by adding 90 μl of formamide. Labeling of PCR products with TAMRA was done using 8 μm TAMRA–dCTP and 8 μm TAMRA–dUTP. Other conditions were as described for labeling with R110 and R6G.
TAMRA-Labeled Size Standards
GS 500 and GS 2500, both labeled with TAMRA, were commercially obtained. TAMRA-labeled TaqαI fragments of pcDNAI were prepared by filling-in reaction of the fragments with Klenow fragment, 40 μm TAMRA–dCTP, and 40 μm each of dATP, dGTP, and dTTP. After the labeling reaction, they were treated with calf intestinal alkaline phosphatase in the presence of 20 mm EDTA. Residual unincorporated TAMRA–dCTP was completely removed by phenol extraction and ethanol precipitation. The fragments were then resuspended in formamide for storage at 4°C. Appropriate size markers were chosen for each sequence context, so that at least two peaks were available on either side of the region of interest in the electropherogram, and none of the peaks coincided with the peaks of TAMRA-labeled normal DNA.
Capillary Electrophoresis
Capillary electrophoresis-based SSCP was performed with an ABI Prism 310 Genetic Analyzer (PE Applied Biosystems, Foster City, CA). A water circulatory apparatus attached to the CE system was started at least 2 hr before electrophoresis when the analysis was performed at <30°C. Other operations were carried out generally following the Genetic Analyzer User’s Manual and GeneScan Chemistry Guide. Commercially obtained capillary (50 μm × 61 cm, Perkin Elmer) was cut to 41 cm and used. The effective length (from cut end to the detector window) of the capillary was 30 cm. Replaceable polymer matrix (GeneScan Polymer) was diluted to make desired concentrations in 1× TBE buffer containing 10% glycerol. The same buffer with glycerol was used in both cathodic and anodic reservoirs. A 2.5 ml glass syringe was used to replace the polymer matrix in the capillary by positive pressure.
The sample and internal control DNAs were added to formamide in a sample tube to make a final volume of 15 μl, heated at 90°C for 3 min, and placed in the sample rack. Concentrations of sample and internal control DNAs in the sample tube were predetermined so that peak height of each fluorescence was between 200 and 1000 arbitrary units of the machine, which corresponded to ∼1–5 fmoles for TAMRA, and one-fourth of this amount for R110 and R6G in 15 μl of 60% to 90% formamide.
The DNAs were injected electrokinetically for 5 sec at 15 kV, and separated at the same voltage. Data collection was started 5 min after the beginning of electrophoresis and is set to 50 msec of integration time followed by 20 msec idle time.
We found that mobilities of peaks were frequently unstable for the first two or three runs, presumably because the temperature of the capillary had not reached equilibrium. Therefore, normal DNAs were applied for the first five runs to confirm reaching steady state. An additional five runs including the last run were devoted to normal DNA, which served for the estimation of standard deviation of peak positions of normal DNA.
Acknowledgments
We thank Dr. N. Munakata for his kind gift of B. subtilis gyrA mutants and their sequence information, Dr. S.S. Sommer for hemophilia B patient DNA carrying hFIX mutations, M. Galvin for inspiring this work, and M. Hane, M. Phillips, and others in PE Applied Biosystems for collaboration. This work was supported by Grants-in-Aid for Scientific Research on Priority Areas (Cancer), and for Scientific Research on Priority Areas (Genome) from the Ministry of Education, Science, and Culture of Japan.
The publication costs of this article were defrayed in part by payment of page charges. This article must therefore be hereby marked “advertisement” in accordance with 18 USC section 1734 solely to indicate this fact.
Footnotes
E-MAIL khayashi@gen.kyushu-u.ac.jp; FAX 81 92 632 2375.
REFERENCES
- Chee M, Yang R, Hubbell E, Berno A, Huang XC, Stern D, Winkler J, Lockhart D, Morris MS, Fodor SPA. Accessing genetic information with high density DNA arrays. Science. 1996;274:610–614. doi: 10.1126/science.274.5287.610. [DOI] [PubMed] [Google Scholar]
- Ellison J, Dean M, Goldman D. Efficacy of fluorescence-based PCR-SSCP for detection of point mutation. BioTechniques. 1993;15:684–691. [PubMed] [Google Scholar]
- Felmlee TA, Oda RP, Persing DA, Landers JP. Capillary electrophoresis of DNA potential utility for clinical diagnoses. J Chromatogr B. 1995;717:127–137. doi: 10.1016/0021-9673(95)00491-2. [DOI] [PubMed] [Google Scholar]
- Hayashi K, Yandell DW. How sensitive is PCR-SSCP? Hum Mutat. 1993;2:338–346. doi: 10.1002/humu.1380020503. [DOI] [PubMed] [Google Scholar]
- Hebenbrock K, Williams PM, Karger BL. Single strand conformational polymorphism using capillary electrophoresis with two-dye laser-induced fluorescence detection. Electrophoresis. 1995;16:1429–1436. doi: 10.1002/elps.11501601236. [DOI] [PubMed] [Google Scholar]
- Inazuka M, Tahira T, Hayashi K. One-tube post-PCR fluorescent labeling of DNA fragments. Genome Res. 1996;6:551–557. doi: 10.1101/gr.6.6.551. [DOI] [PubMed] [Google Scholar]
- Iwahana H, Yoshimoto K, Mizusawa N, Kudo E, Itakura M. Multiple fluorescence-based PCR-SSCP analysis. BioTechniques. 1994;16:296–305. [PubMed] [Google Scholar]
- Iwahana H, Adzuma K, Takahashi Y, Katashima R, Yoshimoto K, Itakura M. Multiple fluorescence-based PCR-SSCP analysis with postlabeling. PCR Methods Applic. 1995;4:275–282. doi: 10.1101/gr.4.5.275. [DOI] [PubMed] [Google Scholar]
- Kukita, Y., T. Tahira, S.S. Sommer, and K. Hayashi. 1997. SSCP analysis of long DNA fragments in low pH gel. (in press). [DOI] [PubMed]
- Kuypers AW, Williams P, vander Schans M, Linssen P, Wessels H, de Bruijn C, Everaerts F, Mensink D. Detection of point mutations in DNA using capillary electrophoresis in a polymer network. J Chromatogr. 1993;621:149–156. doi: 10.1016/0378-4347(93)80090-q. [DOI] [PubMed] [Google Scholar]
- Landegren U. Mutation detection now and later. In: Landegren U, editor. Laboratory protocols for mutation detection. Oxford, UK: Oxford University Press; 1996. [Google Scholar]
- Makino R, Yazyu H, Kishimoto Y, Sekiya T, Hayashi K. F-SSCP: Fluorescence-based polymerase chain reaction-single-strand conformation polymorphism (PCR-SSCP) analysis. PCR Methods Applic. 1992;2:10–13. doi: 10.1101/gr.2.1.10. [DOI] [PubMed] [Google Scholar]
- Munakata N, Morohashi F, Saitou M, Yamazaki N, Hayashi K. Molecular characterization of thirteen gyrA mutations conferring nalidixic acid resistance in Bacillus subtilis. Mol & Gen Genet. 1994;244:97–103. doi: 10.1007/BF00280192. [DOI] [PubMed] [Google Scholar]
- Orita M, Suzuki Y, Sekiya T, Hayashi K. Rapid and sensitive detection of point mutations and DNA polymorphisms using the polymerase chain reaction. Genomics. 1989;5:874–879. doi: 10.1016/0888-7543(89)90129-8. [DOI] [PubMed] [Google Scholar]
- Oto M, Suehiro T, Yuasa Y. Identification of mutated p53 in cancer by non-gel-sieving capillary electrophoretic SSCP analysis. Clin Chem. 1995;41:1787–1788. [PubMed] [Google Scholar]
- Rodbard D, Chrambach A. Unified theory for gel electrophoresis and gel filtration. Proc Natl Acad Sci. 1970;65:970–977. doi: 10.1073/pnas.65.4.970. [DOI] [PMC free article] [PubMed] [Google Scholar]
- Yoshitake S, Schach BG, Foster DC, Davie EW, Kurachi K. Nucleotide sequence of the gene for human factor IX (antihemophilic factor B) Biochemistry. 1985;24:3736–3750. doi: 10.1021/bi00335a049. [DOI] [PubMed] [Google Scholar]