

Abstract
We have demonstrated previously that noncoding sequences of genes are a robust source of polymorphisms between mouse species when tested using single-strand conformation polymorphism (SSCP) analysis, and that these polymorphisms are useful for genetic mapping. In this report we demonstrate that presumptive 3′-untranslated region sequence obtained from expressed sequence tags (ESTs) can be analyzed in a similar fashion, and we have used this approach to map 262 loci using an interspecific backcross. These results demonstrate SSCP analysis of genes or ESTs is a simple and efficient means for the genetic localization of transcribed sequences, and is furthermore an approach that is applicable to any system for which there is sufficient sequence polymorphism.
The recognition that single-pass sequencing of the ends of randomly chosen cDNAs can be an efficient means for the identification and mapping of genes has proven a remarkable stimulus for mammalian gene discovery (Adams et al. 1991; Wilcox et al. 1991; Berry et al. 1995). Powerful tools for informatic analysis have made databases containing these expressed sequence tags (ESTs) easily accessible, and has facilitated ordering the partial sequences obtained from these analyses into larger contigs corresponding, in many cases, to full-length cDNAs (Adams et al. 1995; Boguski and Schuler 1995). Given the importance of genetic map information for the consideration of genes as candidates for mutations and diseases, an efficient means for determining the genetic map position of ESTs would considerably enhance their present utility (Khan et al. 1992).
We have shown previously that single-stranded conformational polymorphism (SSCP) analysis can be used to detect sequence differences between mouse strains and species (Beier et al. 1992; Beier 1993). SSCP analysis is done simply by denaturing amplified PCR products and analyzing them on a nondenaturing acrylamide gel (Orita et al. 1989). The observed migration of the single strands is a function both of their length and of their sequence (presumably as a consequence of internal secondary structures that are stably formed). It has been shown clearly that SSCP analysis is a sensitive technique that can efficiently detect as little as a single base change. It is furthermore easily learned and requires no special apparatus or reagents, making it a readily transferable technology.
Here we demonstrate that this strategy can be used for the genetic mapping of ESTs, using as a template the presumptive 3′-untranslated region (UTR) adjacent to the poly(A) tail of directionally cloned cDNAs. From a set of over 900 ESTs, as well as 175 sequences from the GenBank database, we tested 738 primers for SSC polymorphisms, and found that >70% were polymorphic between C57BL/6J and Mus spretus. Some 262 loci were mapped on the Jackson BSS interspecific backcross (Rowe et al. 1994). These loci are positioned with a high degree of confidence relative to flanking microsatellite markers, and therefore can be readily assessed as candidate loci in positional cloning studies.
RESULTS
Two sources of sequence data were used for primer design. Initial studies utilized the set of full-length gene sequences deposited in the GenBank database, and 175 primers were designed and tested for SSC polymorphisms. Because the extraction of the sequences, the identification of the noncoding region, and the formatting of this sequence for primer design proved inefficient, we also pursued an analysis of ESTs. To this end, >1500 colonies were picked from a mass-excised cDNA library made from brain cDNA that was oligo(dT)-primed and directionally cloned in the Bluescript phagemid vector. This population was chosen for analysis because it is sufficiently heterogeneous such that redundancy would not likely be a problem. Single-pass sequence was obtained from both the 5′ and 3′ ends of >900 of these cDNAs. Clones containing mouse B1 or B2 repeat sequences, or not containing a 3′ poly(A) tail sequence, were eliminated from further study. Both 5′ and 3′ sequences from the remaining clones were searched for homology to known genes using the BLASTn and BLASTx programs. Sequences without identity to known genes were deposited in the dbEST database. Primers were selected using an automated analysis of EST sequences with Primer 0.5 software as described in Methods.
The primers were tested on a standard set of DNAs that included five inbred laboratory strains of Mus musculus (AKR/J, C57L/J, C3H/FeJ, C57BL/6J, and DBA/2J) and two different mouse species, Mus castaneus and M. spretus. The inbred strains were chosen because they are the progenitors of several of the most well-characterized RI panels (AKXD, AKXL, BXH, and especially BXD). The two different species were used because they are those most commonly employed for interspecific crosses. Table 1 shows the polymorphism frequency for 623 of the primers tested.
Table 1.
Frequency of SSC Polymorphisms between Selected Murine Inbred Strains and Species
| Percent | ||||
| AK × D | B × H | AK × L | B × D | B × Sp |
|---|---|---|---|---|
| 17 | 15 | 13 | 17 | 71 |
Polymorphism data were tabulated for 623 of the 738 primer pairs tested and the percentage of this subset that have polymorphisms readily scored by SSCP analysis are shown. The strains compared are AKR/J vs. DBA/2J (AK × L), C57BL/6J vs. C3H/FeJ (B × H), AKR/J vs. C57L/J (AK × L), C57BL/6J (B × D), and C57BL/6J vs. M. spretus (B × Sp).
Primers found to be polymorphic between C57BL/6J and M. spretus DNAs were then analyzed using the BSS interspecific backcross. The 94 progeny DNAs of the BSS cross and the two parental control samples could be analyzed on a single sequencing-type gel (Fig. 1). Genotypes were recorded and map positions were assigned using the Mapmanager program as described in Methods. Relative map positions of the mapped loci with respect to microsatellite markers typed in the BSS cross are shown in Figure 2. Table 2 includes for each mapped locus its symbol, full name, sequence accession number, clone number (for ESTs), and primer pair used for mapping analysis. Genotype data for all loci can be accessed through the Backcross DNA Panel Mapping Resource directory of the Jackson Laboratory (http://www.jax.org/resources/documents/cmdata).
Figure 1.

SSCP analysis of two EST-derived PCR amplification products in the BSS interspecific backcross. The two control lanes [(B) C57BL/6J; (S) M. spretus] and a subset of the 94 BSS progeny are shown.
Figure 2.
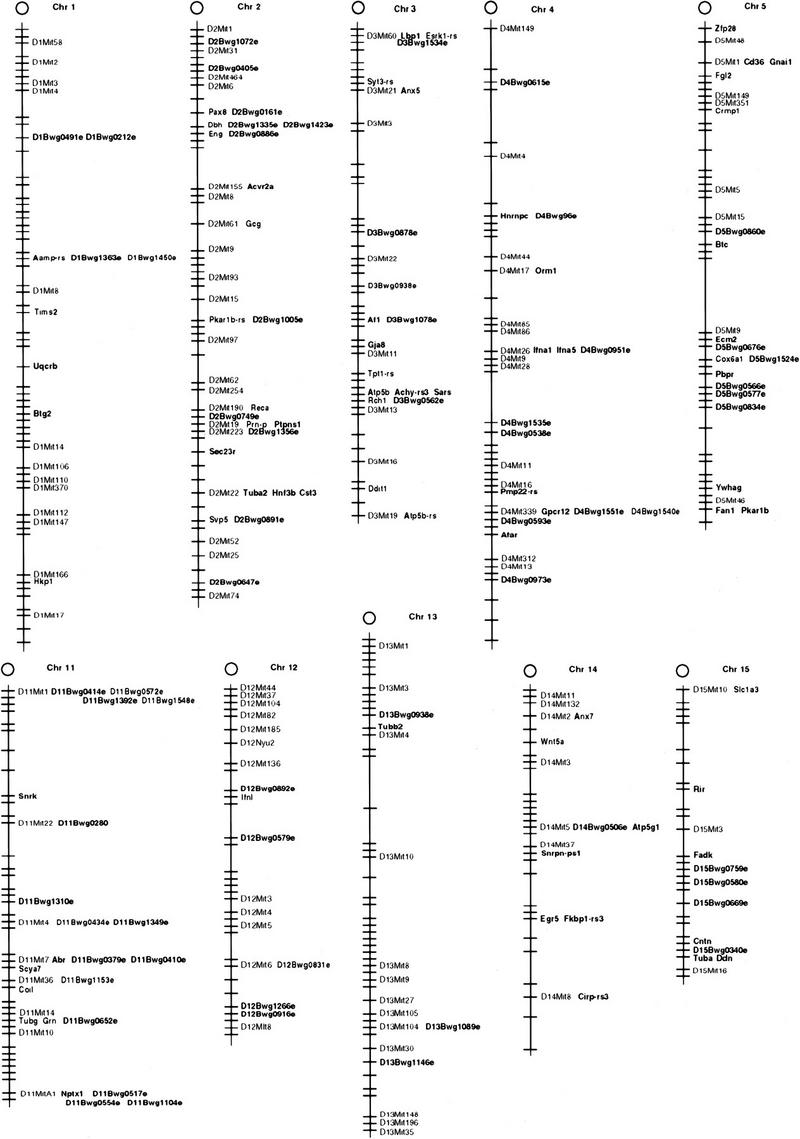
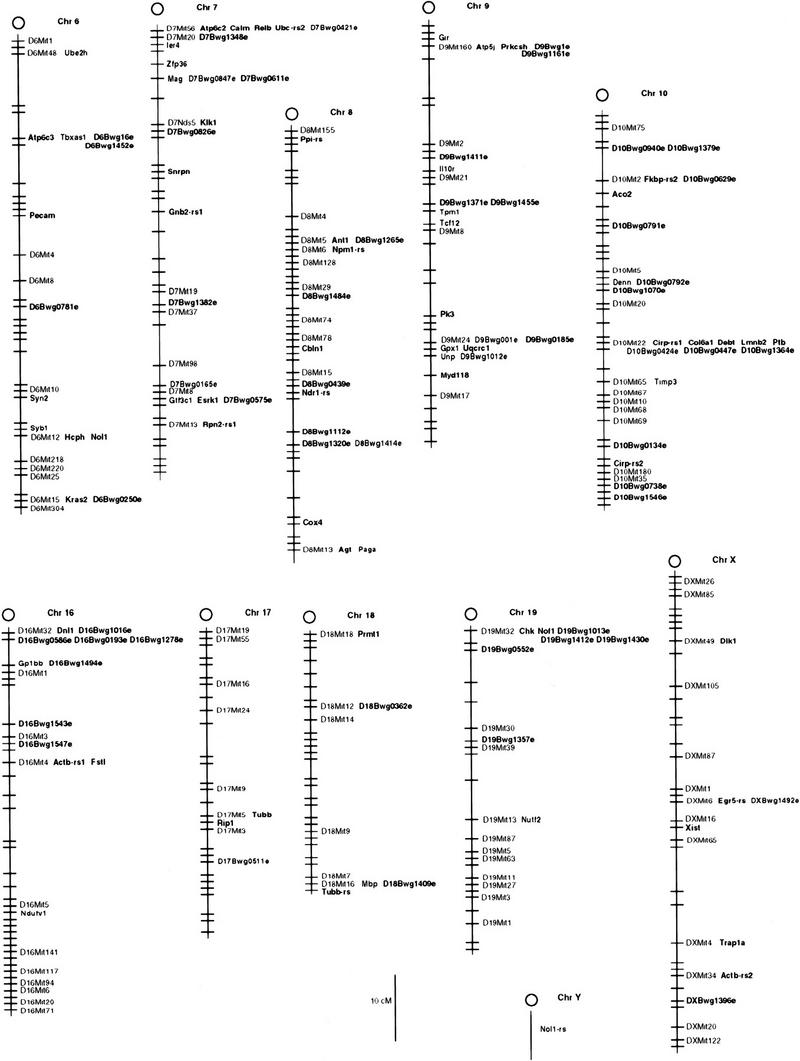
Map positions of loci mapped in the BSS interspecific backcross using SSCP analysis. All maps are drawn to the 10 cM scale shown near Chr 3. Closest hatch marks in the maps are 1.1 cM apart (representing one recombinant out of 94 backcross progeny). Hatch marks indicate all positions at which one or more loci are mapped in the public BSS database (see http://www.jax.org/resources/documents/cmdata). Only loci mapped in this study (shown in boldface text) and MIT SSLP markers are labeled. For the sake of compactness only single MIT SSLP markers mapped in this cross are shown where there are multiple loci cosegregating.
Table 2.
Portion of Loci Mapped in the BSS Cross
| Chr | Symbol | Full name | Primer | Accession no. |
|---|---|---|---|---|
| 1 | D1Bwg0491e | A325 | R75342 | |
| R75343 | ||||
| 1 | D1Bwg0212e | A178 | R74885 | |
| R74886 | ||||
| 1 | Aamp-rs | angio-associated migratory cell protein-related sequence | A256 | (M95627*) |
| R75012 | ||||
| R75013 | ||||
| 1 | D1Bwg1363e | A667 | N28105 | |
| N28106 | ||||
| 1 | D1Bwg1450e | A709 | N28140 | |
| 1 | Tims2 | transforming immortalized mammary-2 | A210 | R74947 |
| A218 | R74948 | |||
| A490 | R74968 | |||
| R74969 | ||||
| R74722 | ||||
| R74723 | ||||
| 1 | Uqcrb | ubiquinol–cytochrome c reductase-binding protein | A545 | L06665*** |
| R75090 | ||||
| R75091 | ||||
| 1 | Btg2 | B-cell translocation gene 2 | A282 | M64292 |
| 1 | Hkp1 | housekeeping protein 1 | A500 | M74555 |
| 2 | Hnf3b | hepatocyte nuclear factor-3β | A028 | L10409 |
| 2 | Ptpns1 | protein tyrosine phosphatase, nonreceptor type substrate 1 | A226 | D87968 |
| R74984 | ||||
| R74985 | ||||
| 2 | Acvr2a | activin receptor IIA | A148 | M93400 |
| 2 | Tuba2 | tubulin, α2 | A295 | M28727 |
| 2 | D2Bwg0405e | A253 | R75003 | |
| R75004 | ||||
| 2 | Dbh | dopamine β-hydroxylase | A141 | S50200 |
| 2 | Pax8 | paired box gene-8 | A136 | X57487 |
| 2 | Reca | recombination and repair of radiation damage, RAD51 homolog | A014 | D13473 |
| 2 | D2Bwg0647e | A385 | R75455 | |
| R75456 | ||||
| 2 | Prn-p | prion protein | A422 | M13685 |
| 2 | D2Bwg0749e | A426 | R75544 | |
| R75545 | ||||
| 2 | D2Bwg0886e | A490 | R74718 | |
| R74719 | ||||
| 2 | D2Bwg0891e | A482 | R74724 | |
| R74725 | ||||
| 2 | D2Bwg1005e | A539 | R75076 | |
| R75076 | ||||
| 2 | D2Bwg1072e | A563 | R75123 | |
| R75123 | ||||
| 2 | Eng | endoglin | A532 | X77952 |
| 2 | Cst3 | cystatin 3 | A520 | |
| A634 | ||||
| A654 | ||||
| 2 | D2Bwg1335e | A653 | R75291 |
Accession nos. beginning with N or R identify ESTs without clear homology to known genes. For ESTs with homology, the accession no. of the ortholog is shown. These orthologs are of murine origin with the exception of those marked by (*) human ortholog; (**) rat ortholog; (***) bovine ortholog. For loci that are nonorthologous-related sequences, the accession nos. appear in parentheses. Primer sequences can be obtained from D.R. Beier. Table 2 in its entirety can be found under online supplements at http://www.genome.org.
Assignment of locus names was done in consultation with the Mouse Nomenclature Committee. The extensive availability of on-line genetic resources, including MGD, OMIM, dbEST, and GenBank, proved indispensible in this effort. For each cDNA, the full length of single-pass sequence obtained from both the 3′ and the 5′ ends (which generally corresponded to between 300 and 400 bp each) was used to search the sequence databases. By setting a high level of nucleotide identity (P < 1.0−15) as a criterion for determining homology, we feel we are correctly labeling ESTs we have cloned as corresponding to known genes. This likelihood is further increased because this identity is often found in the 3′ UTR, where nucleotide sequence variation is not functionally constrained by coding requirements. The high degree of sequence specificity that is apparent in 3′ UTR, and their utility for the identification of true orthologs in cross-species comparisons, has been described (Makalowski et al. 1996). ESTs that do not clearly correspond to a known gene are identifed using the recommended nomenclature for expressed sequences (Davisson 1996): D (for DNA)—chromsome (chr) number—Bwg (for Brigham and Women’s Genetics)—identifying number (our cDNA clone no.)—e (for expressed) (e.g., D1Bwg0123e).
DISCUSSION
In this report we have demonstrated that the frequency of polymorphism detectable by SSCP analysis is sufficiently high in 3′ UTRs of transcribed genes such that this PCR-based technique is an efficient method of mapping genes in the mouse. We also have shown here that SSCP analysis is particularly well suited for genetic mapping of ESTs, because the sequences immediately preceding the poly(A) tail are usually untranslated and have proven a robust source of gene-specific polymorphism. The advantages of utilizing the presumptive 3′ UTR obtained from directionally cloned cDNAs as templates for STS primer design has been noted previously (Wilcox et al. 1991; Berry et al. 1995). These include the fact that these sequences rarely contain introns, so cDNA sequence will correspond to genomic sequences; that the identification of a poly(A) tail increases the likelihood that the sequence is derived from a true cDNA; the sequences derived from the region upstream of the poly(A) tail represent a common reference point for gene-to-gene comparison; and that the 3′ UTR is more gene-specific than the 5′ sequence and allows greater discrimination between genes that have related coding regions.
Several observations can be made regarding our EST sequence data. First, as hoped, redundancy did not prove a problem, and only a small number of cDNAs were identified more than once. In addition, about half of the obtained clones do not correspond to a gene of known function. On the other hand, almost every cDNA appears to have a human orthologous clone in the dbEST database (as judged by the identification of a cDNA with a high degree of sequence similarity in the presumptive 3′ UTR). This is not surprising, because brain cDNA has been a major resource for human EST analysis efforts, which now may have identified on the order of half of all transcribed genes in the human genome (Hillier et al. 1996). The identification of human orthologs is very useful for several reasons. Many of these clones have been ordered in contigs of overlapping cDNA sequence, called Unigene sequences (Boguski and Schuler 1995) or tentative human concensus (THC) sequences (Adams et al. 1995). These contigs, which frequently contain full-length coding regions, permit the maximal extraction of information when tested for sequence homologies. Thus murine cDNAs that are not readily identified by sequences in 5′ and 3′ ends may in many cases be assigned a presumptive identity based upon the more extensive sequences available for their human orthologs. Additionally, many of the STSs used for physical mapping studies in humans are presently being derived from ESTs (Hudson et al. 1995; Schuler et al. 1996). This will facilitate the exploration of the correspondence of human and murine chromosomal map positions even for genes of unknown function.
Table 1 shows the results of the SSCP analysis of 623 primer pairs. It is evident that, whereas significant polymorphism can be detected between inbred laboratory strains using this approach, it is less than that found for microsatellites (Dietrich et al. 1994). On the other hand, the polymorphism frequency found between species is quite high. (In fact, given sufficient sequence data, we have never failed to identify a polymorphism between C57BL/6J and M. spretus).
It was desirable to map our gene set such that the map positions could be integrated readily with existing genetic map data. The Jackson Laboratory Backcross DNA Panel Mapping Resource makes available to the scientific community two reciprocal backcrosses between C57BL/6J and M. spretus for mapping all types of genetic loci. Data have been made public for 2686 loci mapped in the BSS cross at the time this report was prepared. These loci define a genetic map of 1360 total centimorgans, anchored with many readily available and well-characterized loci including 277 MIT SSLP loci distributed throughout the map. These characteristics, along with the microtiter format and the ease of entry into the public databases, made this resource the cross of choice to map our set of ESTs.
Figure 2 shows the map of the whole genome from the Jackson BSS backcross with all the loci mapped in this study listed in bold-faced type. Maps were drawn by omitting all single-locus double crossovers, as these are most likely to be technical errors, and inferring missing typings where such inference is unambiguous. In the public BSS data set at this time there are a total of 232 such apparent single-locus double crossovers in a total of 2686 loci, for an estimated data error rate of 0.9 × 10⁻³ double crossovers/genotype. Thirty of these presumptive errors are in the set of SSCP-mapped loci reported here, for an internal error rate of 1.2 × 10⁻³ double crossovers/genotype for this subset. In addition, any missing crossover typings have been arbitrarily assigned to keep the distance between flanking markers correct. There are 56 of such missing data points in the entire BSS data set, for a rate of 2.2 × 10⁻⁴ per genotype, of which 12 are contributed by this EST mapping project, for an internal frequency of 4.9 × 10⁻⁴ per genotype.
The reliability of the map positions can be evaluated by determining the frequency with which localizations using SSCP analysis are consistent with those obtained by independent methods. Because a number of ESTs we identified correspond to known genes, and their map positions were determined without this knowledge (as the mapping was coded by primer sequence, not gene name) we have a reasonably unbiased measure of accuracy. Our accuracy in identifying the correct location of a previously mapped gene is >97%. There are two likely causes for the amplification of polymorphic fragments that do not correspond to the locus used as a sequence template. One cause of error will be pseudogenes, because they may contain the same STSs used for primer design as the expressed sequence homolog. A more common problem is the generation of many amplified products, in which case the polymorphic band may not correspond to the locus of interest, or there may be multiple independently segregating bands. Although this may occur in gene families, even closely related genes have sufficient sequence divergence in their 3′ UTRs such that a sequence-based assay should uniquely identify individual members (unlike a hybridization analysis). In the cases that multiple products are generated it is likely the amplification reaction is insufficiently specific, the result of either reaction conditions or the incorporation of some homology to a repetitive element in the synthesized primers. This can be remedied simply by designing new primers. In fact, independent verification of a map position using two or more different primer pairs has proven that our methods are an extremely reliable way of determining localizations [see, e.g., Cst3 (chr 2), Calm (Chr 7), and Zfp36 (Chr 7) in Table 2].
The necessity of identifying polymorphic alleles makes genetic analysis an inherently less efficient mapping strategy than physical analysis using, for example, radiation hybrid cell lines. In our characterization of murine cDNAs, however, the high frequency of SSC polymorphisms between species demonstrates this is not a significant limitation. Mapping analysis in a genetic cross has the additional virtue of being self-correcting, because genotyping errors resulting in apparent double crossovers in small genetic intervals (which are biologically unlikely) are easily recognized and false allele typings attributable to technical artifact in an assay will not fit the genetic map. This observation is supported by the evidence that the LOD likelihood scores for map positions described in this report are generally >20. Thus it is possible using this strategy to assert with a high degree of confidence that a gene of interest is in a specific interval with respect to flanking genetic markers. Because many classically studied mutations in the mouse are positioned in the genetic map and not the physical map, placing ESTs on the genetic map is valuable information for the consideration of candidate loci in positional cloning analyses.
Finally, it should be noted that this strategy is applicable to any genetic system in which there is sufficient sequence divergence between the progenitor strains used in a genetic cross. For example, we have found that the SSC polymorphism frequency in two different crosses used for genetic studies in zebrafish is between 40% and 50% (data not shown), and other investigators have found the SSC polymorphism frequency between species of pig to be ∼40% (Jorgensen et al. 1997). This suggests that this means of analysis will be particularly useful for investigation of the many species for which physical maps are less well characterized than is the case for humans. Furthermore, because SSCP analysis is PCR-based, the same primers used for genetic studies can be used for physical mapping analysis as well, which provides a ready means for the integration of these two systems.
METHODS
Sequence Analysis and Primer Selection
More than 1500 colonies were picked from a mass-excised cDNA library made from brain cDNA that was oligo(dT)-primed and directionally cloned in the Bluescript phagemid vector. Single-pass sequence was obtained from both the 5′ and 3′ ends of >900 of these cDNAs, using the M13 Reverse and Universal sequencing primers, respectively. Cycle-sequencing was done on a Perkin Elmer GeneAmp System 9600 using flourescent PRISM dye-primer kits and electrophoresed on an ABI373A automated sequencer. The selection of primer pairs was automated on a Unix workstation running PRIMER 0.5 software (Lincoln et al. 1991). A customized utility was used to retrieve sequences and to test primer pairs according to standardized criteria: PCR product size, 100–350 bp; GC content, 40%–60%; melting temperature, 50°–62°C (optimal 55°C), and oligonucleotide length, 18–22 bp. Primers were obtained from Research Genetics, Inc. Primer pair names are listed in Table 2, and primer sequences are available from the author.
Genetic Mapping
The primers were tested for SSC polymorphisms on a standard set of DNAs that included five inbred laboratory strains of M. musculus (AKR/J, C57L/J, C3H/FeJ, C57BL/6J, and DBA/2J) and two different mouse species, M. castaneus and M. spretus.
Both primers were radiolabeled with 32P using polynucleotide kinase according to standard protocols and genomic fragments were amplified by PCR (anneal at 55°C for 1 min, extend at 72°C for 2 min, and denature at 94°C for 1 min for 40 cycles, with a final extension at 72°C) using 250 ng of template DNA. Two microliters of the amplified reaction was added to 8.5 μl of USB (U.S. Biochemical Corp.) stop solution, denatured at 94°C for 5 min, and immediately placed onto ice. Two microliters of each reaction was loaded onto a 6% nondenaturing acrylamide sequencing-type gel and electrophoresed in 0.5× TBE buffer for 2–3 hr at 40 W in a 4°C room. The gel was then transferred to filter paper, dried, and exposed overnight without using intensifying screens. In cases where subtle polymorphisms could be detected but not readily resolved, the reaction products were electrophoresed using MDE polymer (AT Biochem) according to the manufacturer’s instructions.
Genetic mapping was done using genotype analysis of the 96 DNA samples of the Jackson BSS backcross panel that include 94 backcross progeny from the cross (C57BL/6JEi × SPRET/Ei) F1 × SPRET/Ei with C57BL/6JEi and SPRET/Ei parental controls (Rowe et al. 1994). These were reoriented in a 96-well plate so that the amplified products from a corresponding plate could be loaded sequentially on a 0.4-mm-thickness sequencing-type gel using a Hamilton syringe-type multipipettor (which loads every third well). Thirty nanograms of each of these DNAs was then aliquoted into working plates, which were then allowed to air-dry. Because the DNA is dried, the entire reaction mix (32P-kinase-labeled primers, buffer, and Taq polymerase) could be added together using a multipettor with little chance of cross-well contamination. This protocol lends itself readily to the use of a robotic workstation, and our most recent analyses were done using a Biomek 2000. After the reaction was completed an aliquot from each well was denatured and electrophoresed as described above. Examples of the strain distribution patterns (SDPs) obtained are shown in Figure 1. These were scored and recorded using the MapManager 2.6 program (Manly 1993). Map positions were determined using this program by comparison with other SDPs in the BSS database and the data examined for double-crossovers. These were then corrected or verified, and the data entered into the public domain database. Our results are not coded for privacy and are made immediately available. Data in the BSS cross can be accessed through the Backcross DNA Panel Mapping Resource directory of the Jackson Laboratory (http://www.jax.org/resources/documents/cmdata) or the MGD database (http://www.informatics.jax.org).
Acknowledgments
We thank Holly Dushkin, Todd Telle, Nikki Walter, Mary Barter, and Lois Maltais for their help in these studies. This work was supported by HG00951 to D.R.B. and HG00941 to The Jackson Laboratory Backcross DNA Mapping Resource.
The publication costs of this article were defrayed in part by payment of page charges. This article must therefore be hereby marked “advertisement” in accordance with 18 USC section 1734 solely to indicate this fact.
Footnotes
E-MAIL beier@rascal.med.harvard.edu; FAX (617) 232-4623.
REFERENCES
- Adams M, Kelley J, Gocayne J, Dubnick M, Polymeropoulos M, Xiao H, Merril C, Wu A, Olde B, Moreno R. Complementary DNA sequencing: Expressed sequence tags and human genome project. Science. 1991;252:1651–1656. doi: 10.1126/science.2047873. [DOI] [PubMed] [Google Scholar]
- Adams, M. et al. 1995. Initial assessment of human gene diversity and expression patterns based upon 83 million nucleotides of cDNA sequence. Nature (Suppl.) 377:3–174. [PubMed]
- Beier DR. Single-strand conformation polymorphism (SSCP) analysis as a tool for genetic mapping. Mamm Genome. 1993;4:627–631. doi: 10.1007/BF00360898. [DOI] [PubMed] [Google Scholar]
- Beier DR, Dushkin H, Sussman DJ. Mapping genes in the mouse using single strand conformation polymorphism analysis of recombinant inbred strains and interspecific crosses. Proc Nat Acad Sci. 1992;89:9102–9106. doi: 10.1073/pnas.89.19.9102. [DOI] [PMC free article] [PubMed] [Google Scholar]
- Berry R, Stevens T, Walter N, Wilcox A, Rubano T, Hopkins J, Weber J, Goold R, BentoSoares M, Sikela J. Gene-based sequence-tagged sites (STSs) as the basis for a human gene map. Nature Genet. 1995;10:415–423. doi: 10.1038/ng0895-415. [DOI] [PubMed] [Google Scholar]
- Boguski MS, Schuler GD. ESTablishing a human transcript map. Nature Genet. 1995;10:369–371. doi: 10.1038/ng0895-369. [DOI] [PubMed] [Google Scholar]
- Davisson MT. Rules and guidelines for gene nomenclature. In: Lyon MF, Rastan S, Brown SDM, editors. Genetic variants and strains of the laboratory mouse. Oxford, UK: Oxford University Press; 1996. pp. 1–16. [Google Scholar]
- Dietrich W, Miller JC, Steen RG, Merchant M, Damron D, Nahf R, Gross A, Joyce DC, Wessel M, Dredge RD, et al. A genetic map of the mouse with 4,006 simple sequence length polymorphism. Nature Genet. 1994;7:220–245. doi: 10.1038/ng0694supp-220. [DOI] [PubMed] [Google Scholar]
- Hillier LD, Lennon G, Becker M, Bonaldo MF, Chiapelli B, Chissoe S, Dietrich N, DuBuque T, Favello A, Gish W, et al. Generation and analysis of 280,000 human expressed sequence tags. Genome Res. 1996;6:807–828. doi: 10.1101/gr.6.9.807. [DOI] [PubMed] [Google Scholar]
- Hudson T, Stein L, Gerety S, Ma J, Castle A, Silva J, Slonim D, Baptista R, Kruglyak L, Xu S, et al. An STS-based map of the human genome. Science. 1995;270:1945–1954. doi: 10.1126/science.270.5244.1945. [DOI] [PubMed] [Google Scholar]
- Jorgensen C, Wintero A, Yerle M, Fredholm M. Mapping of 22 expressed sequence tags isolated from a porcine small intestine cDNA library. Mammal Genome. 1997;8:423–427. doi: 10.1007/s003359900460. [DOI] [PubMed] [Google Scholar]
- Khan A, Wilcox A, Polymeropoulos M, Hopkins J, Stevens T, Robinson M, Orpana A, Sikela J. Single pass sequencing and physical and genetic mapping of human brain cDNAs. Nature Genet. 1992;2:180–185. doi: 10.1038/ng1192-180. [DOI] [PubMed] [Google Scholar]
- Lincoln S, Daly M, Lander E. PRIMER: A computer program for automatically selecting PCR primers, version 0.5. The Whitehead Institute for Biomedical Research; 1991. [Google Scholar]
- Makalowski W, Zhang J, Boguski M. Comparative analysis of 1196 orthologous mouse and human full-length mRNA and protein sequences. Genome Res. 1996;6:846–857. doi: 10.1101/gr.6.9.846. [DOI] [PubMed] [Google Scholar]
- Manly K. A Macintosh program for storage and analysis of experimental genetic mapping data. Mammal Genome. 1993;4:303–313. doi: 10.1007/BF00357089. [DOI] [PubMed] [Google Scholar]
- Orita M, Suzuki Y, Sekiya T, Hayashi K. Rapid and sensitive detection of point mutations and DNA polymorphisms using the polymerase chain reaction. Genomics. 1989;5:874–879. doi: 10.1016/0888-7543(89)90129-8. [DOI] [PubMed] [Google Scholar]
- Rowe L, Nadeau J, Turner R, Frankel W, Letts V, Eppig J, Ko M, Thurston S, Birkenmeier E. Maps from two interspecific backcross DNA panels available as a community genetic mapping resource. Mammal Genome. 1994;5:253–274. doi: 10.1007/BF00389540. [DOI] [PubMed] [Google Scholar]
- Schuler G, Boguski M, Stewart E, Stein L, Gyapay G, Rice K, White RE, Rodriguez-Tome P, Aggarwal A, Bajorek E, et al. A gene map of the human genome. Science. 1996;274:540–546. [PubMed] [Google Scholar]
- Wilcox A, Khan A, Hopkins J, Sikela J. Use of 3′ untranslated sequences of human cDNAs for rapid chromosome assignment and conversion to STSs: Implications for an expression map of the genome. Nucleic Acids Res. 1991;19:1837–1843. doi: 10.1093/nar/19.8.1837. [DOI] [PMC free article] [PubMed] [Google Scholar]