

Abstract
Large numbers of expressed sequence tags (ESTs) continue to fill public and private databases with partial cDNA sequences. However, using this huge amount of ESTs to facilitate gene finding in genomic sequence imposes a challenge, especially to wet-lab scientists who often have limited computing resources. In an effort to consolidate the information hidden in the vast number of ESTs into a readable and manageable format, we have developed EbEST—a program that automates the process of using ESTs to help delineate gene structure in long stretches of genomic sequence. The EbEST program consists of three functional modules—the first module separates homologous ESTs into clusters and identifies the most informative ESTs within each cluster; the second module uses the informative ESTs to perform gapped alignment and to predict the exon–intron boundary; and the third module generates text file and graphic outputs that illustrate the orientation, exonic structure, and untranslated regions (UTRs) of putative genes in the genomic sequence being analyzed. Evaluation of EbEST with 176 human genes from the ALLSEQ set indicated that it performed in-line with several existing gene finding programs, but was more tolerant to sequencing errors. Furthermore, when EbEST was challenged with query sequences that harbor more than one gene, it suffered only a slight drop in performance, whereas the performance of the other programs evaluated decreased more. EbEST may be used as a stand-alone tool to annotate human genomic sequences with EST-derived gene elements, or can be used in conjunction with computational gene-recognition programs to increase the accuracy of gene prediction.
[EbBEST is available at http://EbEST.ifrc.mcw.edu]
One of the challenges the Human Genome Project faces is to identify genes from the megabase sequences it generates every day. Some recent studies (Smith et al. 1996; Ansari-Lari et al. 1997) have shown that predicting genes de novo via computation has only a limited success in large scale genome analysis and by use of expressed sequence tags (ESTs) significantly improves the power of computational gene discovery, owing to the phenomenal growth in EST sequences. One way of taking advantage of ESTs is to integrate computation-based gene prediction with homologous EST alignment into a single program, a model the developers of GRAIL and GeneID are pursuing. Alternatively, a stand-alone program that defines gene elements only from EST analysis can also be valuable to general genome annotation and to bench scientists who want to have a thorough analysis over a specific region of the genome. Genotator (Harris 1997) and PowerBlast (Zhang and Madden 1997) have built-in functions to annotate genomic sequences with homologous EST “hits” and even provide results of Smith–Waterman alignment. However, tagging genomic sequence with EST hits may generate rather complicated patterns that are not easy to evaluate, and the EST tags quickly become overwhelming and a full spectrum of Smith–Waterman analysis proves very time consuming when a large number of EST hits are returned. Therefore, there is a need to develop a specialized tool that can define the fine structure of a gene from ESTs in an acceptable time frame and consolidate the information into easily readable and manageable format, the goal set for the EbEST program introduced in this paper.
The Program
EbEST is designed to automate EST-based gene analysis on uncharacterized human genomic sequences. It aims at facilitating gene discovery by extracting as much gene structure information as possible from ESTs. But it is not a computation-based gene finding program, because it does not use the statistic features of gene elements to compute exons and build gene models. The default thresholds are for human EST sequence on human genomic sequence. Investigators wishing to use EbEST in a cross-species analysis may do so by changing the thresholds and specifying the species used. However, we have not established ideal thresholds for this purpose in this release of EbEST.
The EbEST algorithm (Fig. 3, below) uses two programs, RepeatMasker and Cross_Match, which are accessible from the EbEST web server. EbEST is currently provided as a web server (http://EbEST.ifrc.mcw.edu). Two databases, dbEST at NCBI and TIGR’s human transcript (HT) database, are searchable. HT is included to cover known cDNAs that are not ESTs.
Figure 3.
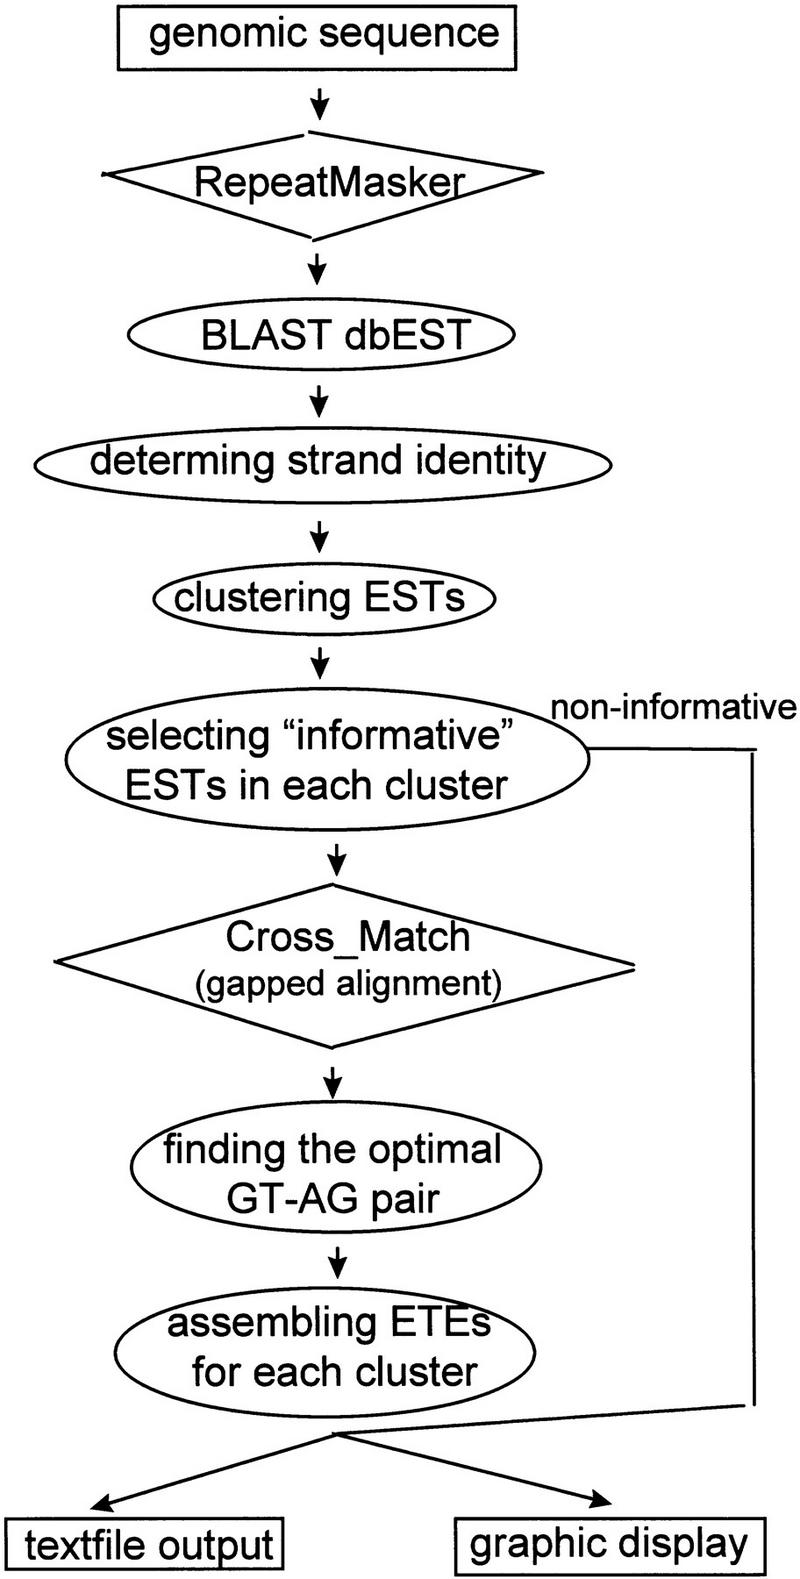
Algorithms implemented in EbEST.
We have evaluated EbEST, using the 176 human genes from the ALLSEQ set developed by Burset and Guigo (1996) and the LongSeq set developed in house. The LongSeq set was built to provide a more realistic sample of long genomic sequences. We compared the performance of EbEST with that of several gene finding programs to determine the relative strength and weakness of the EST-based approach versus computation-based gene prediction. It needs to be noted that the two approaches can be integrated, and we would expect to see the new versions of some gene prediction programs having some functional unit to use EST information as well.
RESULTS
EbEST Performance at Nucleotide Level
First, we evaluated EbEST using 176 human genes in the ALLSEQ set (Burset and Guigo 1996), each sequence of which contains one complete gene. In addition to the original ALLSEQ set, Burset and Guigo also provided an ALLSEQ dataset with 1% sequencing errors that generate a reading frame shift. EbEST was tested with both the original and the mutated data sets.
Figure 1 compares the perfomance of EbEST at the nucleotide level to that of FGENEH, GeneID+, GeneParser3, and GRAIL2. The data for other gene prediction programs were ported from Burset and Guigo (1996) but recalculated on the basis of 176 human genes used in the current study. GENSCAN was not included for this comparison, because Burge and Karlin (1997) reported that it has only a marginal performance lead over the other programs used in this comparison using the original ALLSEQ set. EbEST predicted 51% of the exonic nucleotides with a 93% specificity. The lower sensitivity is expected, considering the fact that ESTs are only partial sequences of a gene and are biased toward highly expressed genes. EbEST lost little sensitivity (43%) or specificity (93%) when the mutated data set was used. This is in contrast to the other programs that had a significant drop in both sensitivity and specificity in the mutated sequences. It needs to be noted, however, that a new version of GRAIL has a built-in function to detect reading frameshift errors prior to other computation and should improve its performance.
Figure 1.

Exon prediction evaluated at the nucleotide level, by use of the 176 ALLSEQ human genes as test case. The data for FGENEH, GeneID+, GeneParser 3, and GRAIL 2 were cited and recalculated from Burset and Guigo (1996). (Sn and Sp) Sensitivity and Specificity, respectively. Both the original (unmutated) and the sequences with 1% reading frameshift (mutated) were tested.
EbEST Performance at the Exonic Level
Defining the exact exon–intron boundaries is a significantly greater challenge for computer prediction programs. Table 1 shows the performance of the five programs tested at the exonic level. The specificity of all five programs were reduced, in comparison with the performance at the nucleotide level. The sensitivity of EbEST was again lower than that of other programs when tested with original sequences. However, the performance of EbEST was virtually not changed when the mutated data set was used, whereas the specificity and sensitivity of other programs dropped significantly. The net result is that EbEST had much higher accuracy when challenged with mutated sequences. Impressively, EbEST has the lowest rate of wrong exon (WE), suggesting that when EbEST predicts an exon, it is very likely to be real.
Table 1.
Exon Prediction Evaluated at the Exonic Level, Using the 176 ALLSEQ Human Genes as Test Case
| Unmutateda | Mutateda | |||||||
|---|---|---|---|---|---|---|---|---|
| Sn | Sp | ME | WE | Sn | Sp | ME | WE | |
| FGENEH | 0.71 | 0.68 | 0.11 | 0.15 | 0.31 | 0.34 | 0.28 | 0.20 |
| GeneID+ | 0.69 | 0.65 | 0.09 | 0.18 | 0.27 | 0.26 | 0.27 | 0.30 |
| GeneParser 3 | 0.61 | 0.61 | 0.11 | 0.14 | 0.34 | 0.41 | 0.28 | 0.11 |
| Grail 2 | 0.49 | 0.53 | 0.19 | 0.13 | 0.24 | 0.27 | 0.32 | 0.13 |
| EbEST | 0.37 | 0.58 | 0.43 | 0.02 | 0.31 | 0.53 | 0.43 | 0.08 |
(Sn) Sensitivity; (Sp) specificity. The data for FGENEH, GeneID+, GeneParser 3, and Grail 2 were cited and recalculated from Burset and Guigo (1996). (For details, see Methods.)
Identification of 3′ UTRs
3′ ESTs generated from oligo(dT)-primed cDNA libraries very often represent the 3′ termini of genes, whereas 5′ ESTs may be derived from anywhere in a gene. This feature makes ESTs particulary useful in mapping the 3′ termini of genes. If the 3′ and 5′ ESTs from a single gene can be linked together (i.e., Washington University–Merck EST project sequence clones from both ends), the 5′ EST can be used to further extend the gene region. EbEST identifies 3′ ESTs on the basis of their location within a cluster and the annotation that the EST comes from a 3′-library. For the 176 ALLSEQ human genes tested, EbEST identified 71% of 3′ UTRs with 92% accuracy. As with the other metrics of performance, it was not dramatically altered by the presence of sequence errors. The sensitivity was 64% and the specificity was 90% when the mutated sequences were used. Identification of 3′ UTR provides critical information that can be used for gene modeling, particularly in long stretches of genomic sequence.
Predicting Gene Structure within Long Stretches of Genomic Sequence
As more and more genomic sequence is generated, the ability to predict multigene models will become increasingly important. Therefore, we developed the LongSeq collection, each sequence of which contained between two and six experimentally confirmed genes. Not all of the programs can manage such long stretches of sequence and we were only able to test GRAIL, FGENEH, and GENSCAN. When the gene modeling function was selected, GRAIL and FGENEH predicted only one gene for each of the 15 sequences in the LongSeq set, whereas GENSCAN was able to build discrete gene models over long sequences. A representative example is shown in Figure 2. The genomic sequence is 100,000 bp long and contains at least six complete genes; however, GRAIL and FGENEH built only one huge gene across the sequence. GENSCAN built four gene models that overall correspond well with the real gene structure, but combined two other nearby genes into a single one. Interestingly, by use of ESTs, EbEST flagged correctly the occurrence of 3′ UTR for all six genes.
Figure 2.
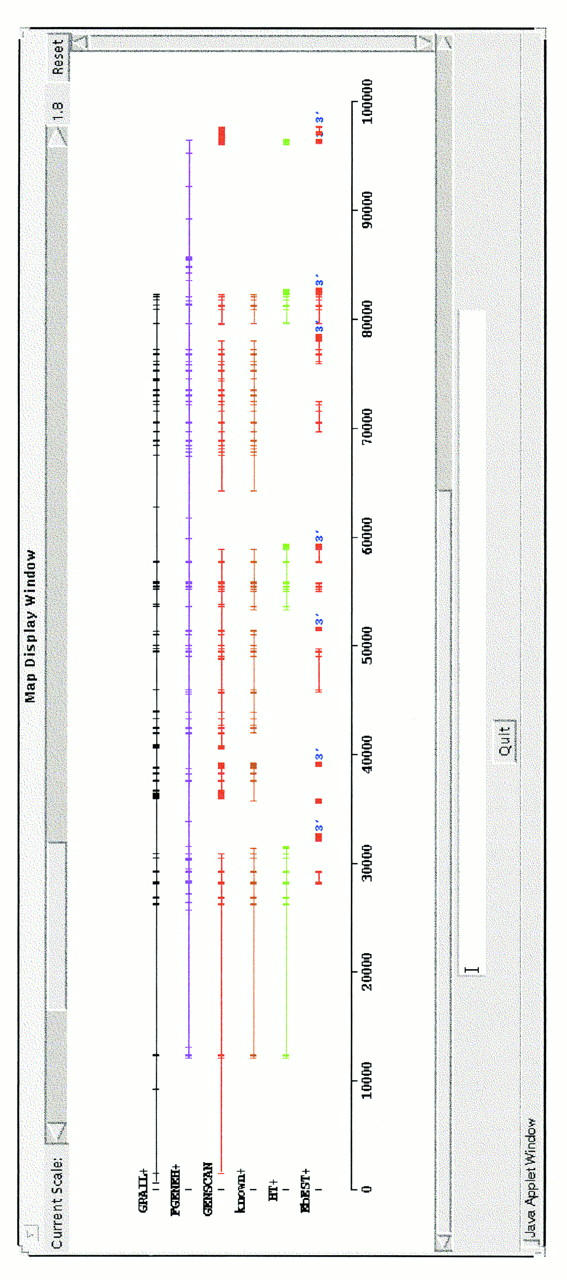
Gene modeling on a 100-kb sequence from 12p13 (Ansari-Lari et al. 1997). (+) The upper strand. This 100-kb contains six known genes (known+). (HT+) Genes that were mapped by use of the TIGR’s Human Transcript database. (3′) The left-most exon is pinpointed as the 3′ end of a gene by EbEST. Exons from a gene model are chained.
The results of exon prediction are summarized in Table 2. GRAIL and FGENEH were evaluated without their gene modeling function, whereas GENSCAN was evaluated on the basis of the gene models it built. Without the gene-modeling process, the ability of GRAIL and FGENEH to predict exons was significantly reduced, in comparison with the prediction done on the 176 ALLSEQ human genes. With its ability to recognize gene boundaries, GENSCAN outperformed GRAIL and FGENEH. The sensitivity of EbEST was lower than that of GRAIL, FGENEH, and GENSCAN, but its specificity at nucleotide level was notably higher than the others. Furthermore, whereas GRAIL and FGENEH could not identify gene boundaries correctly when challenged by the LongSeq set, GENSCAN mapped 60% of 3′ terminals of the 45 genes with a specificity of 63% and EbEST mapped 62% of all the 3′ UTRs with a specificity of 88%.
Table 2.
Exon Prediction, Using the LongSeq Set as Test Case
| Genes | Nucleotidea | Exona | |||||
|---|---|---|---|---|---|---|---|
| Sn | Sp | Sn | Sp | ME | WE | ||
| FGENEH | 45 | 0.54 | 0.69 | 0.36 | 0.46 | 0.13 | 0.17 |
| xgrail_1.3c | 45 | 0.50 | 0.72 | 0.33 | 0.49 | 0.34 | 0.17 |
| GENSCAN | 45 | 0.74 | 0.70 | 0.67 | 0.65 | 0.08 | 0.24 |
| EbEST | 45 | 0.32 | 0.90 | 0.24 | 0.55 | 0.53 | 0.02 |
(Sn) Sensitivity; (Sp) specificity. All calculations were performed on the basis of 45 experimentally confirmed genes in these 15 sequences. (For details, see Methods.)
DISCUSSION
With >1.3 million ESTs available from public dbEST, of which ∼850,000 are human, and a coverage of >50% human genes (Adams et al. 1995; Hillier et al. 1996), various efforts have been made to use ESTs to aid gene discovery. For example, PowerBlast (Zhang and Madden 1997), a versatile and extremely powerful BLAST search engine, not only annotates submitted sequences with EST hits, but also provides an elegant graphic tool to enlist detailed high scoring segment pair (HSP) alignments (or Smith–Waterman alignments, if the option is chosen) for each homologous EST (Zhang and Madden 1997). Genotator provides some similar function (Harris 1997). However, the outputs of these programs are often rather complicated to review and Smith–Waterman alignment often proves too time consuming to run through when long genomic sequences are applied. EST_GENOME (Mott 1997) is another example. It is a handy tool of aligning homologous ESTs to genomic sequence to identify exons. But it lacks a friendly user interface (the user needs to isolate homologous ESTs on their own first) and a graphic view tool. What was accomplished in the creation of EbEST is a tool that is easy to use, time-efficient, and yet robust enough to handle long stretches of genomic sequence, and one that generates output that is manageable by scientists who might not have substantial computing power.
To evaluate EbEST, two sets of sequences were used as test cases: one is the 176 human genes in the ALLSEQ set developed by Burset and Guigo (1996), and the other is the LongSeq set of 15 sequences generated in-house. Because most of the sequences in the LongSeq set were generated by genome sequencing effort, the composition of genes in this set should be less biased toward highly expressed genes and, therefore, provide a more realistic test case for the raw sequences that are being generated by the genome sequencing projects. As the evaluation data revealed, ESTs currently available from dbEST at NCBI could be used to derive about half of all the exonic nucleotides in the 176 human genes in the ALLSEQ set and 32% in the LongSeq genes.
Redundancy is one of the major problems of using ESTs to find genes in genomic sequences. When a large number of homologous ESTs are returned, it is time-consuming to evaluate the detailed listing of HSPs or local alignments, especially for many wet-lab scientists who have a limited bioinformatics infrastructure and/or experience in genome analysis. Furthermore, although retrieving and performing Smith–Waterman alignment on all homologous ESTs may be practical for analyzing a few genomic sequences, it is not acceptable for a tool that is designed to automate homologous EST analysis on genomic sequences, like EbEST. The EbEST program reduces the workload of Smith–Waterman alignment by clustering ESTs into nonoverlapping groups and selecting informative ESTs within each cluster. Consequently, EbEST can manage to use the full dbEST and still deliver results of EST analysis in an acceptable time frame. Separating ESTs into nonoverlapping clusters provides some estimation about how many genes there are in the sequence. However, different EST clusters do not necessarily represent different genes. It is possible that a clone was sequenced from both 5′ and 3′ ends, and the sequences did not overlap with each other, resulting in two clusters representing a single gene. One way to detect this is to take advantage of the fact that the Washington University–Merck EST project sequences most clones from both ends, and ESTs generated by this project make up >50% of all human ESTs in dbEST (Hillier 1996). The documentation for the sequencing pairs may be used to link separate clusters of a single gene together.
ESTs are error-prone in nature, because they are generated from single-read sequences with minimal to no editing, resulting in insertions, deletions, or substitutions at a rate of 1% or higher in ESTs (Aaronson et al. 1996; Wolfsberg and Landsman 1997). As illustrated in Results, sequencing error does not impose a serious problem for the performance of EbEST, largely because the Smith–Waterman algorithm used can tolerate these types of errors (Smith and Waterman 1981). However, there are other errors that potentially confound the homologous EST analysis on genomic sequences, such as inverted clones, nonspecific priming, annotation mistakes, or intronic or intergenic sequence contamination. As EbEST uses the strand identity of ESTs to predict on which strand a putative gene resides, inverted clones or simply incorrectly annotated clones will cause EbEST to assign a gene to the wrong strand. Within the 176 human genes, EbEST mapped 39 genes on both strands with nearly the same exonic structure (data not shown). Because all genes in the ALLSEQ collection reside on the forward strand, the genes mapped on the opposite strand are likely to be caused by inversion-induced error. In fact, 31/39 sequences have many times more ESTs on the forward strand versus the reverse strand, with an average ratio of 20:1, confirming the estimation of the 2%–6% inversion rate found in the Washington University–Merck project (Hillier et al. 1996). The other eight genes have equal or fewer ESTs on the forward strand versus the reverse strand. Whether this is the result of inversion or caused by overlapping of genes on the two strands is not known. However, the same exonic structure on both strands is an obvious clue that there may be a problem.
In addition to defining exonic structure, ESTs are especially useful in mapping 3′ UTRs. Nearly two-thirds of 3′ UTR in the 176 ALLSEQ human genes and in the LongSeq genes was pinpointed by EbEST. The current version of EbEST flagged the occurrence of 3′ external exons on the assumption that ESTs from oligo(dT)-primed cDNA libraries are actually 3′ termini of genes. However, it is known that nonspecific priming occurs during cDNA library construction. The nonspecific priming rate for the ESTs generated by Washington University–Merck is estimated to be 1.5%. The specificity of 3′ UTR mapping by EbEST is ∼10%, suggesting the existence of alternative 3′ ends and annotation errors.
The strength of EST-based analysis in defining 3′ UTR is valuable for analyzing long-stretch genomic sequence. The existing computational gene-finding programs are essentially coding a sequence identifier. This might be part of the reason that these programs are stronger in predicting internal, rather than external exons, because many external exons contain small stretches of coding region or, in some cases, no coding sequence at all. If there is only one gene residing in the sequence being analyzed, the power of these programs to build a correct gene model is admirable, as evaluated by Burset and Guigo (1996) using the ALLSEQ set. However, when these programs were challenged with the LongSeq set, their power of gene modeling is decreased. GENSCAN stands out in its category because it has integrated the identification of signal sequences, such as TATA box, Kozak sequence, poly(A) terminal sequence, and so forth, into its calculation. Even with these efforts, the specificity of 3′ prediction of GENSCAN is ∼63%. In comparison, the prediction of 3′ UTR through EST analysis by EbEST has the highest accuracy.
In summary, EbEST automates the procedure of using ESTs to delineate gene structure. By use of real cDNA sequence, its prediction has an impressively low rate of false positives. From the point of view of the experimentalist, this is valuable because the higher the false-positive rate, the more time and effort that is spent in the lab chasing the wrong leads. In conjunction with existing programs, EbEST should help accelerate gene discovery.
METHODS
The Construction of EST-Tagged Exon
The algorithm implemented in the EbEST program is illustrated in Figure 3.
Simple sequence repeats or low complexity sequences commonly found in genomic sequences will yield false homology if not removed. RepeatMasker (A. Smith and P. Green, unpubl.) was installed locally and used to mask the repeats. BLAST was used to identify homologous ESTs. The threshold value was empirically determined with the goal of keeping false positives at a low level while retaining most of the real positives. Because all sequences in our test case are human genes, and most ESTs in dbEST are derived from human cDNA libraries, we found that we could use a relatively high minimum threshold of 100 bp overlap with >90% identity or 60 bp overlap with >95% identity without losing much information (data not shown).
Because many ESTs were generated from oligo(dT) primed cDNA library, their strand orientation may be used to define the strand identity of a putative gene by the following rules: A 5′ EST with a plus/plus alignment or a 3′ EST with a minus/plus alignment flags a forward strand gene; alternatively, a 3′ EST with a plus/plus alignment or a 5′ EST with a minus/plus alignment flags a reverse strand exon. If the orientation cannot be determined (i.e., random-primed cDNA library or poor annotation), the strand identity of the EST-tagged exon (ETE) was classified as unknown. EbEST builds gene models in a strand-specific manner. The strand identity was read from the definition line of GenBank file or BLAST return file.
ESTs that share common HSPs were grouped into a cluster so that clusters do not overlap with each other. Each cluster is treated as an independent unit in the analysis thereafter. Next, EbEST selects the most informative ESTs from each cluster. It starts from the EST that has the highest probability of homology in the BLAST return file, then sequentially adds one EST at a time according to their probability rankings from high to low, assessing whether the EST brings in new HSPs outside the boundary of known HSPs. If so, the EST is included in the informative category. Otherwise, the EST is considered redundant and put into an annotation file. As we experienced, the informative ESTs are often less than five for a single EST cluster.
The informative ESTs are fetched from the NCBI database through its Entrez server, and gapped alignment is performed by Cross_Match (P. Green, unpubl.), which is based on a modified Smith–Waterman algorithm. The Smith–Waterman alignments are fine-tuned to find an optimal GT–AG pair that makes the length of derived cDNA matching the length of the EST while minimizing mismatch. The final exonic structure is determined by extending exonic region from one EST to another. We term these EST-derived exons as EST-tagged exons or ETEs to differentiate them from pure computation-predicted exons. The EST that generated the very first 3′ ETE in a cluster was checked to determine whether it is a 3′ EST. If so, the ETE chains derived from this EST cluster marks the 3′ end of a putative gene.
Finally, EbEST generates a graphic output and a text file report.
Selection of Test Case of Sequences
The ALLSEQ set
The ALLSEQ set, described in detail in Burset and Guigo (1996), consists of 570 genes carefully selected to meet ideal criteria: a single gene within the genomic sequence (<8000 nucleotides), an ATG start site, an identified stop codon, and no splice variants. We used a subset of the ALLSEQ collection (176 human genes) as our test case because ALLSEQ is a mixture of genes from many different species, and selecting a common cutoff value for accepting homology for all the sequences in the collection is inappropriate. Homology mapping with ESTs from different species is possible, but will require implementing different thresholds for declaring homology. Burset and Guigo (1996) also provided a mutated ALLSEQ set with random 1% frameshift errors. Both the original and the mutated were used in the current study. The UTRs were obtained from GenBank files.
The LongSeq Set
To provide a more realistic representation for genomic sequences, we developed the LongSeq set. The criteria for a sequence to be included in the LongSeq set is that it harbors two or more complete genes that are experimentally confirmed. The current collection was obtained by searching GenBank (release 101) and has a total of 15 sequences, representing 45 complete genes. The LongSeq set is available at http://legba.ifrc.mcw.edu/~jjiang/index.htm.
Measures of Performance
The terms and definitions of gene prediction performance described in Burset and Guigo (1996) were used in the current study with slight modification. The accuracy was measured at both nucleotide and exon levels. At the nucleotide level, Sensitivity (Sn) is the proportion of coding nucleotides that have been correctly predicted, and Specificity (Sp) is the proportion of predicted coding nucleotides that are actually coding. At the exonic level, Sn is the proportion of actual exons that are correctly mapped, and Sp is the proportion of predicted exons that are actually correct. An exon is defined to be correctly mapped if it has a correct boundary on both sides. We also calculated the missing exons (MEs) and the wrong exons (WEs). ME is the proportion of true exons that are completely missed by prediction, whereas WE is the proportion of predicted exons that do not correspond with any real exon. The Sn and Sp of 3′ UTR mapping was similarly calculated.
For the 176 human genes from the ALLSEQ set, the accuracy of GRAIL, GeneID+, GeneParser3, and FGENEH was recalculated by use of the original dataset in Burset and Guigo (1996). To keep consistence with the evaluation of Burset and Guigo on the ALLSEQ set, the UTR sequences mapped by ETEs were not included in the calculation of Sn and Sp. ETEs that mapped exons out of the gene boundary (5′ UTR or 3′ polyadenylation signal sequences) were also not included in the calculation.
Even though the sequences in the LongSeq set were heavily studied, they may still harbor genes that are either not identified or not experimentally confirmed. Predicted exons that are out of the boundary of known genes were ignored.
Computational Gene-Finding Programs Evaluated
To evaluate the performance of gene-prediction programs on the LongSeq set, we initially considered including GRAIL2 with Gap3 (Uberbacher et al. 1996), GeneParser3 (Snyder and Stormo 1995), GeneID+ (Guigo et al. 1992), FGENEH (Solovyev et al. 1994), and GENSCAN (Burge and Karlin 1997). GeneID was dropped because it does not perform gene modeling on sequences longer than 50 kb. We could not install GeneParser3 on our Sun workstation, and technical support was not available. FGENEH (and its exon-prediction sibling FEX) was kindly installed by Dr. Solovyev (Baylor College of Medicine, Houston, TX) on our workstation. GRAIL2 with Gap3 was accessed by running the xgrail_1.3c client, which is different from GRAIL2 evaluated in Burset and Guigo (1996) in that it has gene assembly function. GENSCAN was accessed through http://genomic.stanford.edu/GENSCAN.html. The current version of the gene-finding programs evaluated in Burst and Guigo (1996) and in this study did not use EST. However, GeneID, GeneParser3, and FGENEH use protein database to improve performance.
Visualizing the Results of Gene Structure Analysis
A bioWidgets-based Java applet, which was created by the bioWidgets consortium (http://agave.humgen.upenn.edu/bioWidgetsJava), was implemented in EbEST to enable web viewing.
Acknowledgments
This work was supported in part by grants to H.J.J. from the National Institutes of Health (1RO1HL56284-01, 5RO1HL55726-02, 1P50HL54998-02, and 1RO1HL59826-01). We would like to thank Drs. Kwitek-Black and Tonellato for suggestions and comments, and Ms. Majewski for proofreading.
The publication costs of this article were defrayed in part by payment of page charges. This article must therefore be hereby marked “advertisement” in accordance with 18 USC section 1734 solely to indicate this fact.
Footnotes
E-MAIL Jacob@mcw.edu; FAX (414) 456-6516.
REFERENCES
- Aaronson JS, Eckman B, Blevins RA, Borkowski JA, Myerson J, Imran S, Elliston KO. Toward the development of a gene index to the human genome: An assessment of the nature of high-throughput EST sequence data. Genome Res. 1996;6:829–845. doi: 10.1101/gr.6.9.829. [DOI] [PubMed] [Google Scholar]
- Adams MD, Kerlavage AR, Fleischmann RD, Fuldner RA, Bult CJ, Lee NH, Kirkness EF, Weinstock KG, Gocayne JD, White O, et al. Initial assessment of human gene diversity and expression patterns based upon 83 million nucleotides of cDNA sequence. (Suppl.) Nature. 1995;377:3–17. [PubMed] [Google Scholar]
- Ansari-Lari MA, Shen Y, Muzny DM, Lee W, Gibbs RA. Large-scale sequencing in human chromosome 12p13: Experimental and computational gene structure determination. Genome Res. 1997;7:268–280. doi: 10.1101/gr.7.3.268. [DOI] [PubMed] [Google Scholar]
- Burge C, Karlin S. Prediction of complete gene structures in human genomic DNA. J Mol Biol. 1997;268:78–94. doi: 10.1006/jmbi.1997.0951. [DOI] [PubMed] [Google Scholar]
- Burset M, Guigo R. Evaluation of gene structure prediction programs. Genomics. 1996;34:353–367. doi: 10.1006/geno.1996.0298. [DOI] [PubMed] [Google Scholar]
- Guigo R, Knudsen S, Drake N, Smith TF. Prediction of gene structure. J Mol Biol. 1992;226:141–157. doi: 10.1016/0022-2836(92)90130-c. [DOI] [PubMed] [Google Scholar]
- Harris NL. Genotator: A workbench for sequence annotation. Genome Res. 1997;7:754–762. doi: 10.1101/gr.7.7.754. [DOI] [PMC free article] [PubMed] [Google Scholar]
- Hillier L, Lennon G, Becker M, Bonaldo MF, Chiapelli B, Chisoe S, Dietrich N, DuBuque T, Favello A, Gish W, et al. Generation and analysis of 280,000 human expressed sequences tags. Genome Res. 1996;6:807–828. doi: 10.1101/gr.6.9.807. [DOI] [PubMed] [Google Scholar]
- Mott R. EST_GENOME: A program to align spliced DNA sequences to unspliced genomic DNA. Comput Appl Biosci. 1997;13:477–478. doi: 10.1093/bioinformatics/13.4.477. [DOI] [PubMed] [Google Scholar]
- Smith TF, Waterman MS. Identification of common molecular subsequences. J Mol Biol. 1981;147:195–197. doi: 10.1016/0022-2836(81)90087-5. [DOI] [PubMed] [Google Scholar]
- Smith TM, Lee MK, Szabo CI, Jerome N, McEuen M, Taylor M, Hood L, King M. Complete genomic sequence and analysis of 117 kb of human DNA containing the gene BRCA1. Genome Res. 1996;6:1029–1049. doi: 10.1101/gr.6.11.1029. [DOI] [PubMed] [Google Scholar]
- Snyder EE, Stormo GD. Identification of coding regions in genomic DNA. J Mol Biol. 1995;248:1–118. doi: 10.1006/jmbi.1995.0198. [DOI] [PubMed] [Google Scholar]
- Solovyev VV, Salamov AA, Lawrence CB. Predicting internal exons by oligonucleotide composition and discriminant analysis of spliceable open reading frames. Nucleic Acids Res. 1994;22:5156–5163. doi: 10.1093/nar/22.24.5156. [DOI] [PMC free article] [PubMed] [Google Scholar]
- Uberbacher EC, Xu Y, Mural RJ. Discovering and understanding genes in human DNA sequence using GRAIL. Methods Enzymol. 1996;266:259–281. doi: 10.1016/s0076-6879(96)66018-2. [DOI] [PubMed] [Google Scholar]
- Wolfsberg TG, Landsman D. A comparison of expressed sequence tags (ESTs) to human genomic sequences. Nucleic Acids Res. 1997;25:1626–1632. doi: 10.1093/nar/25.8.1626. [DOI] [PMC free article] [PubMed] [Google Scholar]
- Zhang J, Madden TL. PowerBLAST: A new network BLAST application for interactive or automated sequence analysis and annotation. Genome Res. 1997;7:649–656. doi: 10.1101/gr.7.6.649. [DOI] [PMC free article] [PubMed] [Google Scholar]