

Abstract
Several efforts are under way to partition single-read expressed sequence tag (EST), as well as full-length transcript data, into large-scale gene indices, where transcripts are in common index classes if and only if they share a common progenitor gene. Accurate gene indexing facilitates gene expression studies, as well as inexpensive and early gene sequence discovery through assembly of ESTs that are derived from genes that have not been sequenced by classical methods. We extend, correct, and enhance the information obtained from index groups by splitting index classes into subclasses based on sequence dissimilarity (diversity). Two applications of this are highlighted in this report. First it is shown that our method can ameliorate the damage that artifacts, such as chimerism, inflict on index integrity. Additionally, we demonstrate how the organization imposed by an effective subpartition can greatly increase the sensitivity of gene expression studies by accounting for the existence and tissue- or pathology-specific regulation of novel gene isoforms and polymorphisms. We apply our subpartitioning treatment to the UniGene gene indexing project to measure a marked increase in information quality and abundance (in terms of assembly length and insertion/deletion error) after treatment and demonstrate cases where new levels of information concerning differential expression of alternate gene forms, such as regulated alternative splicing, are discovered.
[Tables 2 and 3 can be viewed in their entirety as Online Supplements at http://www.genome.org.]
The exploitation of single-read sequencing from the ends of sufficiently expressed mRNAs (popularly referred to as expressed sequence tags or ESTs; Adams et al. 1991; Okubo et al. 1991; Wilcox et al. 1991) has brought to light the existence of many genes well before the projected completion of the human genome project in the year 2005 and before the completion of sequencing efforts in other organisms (Adams et al. 1992; Matsubara and Okubo 1993; Venter 1993). Additionally, EST data have facilitated large-scale expression studies (Okubo et al. 1992, 1994; Adams et al. 1995). EST sequencing has enabled the construction of a physical map of the human genome (Hudson et al. 1995), as well a gene map that localizes many genes with respect to the markers of the physical map (Schuler et al. 1996). The utility of EST data has also been increased greatly by the establishment of centralized databases (Boguski et al. 1993; Benson et al. 1994).
Because they are primed to hybridize to the poly(A) tail of mRNAs, 3′ ESTs usually capture regions of the mRNA untranslated region (UTR) that have been thought to contain less conservation than the coding regions. The goal has been that genes could then be reliably indexed using the 3′ UTR/EST as a gene fingerprint; however, the vast quantity of EST data and its fragmented nature pose an obstacle to harvesting the full potential from this data source. Hence, several projects are in progress to construct information frameworks, called gene indices, where the EST data and the known gene sequence data can be consolidated and placed in a correct pathologic and mapping context. A few of the more widely known efforts in this area are UniGene (Boguski and Schuler 1995; Schuler et al. 1996) from NCBI; the TIGR Human Gene Index (HGI) from the Institute for Genomic Research (http://www.tigr.org/tdb/hgi/hgi.html); the Merck–Washington University Gene Index (Williamson et al. 1995; Eckman et al. 1998; http://www.merck.com/mrl/merck_gene_index.2.html); and the GenExpress project (Houlgatte et al. 1995). Algorithmically, these projects all comprise some form of cluster analysis where the sequence similarity of ESTs is used to place or link the sequences into index classes. Below, in our discussion on the creation of index classes and the partitioning of class members into subclasses, we use the terms group, class, and cluster interchangeably.
The structures of current gene indexing projects follow one of two patterns. Strict gene indices, of which the primary example is the TIGR HGI, are generally constructed using sequence assemblers (Sutton et al. 1995). These assemblers have stringent matching criterion to join sequences into common classes, and hence they effectively prevent chimerism and contamination from tainting most index groups. On the other hand, this strictness results in a more fragmented representation of the data that often disallows divergent ESTs that sample alternative forms of the same gene to be folded into the same index class (http://www.tigr.org/hgi/hgi_info.html). In HGI these are linked as being splice variants only in those cases where the ESTs match fully sequenced genes with known isoforms in a full-length gene sequence database, the Expressed Gene Anatomy Database (EGAD; White and Kerlavage 1996). In loose gene indexing projects (of which UniGene, Merck Gene Index, and GenExpress are examples) sequences are grouped into common classes if they share overlap above a certain threshold. Sequence similarity searching programs such as BLAST (Altschul et al. 1990), FASTA (Pearson 1990), or variants of the Smith–Waterman algorithm (Schuler et al. 1996) are used to find and quantify sequence overlap. The benefits and drawbacks of loose methods complement the strict methods: A single index class can contain multiple splice forms of the same gene, but chimeras and other artifacts may cause sequences from different genes to be in the same class (Houlgatte et al. 1995). In addition to these gene indexing projects, other tools have been developed that cluster DNA sequence or remove redundancies from sequence sets (Parsons 1995; Grillo et al. 1996). Some of us (J. Burke and W. Hide) are involved in the development of STACKdb, a hybrid approach to gene index construction (see Discussion). Significant research has also been put into the grouping of protein sequence where domain structure complicates the analysis (Sonnhammer and Kahn 1994; Worley et al. 1995; Adams et al. 1996; Sonnhammer et al. 1997).
Several studies have been performed on small data sets of ESTs where corresponding full-length sequence was available (multipass or fully sequenced transcripts, positionally cloned genes, and full-length genomic sequence). These studies noted the presence of chimerism, clone reversal, internal priming, introns, and alternative splicing within groups of transcripts. Error rates were estimated for lane-tracking and chimerism, clone reversal, internal priming, insert size annotation, and other features (Aaronson et al. 1996; Hillier et al. 1996; Wolfsberg and Landsman 1997).
In contrast, our analysis does not assume the availability of full-length sequence. We leverage the fact that the presence of ESTs containing artifacts or that sample polymorphic loci or gene isoforms often introduce sequence that is unalignable (inconsistent) with the rest of an index class. Instead of relying on sequence similarity to known genes for feature detection, these inconsistencies can be used to partition the index class members such that inconsistent transcripts are in different subclasses. Damage is contained when transcripts that are improperly joined due to the presence of artifact are segregated into disparate subclasses. When cDNA library information is associated with subclass membership, the subclass structure becomes a powerful method for candidate gene selection because the library composition of a subclass is often tissue, developmental state, or disease-specific even when the composition of the greater index class is diverse.
RESULTS
Here we detail the behavior of the subpartition and diversity reports analysis when presented with some types of sequencing and cloning errors. To gauge the quality of final consensus after treatment by our method, the increase in assembly length and decrease in insertion and deletion errors is quantified. The rate of fragmentation (singleton clusters) is compared with current gene indexing projects, as well, and results are given from a related analysis schema that attempts to find examples of genes that overlap on opposite strands. Finally, we demonstrate that differential expression tests can be made more sensitive by accounting for polymorphism and regulated alternative splicing.
We choose UniGene as a base gene index due to its high quality, wide acceptance, and convenient cross-listing of mapping and sequence information. The UniGene index clusters are processed individually to extract reliable consensus sequences and to mine novel or tissue-specific isoforms and polymorphisms in the transcript data. Figure 1 shows a schematic of the processing applied to UniGene clusters, and Table 1 details the structure of the data set before and after processing with comparative numbers given for the TIGR HGI. Each UniGene release corresponds to a GenBank release (ftp://ncbi.nlm.nih.gov/repository/UniGene/Hs.info); hence, GenBank version numbers provide a convenient way to refer to UniGene versions. The data set used in this report is primarily UniGene101. When an example of a UniGene cluster is discussed or when statistics are given, the UniGene version number from which they are derived is always stated.
Figure 1.
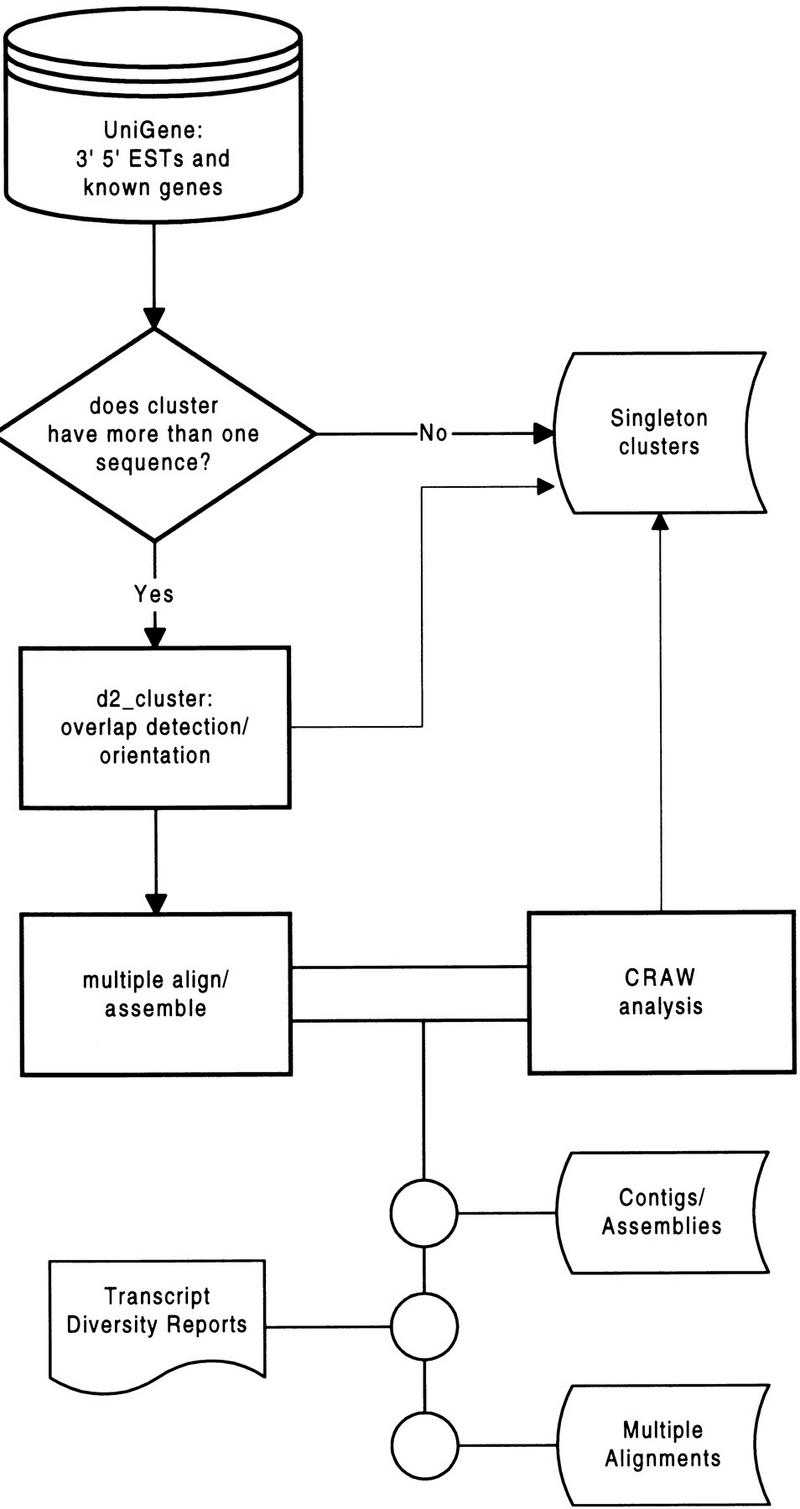
Schematic of UniGene processing.
Table 1.
Structure of UniGene Data Set Before and After CRAW Treatment Is Applied
| UniGene 101 Structure | ||
| 1. 11,751 | multipass/full-length gene sequence | |
| 2. 213,885 | 3‘ ESTs | |
| 3. 270,012 | 5‘ ESTs | |
| 4. 26,995 | other ESTs | |
| 5. 522,643 | total number of sequences subjected to clustering | (= 1 + 2 + 3 + 4) |
| 6. 45,918 | number of index groups resulting from UniGene clustering | |
| Index Structure of UniGene After Treatment with CRAW Analysis | ||
| 7. 9,671 | UniGene clusters that are singletons | (containing 9,671 sequences) |
| 8. 359 | UniGene clusters ignored by this study | (containing 106,810 sequences) |
| 9. 35,888 | remaining UniGene clusters subjected to analysis | (containing 406,162 sequences) |
| 10. 41,268 | non-singleton subgroups resulting from CRAW analysis | |
| 11. 58,070 | singleton subgroups after treatment | (includes 9,671 singleton UniGene clusters from 7) |
| 12. 13.96% | percent singleton sequences | [(100 * 11)/406,162] |
| Index structure of TIGR Gene Index v. 2.3 | ||
| 13. 619,528 | ESTs | |
| 14. 6,635 | HTs | |
| 15. 626,163 | total number of sequences subjected to indexing | (= 13 + 14) |
| 16. 41,268 | THCs (non-singletons) | |
| 17. 135,140 | singleton sequences | |
| 18. 21.81% | percent singleton sequences | (100* 17/15) |
UniGene 101 contained 11,751 gene sequences, 213,885 3‘ ESTs, 270,012 5‘ ESTs, as well as 26,995 EST sequences not classified at 3‘ or 5‘. Of the total 45,918 UniGene 101 clusters, 9,671 were singletons (contained only one transcript). Of the larger clusters, 359 were excluded from our analysis. The remaining 35,888 (=45,918 − 9,671 − 359) clusters were subjected to our processing and from these the CRAW analysis generated 99,338 subgroups, of which 58,070 (including the 9,671 singleton UniGene clusters) were singleton subgroups. A total of 415,833 sequences were input into our analysis so we measure a fragmentation rate of 13.96% (percent of sequences isolated from subgroups = 58,070 × 100/415,833).
For comparative purposes, structure information on TIGR Gene Index is included. The TIGR Gene Index inputs 626,163 sequences and results in 135,140 singletons, a fragmentation rate of 21.81%. The reduced fragmentation rate of the CRAW-processed UniGene 101 is suggestive; however, the comparison is not rigorous because the initial data sets are different and our analysis ignores 359 of the initial 45,918 UniGene clusters.
In processing, for each UniGene cluster, the diversity of the transcripts is analyzed as assembly is performed. The transcript diversity analysis quantifies the within-cluster sequence variation and partitions the cluster into a minimal number of internally consistent subclusters. If further analysis is necessary, the resulting error-resistant assemblies can then be characterized by inspection of transcript diversity reports that show the patterns of similarity between subgroups. The computer program that generates the reports and performs the diversity analysis is called CRAW, a synthesis of two other programs CONF (diversity statistics) and DRAW (visual reports), and we use the term CRAW report for the presented method of visualizing transcript divergence.
Quality Control in Gene Index Construction
Through CRAW processing we attempt to detect and fix artifacts automatically. Realizing that matching gene or genomic sequence is not available for all clusters, it is important that the analysis not rely on the availability of the full gene sequence. To get this functionality the ability to automatically classify the type of error is sacrificed for the ability to automatically detect and correct the error. In the event that a possible error is detected the nature of the error can be explored through inspection of the transcript diversity report (i.e., the CRAW report). Conjecturing the type of artifact when full gene sequence is available is within the scope of other work (Aaronson et al. 1996; Hillier et al. 1996).
Chimerism refers to the artificial fusion of sequences from two different sources and can arise by faulty cDNA cloning or incorrect lane tracking in the sequencing process; we use the term chimeric EST for an EST derived from a chimeric clone. Figure 2 shows 34 sequences in a CRAW report for a cluster from UniGene101. The cluster was automatically partitioned into two consistent subgroups throwing out one sequence (GenBank accession no. AA015595) as being inconsistent with the two established subgroups. Similarity searching with BLAST against the NCBI nucleotide nonredundant database (http://www.ncbi.nlm.nih.gov/BLAST/blast_databases.html) indicates that the second subgroup, consisting of sequences represented by GenBank accession numbers N20971 to AA076342, is highly similar to the 3′ end of mouse mRNA for talin, whereas the first subgroup, consisting of sequences T90923 to AA136000, is identical to the coding region of human tubulin α-6 chain. Sequence AA015595 is a putative chimeric sequence within which the first 110 bases (contained in the first 5 positions of the CRAW report) are moderately similar to the 3′ UTR of mouse talin mRNA. The rest of the sequence is highly similar to human tubulin. Additional evidence that AA015595 is a chimeric EST is that STSs from two different chromosomes have strong matches to the sequence: The first 119 bases match perfectly with STS G03681, which mapped to chromosome 22, and 125 bases in the tubulin matching region are identical to STS G21948, which mapped to chromosome 9. No 5′ end EST is available for this sequence within dbEST. It is important to note that the inconsistency was detected and corrected automatically but that the decision that the error was caused explicitly by chimerism was based on inspection of the CRAW report and analyses of mapping information and sequence similarity with sequences in public databases.
Figure 2.
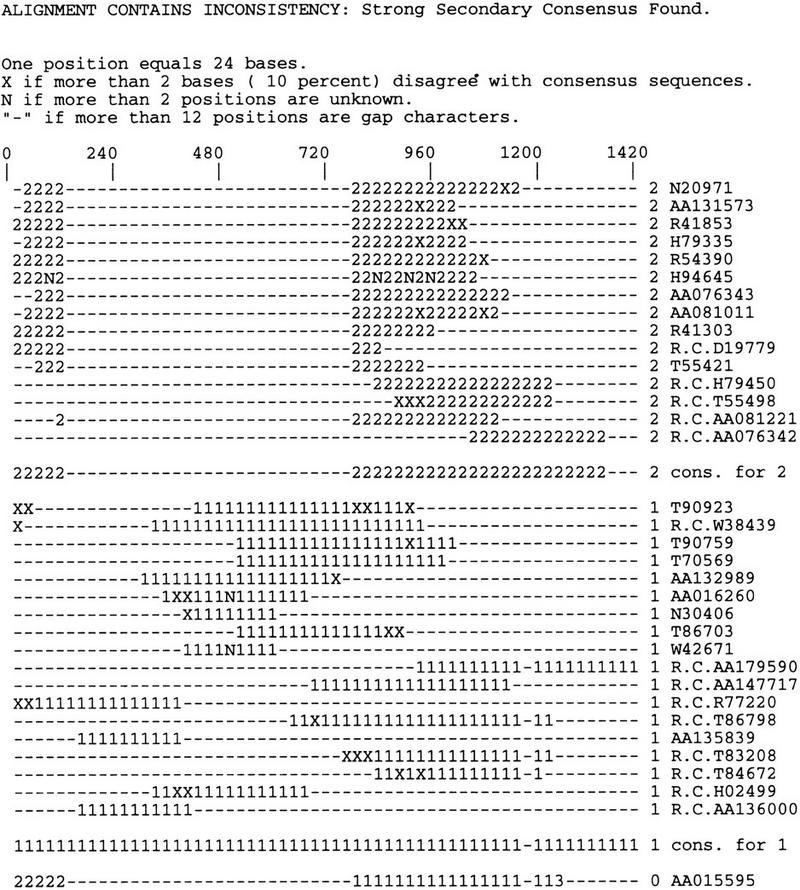
Example of a CRAW report (text format) for a cluster afflicted with EST data derived from a possibly chimeric clone. The 34 sequences shown can be represented as two consensus sequences and an outlier sequence without information loss. The cluster was automatically partitioned into two consistent subgroups showing one sequence (GenBank accession no. AA015595) as being inconsistent with the two established subgroups. Similarity searching with BLAST against the NCBI nonredundant database indicates that the second subgroup, consisting of sequences representing GenBank accession nos. N20971 to AA076342, is highly similar to the 3′ end of mouse mRNA for talin. The second subgroup, sequences T90923 to AA136000 are identical to the coding region of human tubulin α-6 chain. Sequence AA015595 is a putative chimeric sequence within which 110 bases (contained in the first 5 positions of the CRAW report) are highly similar to 3′ UTR of talin mRNA. The rest of the sequence is highly similar to tubulin.
Because clone direction annotations can be mislabeled and due to the error rate present in the directional cloning process, the CRAW analysis does not use the directional or endedness information in automated decision making although this information can optionally be included in the CRAW report for human or further automated analysis. Figure 3A shows the CRAW report for a UniGene101 cluster that contains a clone reversal. The EST AA044777 is labeled as being 5′ but clusters with the 3′ ESTs, is in the same direction, and has a poly(A) tail. Figure 3B shows a UniGene101 cluster where 3′ ESTs align with the 5′ end of a gene. The group contains three gene sequences of human nuclear factor I (NFI) and 10 ESTs. Clone 347657 is oriented in the direction opposite that of clones 415069 and 754600 so it is possible that a clone inversion event exists; however, 3′ ESTs N91775 and H97782 also align with the 3′ end of the gene sequences. This suggests the possibility that instead of a clone inversion, the cluster contains ESTs of a gene overlapping NFI on the opposite strand. This ambiguity between clone inversion and gene overlap motivated us to investigate the overlap case further.
Figure 3.


Examples of clusters from UniGene101 possibly containing clone reversal errors. (A) A cluster of retina-specific ESTs contains a clone reversal error. (B) A cluster containing ESTs that overlap the human nuclear factor I (NFI) gene. More information is need to decide whether this cluster contains a clone inversion event or is an example of genes overlapping on opposite strands.
Overlapping Genes on Opposite Strands
As seen above, the axiom that the 3′ ESTs/UTRs can be used to fingerprint genes can be flawed when the 3′ UTRs of different genes overlap on opposite strands and the existence of such cases has been noted (Ashworth 1993; Tsai et al. 1994; Houlgatte et al. 1995; Hillier et al. 1996). Here we attempt to identify cases where such overlap occurs to flag “problem” index groups and, more importantly, to understand any functional or evolutionary benefits of overlap. Because UniGene is indexed primarily by 3′ UTR and because the 3′ UTR is thought to contain less conservation than the 5′ UTR we have concentrated our search on the 3′ ends of genes.
First a data set of 3′ UTRs of known genes and another processing schema was used. We performed a search of UniGene101 for genes where the coding sequence positions are annotated. A total of 11,139 genes were isolated in this manner. The sequence annotations were used to extract the 3′ UTRs, and known repetitive elements were filtered out of the data set of UTRs. For this analysis the UniGene clustering was not used; we reclustered the data set using d2_cluster (Hide et al. 1994; J. Burke, D. Davison, and W. Hide, in prep.) and performed CRAW analysis on the resulting clusters. The clusters that had matching UTRs in different orientations were flagged as being possible cases of overlap on opposite strands, and when available, mapping information was used to confirm that the different genes were within close proximity. The 11,139 genes were put into 4,780 clusters. Table 2 shows 21 cases of possible overlap that were found according to the above rules, of which 11 were verified as being adjacent using mapping information. Overlapping similarities were checked for the AUUUA mRNA degradation motif (Akashi et al. 1994; Salehi-Ashtiani and Goldberg 1995) or its reverse complement to ensure that this documented phenomenon did not cause the overlap; and, of Table 2 entries, only human tumor necrosis factor was found to contain this motif. More precise mapping information offers stronger evidence that the observed matches are not simply due to some unannotated mobile element, such as an Alu sequence. Not all candidates selected were confirmed as being close according to the mapping information. For example, TPR (translocated promoter region), represented by GenBank accession numbers X66397 and U69668, and MGDF (megakaryocyte growth and development factor), represented by GenBank accession number U70136, are found on different chromosomes according to public mapping information and share a 100% identical inverse overlap of 142 bases in the 3′ UTR. Despite not being adjacent on the chromosome, the two genes possibly have a correlated function; X66397 TPR is involved in the activation of oncogenic kinases, and U70136 TPR is a growth factor. Other possible functional associations include accession numbers L41816 and AB000410 (calcium/calodulin-dependent protein kinase I and hOGG DNA damage repair-associated protein) and M63960 and U53174 (protein phosphatase 1 and cell cycle checkpoint control protein). Although the possibility that these two examples are due to an undocumented Alu or similar event is not ruled out because of a lack of precise mapping information, the related functions and the high level of identity of the sequence matches raise the possibility of another coregulatory function for 3′ UTRs.
Table 2.
Putative Cases of Gene Overlap in the 3‘UTR (Truncated)
| Accession no. hoG/direction | Annotation and functional notes | Chr. | Map information | Overlap (% identity) |
|---|---|---|---|---|
| X66397 | TPR (tpr) mRNA, involved in activation of oncogenic kinases | 1 | GDB:1006915 | |
| U69668 | human nuclear pore complex-associated protein TPR (tpr) mRNA | 1 | GDB:1006915 | |
| R.C. U70136 | megakaryocyte growth and development factor | 3 | 3q26.3–q27 | 142 bases (100%) |
| M63960 | human protein phosphatase-I (PPPI) catalytic subunit mRNA, complete coding sequence | |||
| J04759 | human PPPI α subunit (PPPIA) mRNA, 3‘ end | 11 | ||
| X70848 | human mRNA for PPPI catalytic subunit | |||
| S57501 | PPPI catalytic subunit | |||
| R.C. U53174 | human cell cycle checkpoint control protein mRNA, complete coding sequence | 231 bases (99%) | ||
| U40282 | integrin-linked kinase (ILK) | 11 | 11p15.5 | |
| R.C. U25816 | TATA-binding protein-associated factor 30 | 11 | 11p15.5 | |
| R.C. U13991 | TATA-binding protein-associated factor II 30 | 11 | 11p15.5 | 25 bases (100%) |
| L39891 | Homo sapiens polycystic kidney disease-associated protein (PKD1) gene | 16 | 16p13.33 | |
| U24497 | human autosomal dominant PKD1 | 16 | 16p13.3 | |
| L33243 | H. sapiens PKD1 mRNA | 16 | 16p13.3 | |
| R.C. L48546 | H. sapiens tuberin (TSC2) gene | 16 | 16p13.3 STS: G27421 | 61 bases (100%) |
| L41816 | CaMK I | |||
| R.C. AB000410 | hOGG1, involved in the repair of oxidative DNA damage | 58 bases (100%) | ||
| S70154 | human t-complex polypeptide 1 gene | 6 | 6pter | |
| R.C. X52882 | cytosolic acetoacetyl–coenzyme A thiolase | 6 | G30038, G11124; 6q25.3 | 92 bases (98%) |
Using the annotation, the 3‘ UTRs of full-length genes were extracted from UniGene 101 and subjected to cluster analysis. Twenty-one cases of possible gene overlap in the 3‘ UTR were isolated by looking for reverse complement matches in clusters. The R.C. notation prefixing the accession number signifies that the relative orientation is opposite that of genes without R.C. Where multiple accession nos. match the same gene, all are listed. Annotation, chromosomal assignment and mapping information, and number of bases overlap with sequence identity of match are given when available. For brevity, only a small portion of the result is shown here. The full table may be viewed as supplementary information at http://www.genome.org.
Measuring Increasing Information Quality and Abundance
Through processing, diversity analysis, and assembly, the quality and abundance of information in a gene index can be enhanced. UniGene selects the longest transcript within a cluster to be the representative of the index class and, hence, hopefully, the gene. In the case where no full-length gene sequence exists in an index class it is obvious that individual ESTs can sometimes be assembled to obtain a longer representation of the sampled gene sequence. Additionally, redundancy can be used to detect and correct insertion and deletion errors present in individual sequences to form a cleaner representative sequence. To measure the effectiveness of our analysis, we chart the number of ESTs in an assembly of a subgroup against the length of the resulting assembly. Figure 4A is generated by processing only ESTs (both 3′ and 5′) in clusters from UniGene98 and plotting the average and median assembly length versus the number of ESTs in the assembly. The effective assembly length can be doubled by having <10 sequences in an assembly, and effective length can be increased >400% by having <50 sequences. The final category (50) includes all assemblies made from 50 or more ESTs. The effective assembly length approaches the actual average gene length: The sequences classified as multipass or full-length in UniGene101 have an average length of 2102 and a median length of 1695 bases. To measure the effectiveness of insertion/deletion removal, we similarly plot the length of the longest ORF in an assembly (Fig. 4B). Because 3′ EST typically contains sequence from the UTR of the sampled gene we performed the processing only on 5′ ESTs from UniGene98 and plotted the average and median length in residues of the longest ORF in an assembly. The effective ORF size generated from EST fragments surpasses 50% of the full-length gene maximal ORF: The sequences classified as multipass or full-length in UniGene101 have an average maximal ORF length of 478 residues and a median length of 367 residues. Another indicator that the improvement seen is not simply due to longer transcripts coincidentally resulting in longer ORFs is that the percentage gain in ORF length corresponds directly with gain in assembly length over the smooth regions of the graphs in Figure 4. For example, both ORF length and assembly length were improved 50% by processing a cluster with 10 ESTs. The jagged lines toward the end of both plots are due to higher variance of the sample mean and sample median associated with smaller sample sizes for the larger clusters.
Figure 4.


(A) Length of consensus sequences resulting from CRAW assembly/analysis on 5′ and 3′ ESTs from UniGene98 after CRAW processing. The x-axis denotes the number of sequences in the UniGene cluster; the y-axis represents consensus length. By forming an assembly with between 10 and 15 ESTs the length of the resulting contig can be doubled on average. Assemblies made from clusters containing >45 ESTs result in contigs that are 400% longer than unassembled sequences. The effective assembly length approaches the actual gene length in UniGene101: the sequences classified as multipass/full-length have an average length (♦) of 2102 and a median length (▴) of 1695 bases. (B) Length of the maximal ORF was measured after performing CRAW assembly/analysis on 5′ ESTs from UniGene98 clusters. The longest ORF of the resulting consensus sequence (in residues) is plotted against the number of 5′ sequences in the cluster. The axes are as in A. The effective ORF size generated from EST fragments easily surpasses 50% of the full-length gene maximal ORF length: the sequences classified as multipass or full-length in UniGene101 have an average maximal ORF length (♦) of 478 residues and a median length (▴) of 367 residues. The improvement shown is the result of both assembly of ESTs into longer contigs and the correction of insertion and deletion errors using sequence redundancy.
The CRAW process partitions an index cluster into subclusters where each subgroup contains unique sequence information that might be lost or contaminated if only a single consensus is chosen to represent the entire cluster. Thus, a comparison of the number of subgroups generated against the number of original groups presents a measure of information preservation. As seen in Table 1, 45,559 UniGene101 clusters were subjected to processing, resulting in 99,338 subgroups (including singletons)—an increase of 53,779 representatives. Additionally, the rate of fragmentation is small in comparison to assembler approaches to gene indexing. The rate of resulting singletons from the TIGR HGI is 21.83% or 135,140 singleton groups out of a total 626,163 sequences input. CRAW analysis of UniGene clusters resulted in a fragmentation rate just over half of the TIGR HGI—13.96% or 58,070 singleton genes out of a total 415,833 sequences input. The reduced fragmentation rate is suggestive; however, the comparison is not rigorous because the initial data sets are different and our analysis ignores 359 of the initial 45,918 UniGene clusters.
Automatically Culling New Gene Forms from Transcript Data
Because EST sequence generation is a sampling of sufficiently transcribed genes, one would expect to happen upon alternate gene splice forms, polymorphisms, and gene families. As is the case with cloning and sequencing artifacts noted above, these phenomena can introduce inconsistent (unalignable) regions into a cluster and inconsistent sequences can be partitioned into disparate subclusters. In addition to increasing the sensitivity of expression studies, the subpartition provides a rapid method of screening regulated alternative splicing vesus constitutive splicing.
Figure 5 illustrates how the subpartition and CRAW analysis accommodates for multiple splice forms of a single gene. This CRAW report for a UniGene101 cluster shows 30 transcripts that can be represented as four consensus sequences and five outliers without information loss. Some sequences were deleted from Figure 5 for brevity. The cluster contains five full-length mRNAs each corresponding to a different splice form of RBP-MS (Shimamoto et al. 1996) a gene-sharing homology to the RNA-binding domain of the Drosophila couch potato gene. One mRNA, corresponding to type 4 RBP-MS, is not sampled by any ESTs and splice forms 2 and 3 are constitutively expressed as they contain transcripts from various tissues and developmental states.
Figure 5.
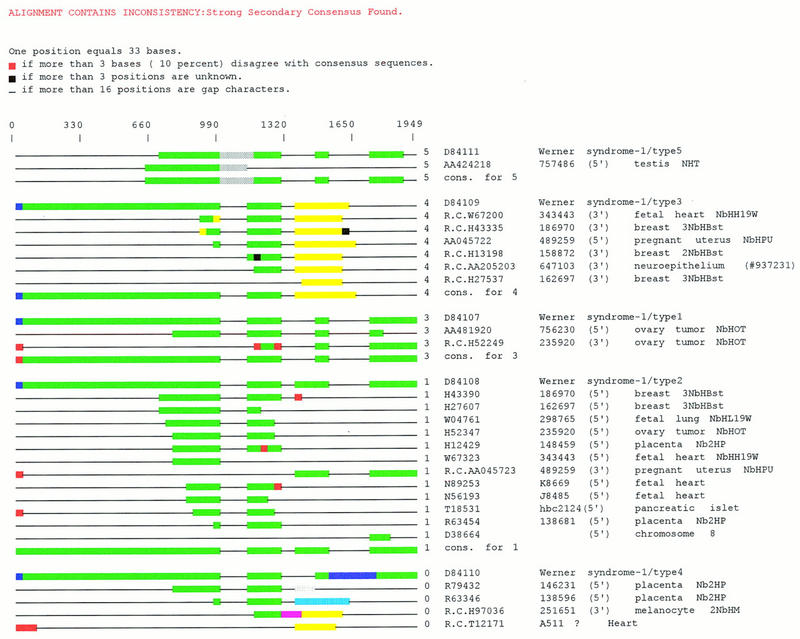
A set of ESTs from UniGene101 that sample an alternatively spliced gene. CRAW report for a UniGene101 cluster of 30 transcripts that can be represented as four consensus sequences and five outliers without information loss. Four sequences, representing GenBank accession nos. R36192, R36098, R63398, and R63347, were deleted for brevity. The cluster contains five full-length mRNAs each corresponding to a different splice form of RBP-MS, a gene-sharing homology to the RNA-binding domain of the Drosophila couch potato gene. One mRNA, corresponding to type 4 RBP-MS, is not sampled by any ESTs and splice forms 2 and 3 appear to be constitutively expressed. Black lines indicate gaps in the multiple alignment, black bars indicate indeterminate sequence, red bars indicate divergence from the sub-group consensus, and all other colors indicate discrete domains of sequence similarity.
Analysis of the composition of subclusters formed by CRAW analysis reveals many cases where an index cluster with diverse library content is partitioned into subclusters with library content specific to a certain tissue, developmental stage, or disease state. In many of these cases, the subclass structure adds sensitivity to gene expression specificity studies because biologically significant specificities to disease or developmental states can be found at the subcluster level that would be missed at the greater cluster level. To illustrate this, Figure 6 shows a UniGene101 cluster containing ESTs derived from calcium/calmodulin-dependent protein kinase (CAMK). This gene is also listed in Table 3. Of the 17 cluster members, 7 sequences (from four distinct clones) from an ovary tumor library form a clear subgroup. If one were to seek cancer-specific genes by looking at the original UniGene index cluster, the level of specificity to cancer libraries would be ∼53% = [100 × (9/17)]%; however, at the subcluster level the specificity level is 100%. Specificity levels also can be calculated by counting the number of distinct clones represented from each library, but this does not change the results for this example significantly. Table 3 lists 78 UniGene101 clusters in which the membership of a subcluster was specific to libraries of a specific disease state or tissue. The first 41 entries highlight cancer-specific forms, whereas the remaining 37 examples are from various libraries. Fishers (2 × 2) Exact Test (Rice 1988) is used as standard practice to test a null hypothesis of nonspecific gene expression (Audic and Claverie 1997; http://www.ncbi.nlm.nih.gov/ncicgap/fisher.html); and for the first 13 entries of Table 3, we include Fisher significance levels to test the null hypothesis that the alternate gene form is not differentially expressed with respect to cancer libraries. Many cases of subgroup specificity, however, occur in clusters of ESTs that match no full-length gene sequence (data not shown) and these should be prime candidates for early sequencing.
Figure 6.
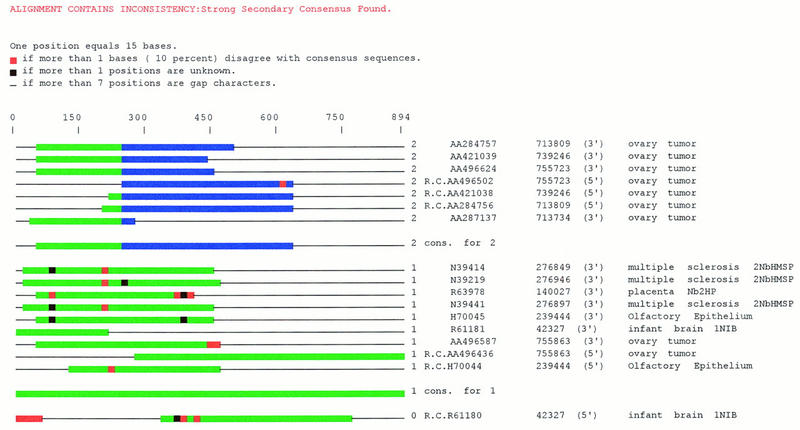
CRAW output (Java version) for a UniGene101 cluster with a cancer-specific alternative gene form. Subgroup 1 (in green) ESTs are identical to CAMK. The green regions of subgroup 2 are identical to subgroup 1 sequences, and the blue region of subgroup 2 diverges. This is an example of how effective subparitioning can add sensitivity to gene expression specificity studies. If one were to seek cancer-specific genes by looking at the original UniGene index cluster, the level of specificity to cancer libraries would only be ∼53% = (100 × 9/17)%; however, at the subcluster level, the specificity level is 100%.
Table 3.
Some Disease-State/Tissue-Specific Gene Forms Isolated through CRAW Analysis
| Some Library-Specific Forms with a Matching Gene in Public Databases | ||||
| Fisher significance level | Internal no. | Library specificity | Accession nos. of matching genes | Common gene name; functional notes |
|---|---|---|---|---|
| 0.007 | 32615 | ovary tumor | U66063, L07044 | CAMK |
| 0.01 | 1591 | ovary tumor | D26156, D29175 | transcriptional activator hSNF2b |
| 0.015 | 32240 | parathyroid tumor | M60974 | growth arrest and DNA damage-inducible protein |
| 0.022 | 4362 | cancer, various (cervical, colon) | M88579, Z11773 | zinc finger protein zfp-35 may act to control gene activity during prophase |
| 0.026 | 2335 | cancer, various (cervical, prostate) | X87613 | skeletal muscle-abundant protein |
| 0.033 | 25477 | cancer, various (cervical, colon, endometrial) | M29204 | binds to GC-rich sequences in epidermal growth factor |
| 0.040 | 17876 | cancer, various (colon, liver) | X16396 | NAD-dependent methylenetetrahydrofolate dehydrogenase |
| 0.045 | 717 | ovary tumor | U18291 | CDC-16, cell division control |
| 0.046 | 11462 | ovary tumor | U49785, Y11151 | dopachrome tautomerase (tyrosine-related protein 2), tumor antigen |
| 0.057 | 10942 | parathyroid tumor | D83702 | human brain mRNA for photolyase homolog, UV-induced DNA damage repair |
| 0.115 | 22783 | cancer, various (ovary, prostate) | X79201 | SYT, implicated in development of synovial sarcomas |
| 0.2 | 1266 | ovary tumor | X70218 | protein phosphatase 4 (formerly X) |
| 1.0 | 28992 | skin tumor I | Z48804 | ocular albinism gene |
Functional and library information for 78 UniGene 101 clusters, where subcluster membership was specific to libraries of a specific disease state or tissue. The first 41 entries highlight cancer libraries; the remaining 37 examples are from various libraries. For brevity, only the first 13 entries are shown. The full table may be viewed as supplementary information at htp://www.genome.org.
The ability of CRAW to automatically isolate alternate gene forms does not absolve the biologist of responsibility. Once an alternate gene form has been suggested, it is important to validate that it is biologically relevant and is not simply naturally occurring noise like amplification of a chance aberrant splicing or an immature transcript that contains introns. Another caveat is that library sampling bias sometimes leads to less specific results. For example, in searching for the cancer-specific version of genes, some register as having a splice form exclusively found in ovary tumor libraries. As of January 1998 there were 29,931 ESTs in UniGene derived from ovary libraries but only 4,899 of these came from non-cancer libraries (http://inhouse.ncbi.nlm.nh.gov/cgi-bin/UniGene/lbrowse?ORG=Hs). With >80% of ovary ESTs coming from cancer libraries, it would be difficult to tell from the existing EST data whether a splice form was ovary cancer specific or simply ovary specific.
DISCUSSION
We have noted that artifacts and alternate gene forms can introduce unalignable regions into clusters of transcripts and have used a technique (implemented in the CRAW program) to automatically perform an optimal partition of a cluster into subclusters such that the subclusters contain only alignable (consistent) regions. One advantage of these methods is that they can be effective even when the cluster members are ESTs that correspond to no sequenced gene. Additionally, we have given a visual representation of this partition and the divergence of sequences between and within subclusters. We have demonstrated that these methods can be used to ameliorate the damage to index clusters caused by artifact and that previously uncharacterized gene isoforms can be isolated. In many cases, the isoforms isolated by CRAW analysis are expressed differentially with respect to disease state, developmental stage, and tissue.
The schema shown in Figure 1 to get UniGene cluster information to the CRAW program has been scaled down from the data processing schema developed for STACKdb (Hide et al. 1997; R. Miller, A. Christoffels, J. Barker, and W. Hide, in prep.). CRAW is one of the tools used in STACKdb to address some of the organizational difficulties inherent in gene index construction. Sequences are put into loose groupings by similarity threshold (similar to minimal linkage clustering) (Johnson and Wichern 1992) and then segmented further into subclusters by CRAW analysis (comparable to maximal linkage clustering). The rationale for the application of CRAW in STACKdb is that index classes are safe from artifact, whereas gene isoforms and polymorphisms are isolated automatically but can still be viewed in the context of the entire index class. In contrast, the strict assembler-based approach (the method used in the current TIGR Gene Index) results in clusters that are accurate and relatively safe from chimerism and artifact, but information about the patterns of similarity between alternate gene forms is lost and index classes are fragmented. Methods that group sequences based on only a similarity threshold (e.g., see Houlgatte et al. 1995; Schuler et al. 1996) without further processing result in clusters that cannot be represented accurately by one representative sequence and also will be vulnerable to damage caused by chimeric clones and other artifacts. By offering a method that partitions artifact and divergent gene forms to disparate subclasses, it is often possible to correct for error and isoforms without disrupting the global structure of similarity threshold-based indexing projects. Another benefit seen in STACK is that the ability decouple the representative sequence generation and error-checking from the actual sequence clustering allows the introduction of higher error sequence into index construction resulting in higher gene sequence sampling. Decoupling also allows for easy integration with other gene indexing projects, as seen in this paper and its treatment of UniGene.
There is room for improvement in our method of detecting alternative gene forms. An unusually high sequencing error rate or failures in the multiple alignment process can cause sequences to be mistakenly excluded from membership in the “correct” subcluster. Development of a system to perform more accurate automatic discrimination of alternate splice forms is the focus of a separate group (A. Christoffels and W. Hide, in prep.). Another possible improvement in CRAW would be the use of sequence quality information, as is done in the PHRAP package, so that partitioning decisions are only based on high-quality regions in sequence. Inclusion of clone linkage information in the CRAW analysis would most likely lead to improved performance as well. One simple alternative to CRAW that was investigated was to define the subclusters by allowing a sequence assembler, like TIGR assembler or PHRAP, to make consistent assemblies and then to multiply align the resulting assemblies to obtain information about how the subgroups were related. One problem encountered was that the sequence assemblers were not reliable in assigning sequences to the appropriate subgroups even in cases where such assignments existed (data not shown but available from us upon request).
EST generation is a biased and limited sampling from variable locations of genes in the process of transcription. Also, the sampling distribution of ESTs from the various libraries is not entirely understood. These problems, along with the error inherent in current EST generation technology, make it difficult to draw solid biological conclusions from EST data alone. Despite these challenges, EST data have contributed much to gene discovery and expression studies; hence, the methods that we present to rapidly assist in containing damage caused by artifact, and increase the sensitivity of differential and specificity expression tests should be valuable to those that are attempting to harvest EST data to its full potential.
METHODS
Processing the UniGene set required additional tools and a processing schema (Fig. 1). Each UniGene cluster was subjected to a further clustering by d2_cluster (Hide et al. 1994; J. Burke, D. Davison, and W. Hide, in prep.). Ignoring sequences with <50 nondegenerate bases, we placed two sequences together if they share a region of 50 bases with at least 90% identity. Subsets of the cluster that do not share the above level of overlap (such as occurs when 5′ and 3′ ESTs do not overlap but are in the same index class) are put into separate subclusters.
After being correctly oriented and split into overlapping subgroups, all subgroups corresponding to a UniGene cluster are aligned using TIGR_msa (http://www.tigr.org/pub/sofware/TIGR_msa) using a MasPar massively parallel computer. Some larger clusters were not processed because of their size (see Table 1). The induced multiple alignment was then subjected to CRAW analysis for further partitioning into subgroups and consensus generation for each subgroup. Note that there is a difference between subgroups formed because of lack of overlap in the d2_cluster step of processing and subgroups formed during CRAW analysis, but we use the term subgroup to denote both events. Next we elaborate on the subpartitioning process in CRAW.
Group Partitioning Strategy
A decision to put two sequences into the same subclusters is contingent on their consistency. Two sequences are pairwise-inconsistent if a global alignment of the sequences contains a region of sufficient mismatch. This definition defines a property of sequences that is dependent on the results of an alignment algorithm. The fact that in many cases, there is more than one optimal alignment and that the alignment is dependent on the parameters and the type of alignment algorithm used makes the above definition of consistency more of a convention and less of an explicit definition. We define that a sequence is always pairwise consistent with itself. More formally, given the above conventions, two sequences that have been globally aligned, and three parameters [(W) Window Size; (SIM) Similarity Threshold; and ignore_first], the two sequences are pairwise consistent provided that—except for the first and last ignore_first bases—there is no contiguous region of length W in their alignment such that the sequences have less than (SIM × 100) percent identity. According to the user’s choice, the definition of similarity and mismatch may or may not allow for gaps at positions internal to both sequences. In examples shown in this report, internal gaps are counted against the allowable mismatch. The ignore_first parameter is needed because of quality problems at the ends of sequences. Two sequences are also pairwise inconsistent if they do not overlap over enough internal region. A set of more than two sequences is consistent if and only if every sequence in the set is pairwise-consistent with the consensus sequence derived for the set, letting the pairwise alignment between the sequence and the consensus be induced by a multiple alignment of the subgroup.
Groups of sequences are partitioned into subgroups such that every subgroup is consistent. It is important to construct an optimal subgrouping such that the number of resulting subgroups is minimal because the trivial solution of breaking a group of N sequences into N singleton subgroups would be consistent by our definitions but would be biologically uninformative. To accomplish a near-optimal subgrouping, maximal consistent subgroups are constructed via a greedy algorithm until all sequences in a group have been placed into a consistent parent subgroup. The initial state is that all sequences are unassigned to subgroups. An initial “seed” sequence of a subgroup is found by generating a consensus from all unassigned sequences and selecting the unassigned sequence with the highest level of identity to the consensus. The seed is also taken to be the initial consensus of the subgroup. After the initial sequence is chosen, the subgroup is iteratively grown by adding the next sequence consistent with the subgroup and reevaluating the consensus after the sequence is added. This continues until no more sequences may be added to the subgroup, at which point there are two possibilities: If there are sequences left that have not yet been assigned to a subgroup, then another subgroup is started; otherwise, the process stops.
The amount of information that can be lost to artifact or alternate gene forms is bounded above by the fact that no subgroup member contains a window of length W of less than (100 × SIM) percent identity with the subgroup consensus. Regions of internal sequence are found by looking for regions in the alignment where windows of gapped region size (G_R_S) contain over ceiling (GAP_PERCENT*G_R_S) gaps. The analysis in this paper used parameters G_R_S = 15 and GAP_PERCENT = 0.9. If several unrelated sequences result in a poor quality alignment, a simple majority consensus generation rule might sample the sequences such that a consensus is generated that is consistent with each individual sequence in the group even when some sequence pairs or subsets contain a high degree of mismatching. To prevent this, the consensus sequences are generated by an early bias-weighted method (details of this are available from us on request).
Databases, Searches, and Results Processing
BLAST and FASTA searches, as well as search results reporting and filtering, are performed with GeneWorld software from Pangea Systems (http://www.pangeasystems.com); the Java CRAW viewer is part of the Pangea Systems bioinformatics open platform. Filtering for repetitive elements in Overlapping Genes on Opposite Strands (in Results) was done with the CENSOR program (Jurka et al. 1996).
Acknowledgments
We express our appreciation to Matthew Huang and Thomas Defay for careful reading of this manuscript and many good ideas. Special thanks go to Rob Miller of the South African National Bioinformatics Institute (SANBI) for valuable discussions. Amanda Chou of Pangea Systems rendered much assistance with the Java-based CRAW viewer. Finally, anonymous reviewers made helpful comments and suggestions.
The publication costs of this article were defrayed in part by payment of page charges. This article must therefore be hereby marked “advertisement” in accordance with 18 USC section 1734 solely to indicate this fact.
Footnotes
E-MAIL jburke@pangeasystems.com; FAX (510) 628-0107.
REFERENCES
- Aaronson JS, Eckman B, Blevins RA, Borowski JA, Myerson J, Imran S, Elliston KO. Toward the development of a gene index to the human genome: An assessment of the nature of high-throughput EST sequence data. Genome Res. 1996;6:829–845. doi: 10.1101/gr.6.9.829. [DOI] [PubMed] [Google Scholar]
- Adams MD, Kelley JM, Gocayne JD, Dubnick M, Polymeropoulos MH, Xiao H, Merril CR, Wu A, Olde B, Moreno RF, et al. Complementary DNA sequencing: Expressed sequence tags and human genome project. Science. 1991;252:1651–1656. doi: 10.1126/science.2047873. [DOI] [PubMed] [Google Scholar]
- Adams MD, Dubnick M, Kerlavage AR, Moreno R, Kelley JM, Utterback TR, Nagle JW, Fields C, Venter JC. Sequence identification of 2,375 human brain genes. Nature. 1992;355:632–634. doi: 10.1038/355632a0. [DOI] [PubMed] [Google Scholar]
- Adams MD, Kerlavage AR, Flieschmann RD, Fuldner RA, Bult CJ, Lee NH, Kirkness EF, Weinstock KG, Gocayne JD, White O, et al. Initial assessment of human gene diversity and expression patterns based upon 83 million nucleotides of cDNA sequence. (Suppl.) Nature. 1995;377:3–17. [PubMed] [Google Scholar]
- Adams RM, Das S, Smith TF. Multiple domain protein diagnostic patterns. Protein Sci. 1996;5:1240–1249. doi: 10.1002/pro.5560050703. [DOI] [PMC free article] [PubMed] [Google Scholar]
- Akashi M, Shaw G, Hachiya M, Elstner E, Suzuki G, Koeffler P. Number and location of AUUUA motifs: Role in regulating transiently expressed RNAs. Blood. 1994;83:3182–3187. [PubMed] [Google Scholar]
- Altschul SF, Gish W, Miller W, Myers EW, Lipman DJ. Basic local alignment search tool. J Mol Biol. 1990;215:403–410. doi: 10.1016/S0022-2836(05)80360-2. [DOI] [PubMed] [Google Scholar]
- Ashworth A. Two acityl-CoA acetyltranferase genes located in the t-complex region of the mouse chromosome 17 partially overlap the Tcp-1 and Tcp-1x genes. Genomics. 1993;18:195–198. doi: 10.1006/geno.1993.1454. [DOI] [PubMed] [Google Scholar]
- Audic S, Claverie JM. The significance of digital gene expression profiles. Genome Res. 1997;7:986–995. doi: 10.1101/gr.7.10.986. [DOI] [PubMed] [Google Scholar]
- Benson DA, Boguski MS, Lipman DJ, Ostell J. GenBank. Nucleic Acids Res. 1994;22:3441–3444. doi: 10.1093/nar/22.17.3441. [DOI] [PMC free article] [PubMed] [Google Scholar]
- Boguski MS, Schuler GD. ESTablishing a human transcript map. Nature Genet. 1995;10:369–371. doi: 10.1038/ng0895-369. [DOI] [PubMed] [Google Scholar]
- Boguski MS, Lowe TM, Tolstohev CM. DbEST: Database for “expressed sequence tags.”. Nature Genet. 1993;4:332–333. doi: 10.1038/ng0893-332. [DOI] [PubMed] [Google Scholar]
- Eckman, B.A., J.S. Aaronson, J.A. Borkowski, W.J. Bailey, K.O. Elliston, A.R. Williamson, and R.A. Blevins. 1998. The Merck Gene Index Browser: An extensible data integration system for gene finding, gene characterization and EST data mining. Comput. Appl. Biosci. (in press). [DOI] [PubMed]
- Grillo G, Attimonelli M, Liuini S, Pesole G. CLEANUP: A fast computer program for removing redundancies from nucleotide sequence databases. Comput Appl Biosci. 1996;12:1–8. doi: 10.1093/bioinformatics/12.1.1. [DOI] [PubMed] [Google Scholar]
- Hide W, Burke J, Davison D. Biological Evaluation of d̂2, an algorithm for high-performance sequence comparison. J Comp Biol. 1994;1:199–215. doi: 10.1089/cmb.1994.1.199. [DOI] [PubMed] [Google Scholar]
- Hide W, Burke J, Christoffels A, Miller R. A novel approach towards a comprehensive consensus representation of the expressed human genome. In: Miyano S, Takagi T, editors. Genome informatics 1997. Tokyo, Japan: Universal Academy Press; 1997. pp. 187–196. [Google Scholar]
- Hillier L, Lennon G, Becker M, Bonaido MF, Chiapelli B, Chissoe S, Dietrich N, DuBuque T, Favello A, Gish W, et al. Generation and analysis of 280,000 expressed sequence tags. Genome Res. 1996;6:807–826. doi: 10.1101/gr.6.9.807. [DOI] [PubMed] [Google Scholar]
- Houlgatte R, Mariage-Samson R, Duprat S, Tesslier A, Bentolila S, Lamy B, Auffray C. The GenExpress Index: A resource for gene discovery and the genic map of the human genome. Genome Res. 1995;5:272–304. doi: 10.1101/gr.5.3.272. [DOI] [PubMed] [Google Scholar]
- Hudson TJ, Stein LD, Gerety SS, Ma J, Castle AB, Silva J, Slonim DK, Baptista R, Kruglyak L, Xu S, et al. An STS-based map of the human genome. Science. 1995;270:1945–1954. doi: 10.1126/science.270.5244.1945. [DOI] [PubMed] [Google Scholar]
- Johnson RA, Wichern DW. Applied multivariate statistical analysis. 3rd ed. Englewood Cliffs, NJ: Prentice-Hall; 1992. [Google Scholar]
- Jurka J, Klonowski P, Dagman V, Pelton P. CENSOR—A program for identification and elimination of repetitive elements from DNA sequences. Comput Chem. 1996;20:119–121. doi: 10.1016/s0097-8485(96)80013-1. [DOI] [PubMed] [Google Scholar]
- Matsubara K, Okubo K. Identification of new genes by systematic analysis of cDNAs and database construction. Curr Opin Biotechnol. 1993;4:672–677. doi: 10.1016/0958-1669(93)90048-2. [DOI] [PubMed] [Google Scholar]
- Okubo K, Hori H, Matuba R, Niiyama T, Matsubara K. A novel system for large-scale sequencing of cDNA by PCR amplification. DNA Sequence. 1991;2:137–144. doi: 10.3109/10425179109039684. [DOI] [PubMed] [Google Scholar]
- Okubo K, Hori H, Matuba R, Niiyama T, Fukushima A, Kiojima Y, Matsubara K. Large-scale cDNA sequencing analysis of quantitative and qualitative aspects of gene expression. Nature Genet. 1992;2:173–179. doi: 10.1038/ng1192-173. [DOI] [PubMed] [Google Scholar]
- Okubo K, Yoshii J, Yokouchi H, Kameyama M, Matsubara K. An expression profile of active genes in human colonic mucosa. DNA Res. 1994;1:37–45. doi: 10.1093/dnares/1.1.37. [DOI] [PubMed] [Google Scholar]
- Parsons JD. Improved tools for DNA comparison and clustering. Comput Appl Biosci. 1995;11:603–613. doi: 10.1093/bioinformatics/11.6.603. [DOI] [PubMed] [Google Scholar]
- Pearson WR. Rapid and sensitive sequence comparison with FASTP and FASTA. In: Doolittle RF, editor. Molecular evolution: Computer analysis of protein and nucleic acid sequences, methods in enzymology. San Diego, CA: Academic Press; 1990. pp. 63–98. [DOI] [PubMed] [Google Scholar]
- Rice J. Mathematical statistics and data analysis. Pacific Grove, CA: Wadsworth and Brooks/Cole; 1988. [Google Scholar]
- Salehi-Ashtiani K, Goldberg E. Posttranscriptional regulation of primate Ldhc mRNA by its AUUUA-like elements. Mol Endocrinol. 1995;9:1782–1790. doi: 10.1210/mend.9.12.8614414. [DOI] [PubMed] [Google Scholar]
- Schuler GD, Boguski MS, Stewart EA, Stein LD, Gyapay G, Rice K, White RE, Rodriguez-Tome P, Aggarwal A, Bajorek E, et al. A gene map of the human genome. Science. 1996;274:540–546. [PubMed] [Google Scholar]
- Shimamoto A, Kitao S, Ichikawa K, Suzuki N, Yamabe Y, Imamura O, Tokutake Y, Satoh M, Matsumoto T, Kuromistu J, et al. A unique gene that spans over 230 kb in the human chromosome 8p11–12 and codes multiple family proteins sharing RNA-binding motifs. Proc Natl Acad Sci. 1996;93:10913–10917. doi: 10.1073/pnas.93.20.10913. [DOI] [PMC free article] [PubMed] [Google Scholar]
- Sonnhammer ELL, Kahn D. Modular arrangement of proteins as inferred from analysis of homology. Protein Sci. 1994;3:482–492. doi: 10.1002/pro.5560030314. [DOI] [PMC free article] [PubMed] [Google Scholar]
- Sonnhammer ELL, Eddy SR, Durbin R. Pfam: A comprehensive database of protein families based on seed alignments. Proteins. 1997;28:405–420. doi: 10.1002/(sici)1097-0134(199707)28:3<405::aid-prot10>3.0.co;2-l. [DOI] [PubMed] [Google Scholar]
- Sutton G, White O, Adams MD, Kerlavage AR. TIGR Assembler: A new tool for assembling large shotgun sequencing projects. Genome Sci Technol. 1995;1:9–18. [Google Scholar]
- Tsai JY, Namin-Gonzales ML, Silver LM. False association of human ESTs. Nature Genet. 1994;2:321–322. doi: 10.1038/ng1294-321. [DOI] [PubMed] [Google Scholar]
- Venter, J.C. 1993. Identification of new human receptor and transporter genes by high throughput cDNA (EST) sequencing. J. Pharm. Pharmacol. (Suppl. 1) 45: 355–360. [PubMed]
- White O, Kerlavage AR. TDB: New databases for biological discovery. Methods Enzymol. 1996;206:27–41. doi: 10.1016/s0076-6879(96)66004-2. [DOI] [PubMed] [Google Scholar]
- Williamson AR, Elliston KO, Sturchio JL. The Merck Gene Index, a public resource for genomics research. J NIH Res. 1995;7:61–63. [Google Scholar]
- Wolfsberg TG, Landsman D. A comparison of expressed sequence tags (ESTs) to human genomic sequences. Nucleic Acids Res. 1997;25:1626–1632. doi: 10.1093/nar/25.8.1626. [DOI] [PMC free article] [PubMed] [Google Scholar]
- Worley KC, Wiese BA, Smith R. BEAUTY: An enhanced BLAST-based search tool that integrates multiple biological information Resources into sequence similarity results. Genome Res. 1995;5:173–184. doi: 10.1101/gr.5.2.173. [DOI] [PubMed] [Google Scholar]